Intermarket Analysis — InterMarketEdge

Intermarket Analysis

Cross-asset correlation studies — how oil, yields, equities, and FX interact and what divergences signal

EURJPY Week W34-2026: Trend Holds Above 184.86, But a BOJ Carry-Unwind Warning Keeps Buyers Cautious

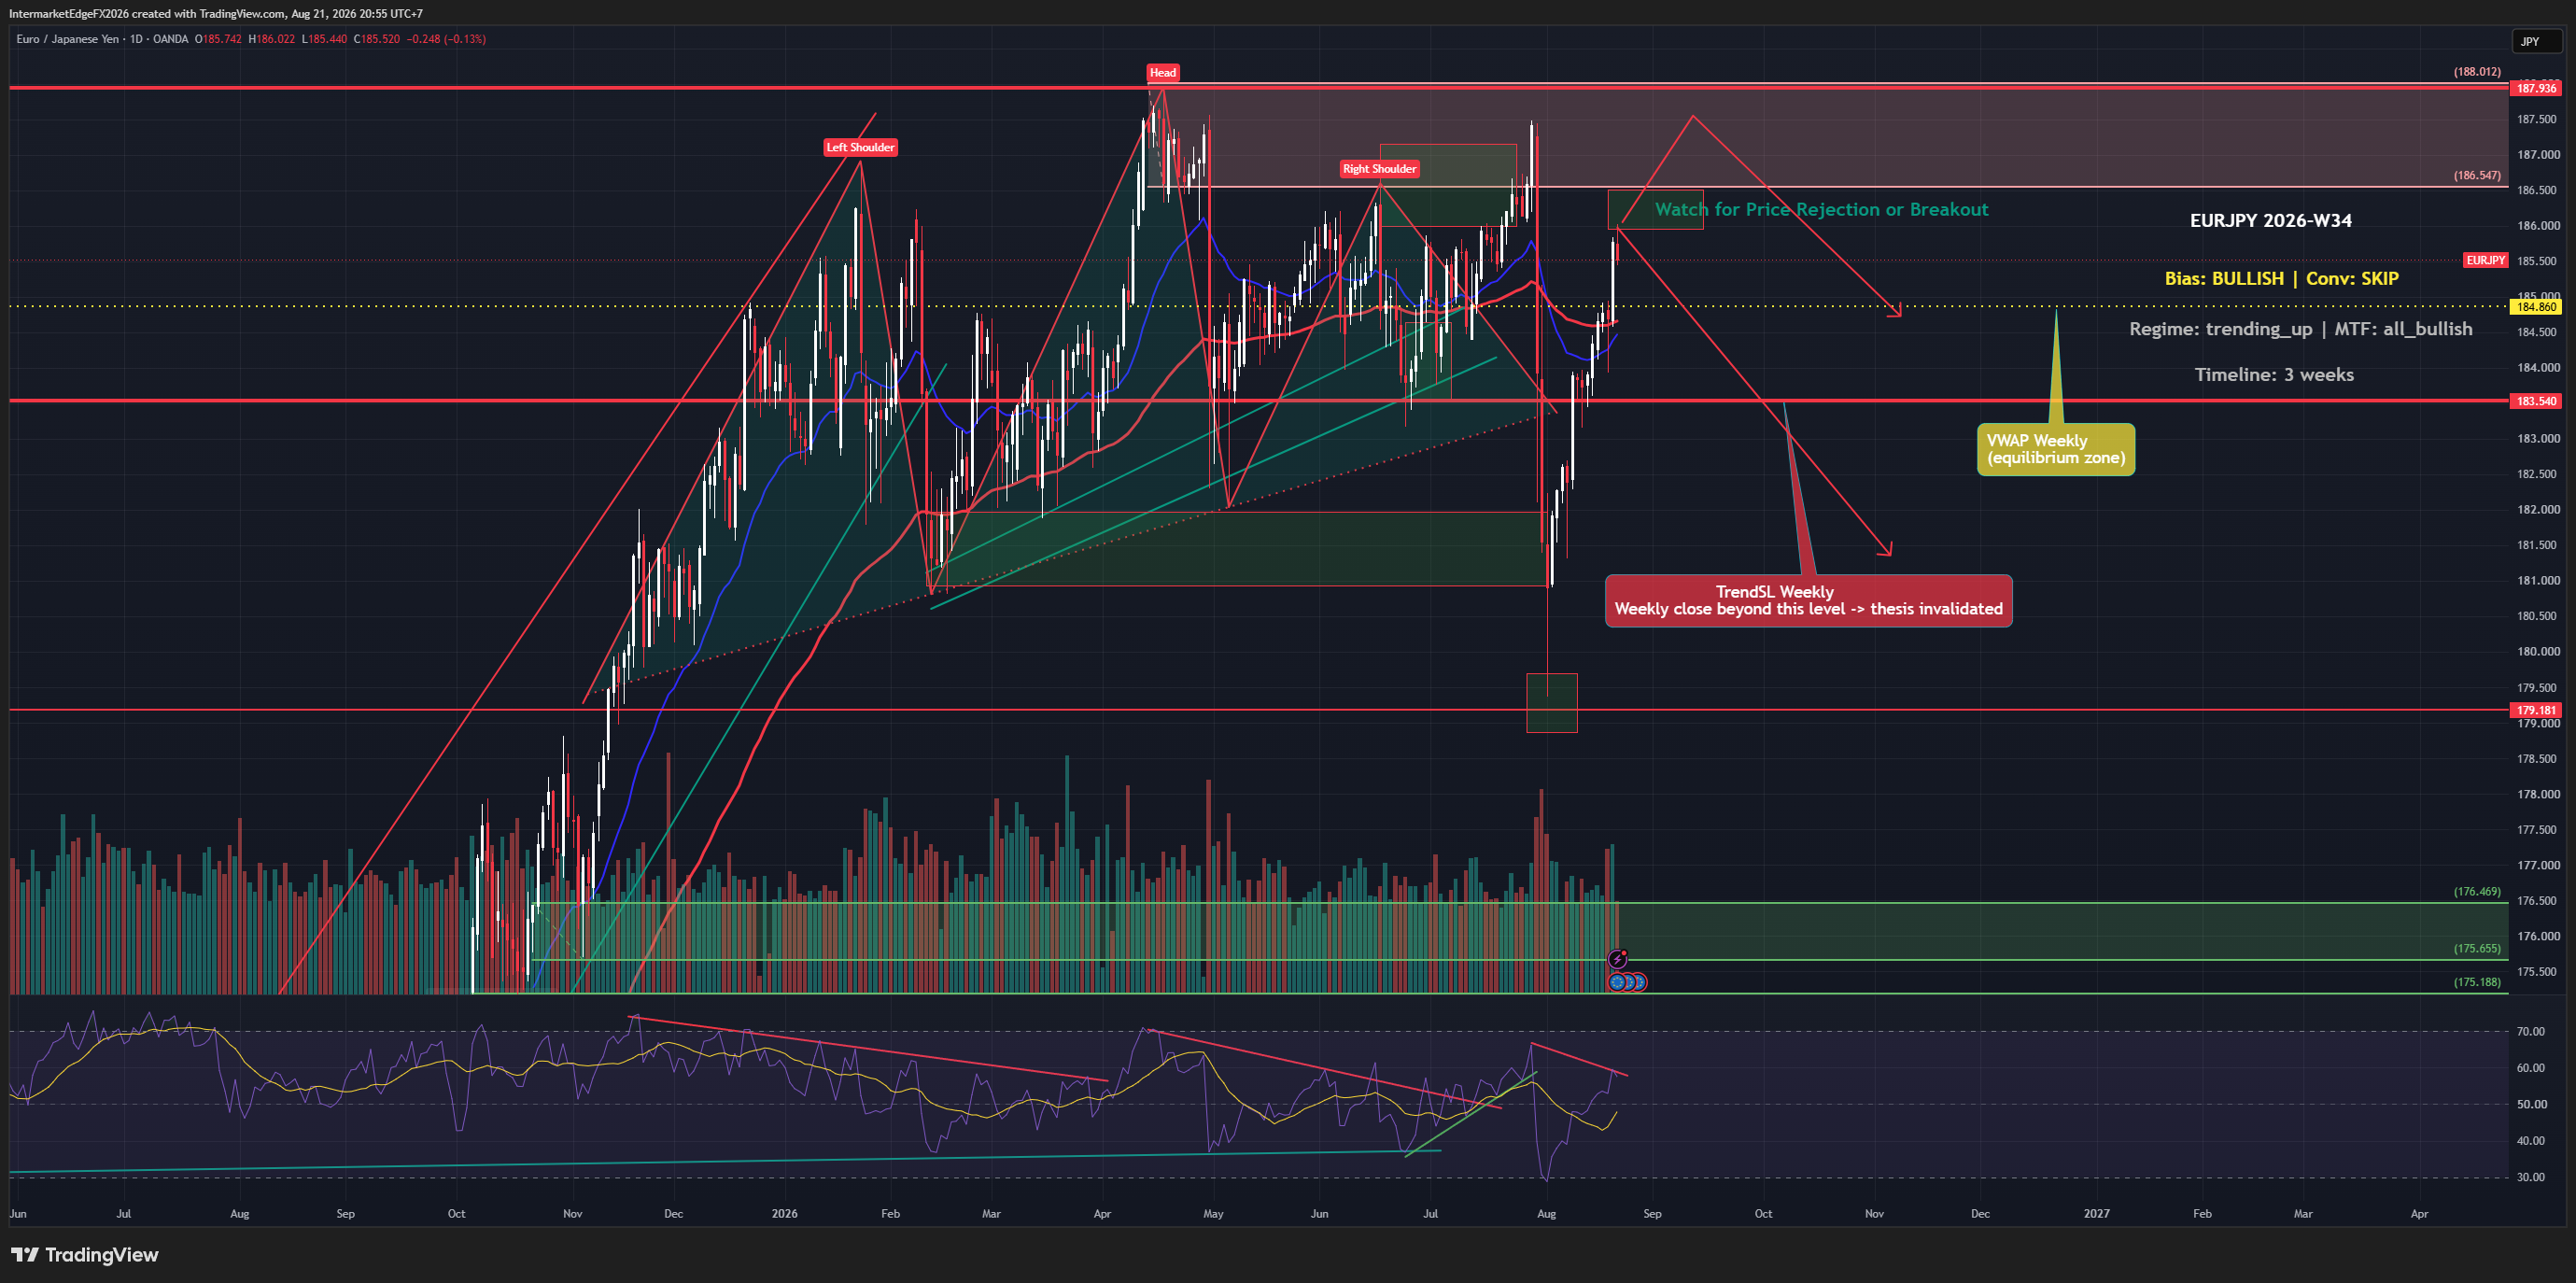
EURJPY Week W34-2026: Trend Holds Above 184.86, But a BOJ Carry-Unwind Warning Keeps Buyers Cautious

EURJPY is trading at 185.65 as of Friday, 21 August 2026, above its weekly VWAP at 184.86, with daily, weekly, and monthly trend all pointing the same direction. That alignment sounds clean, but Japan's 52nd consecutive Core-Core CPI increase is keeping BOJ rate-hike expectations alive, and a carry unwind triggered by BOJ policy tightening could erase a technically sound bullish setup faster than most traders anticipate. The structure is bullish. The macro is not cooperating. The structural bias for EURJPY through the next three weeks is bullish, and that verdict rests entirely on price action: daily, weekly, and monthly trend are all aligned upward simultaneously, which is the highest-conviction technical signal this framework can register. When all three timeframes agree, trend-following logic argues for giving the move room to continue rather than fighting it. The current market price of 185.65, recorded on Friday, 21 August 2026, sits above both the weekly VWAP of 184.86 and the weekly trend stop-loss at 183.54, meaning the price structure has not yet given a technical reason to abandon the bullish read. The honest complication is that price action is operating in isolation here. COT positioning, liquidity signals, and sentiment data are all neutral, no confirming flows are reinforcing what the charts suggest. That leaves the bull case technically sound but fundamentally thin. More significantly, macro signals are leaning bearish, driven by BOJ hawkishness carry-unwind risk carrying a meaningful weight in the overall picture. A carry unwind, where yen funding costs rise enough to force traders out of long EURJPY positions regardless of chart structure, does not care about multi-timeframe alignment; it can override technical setups quickly and with little warning. The result is a bullish directional bias that the framework cannot yet support with enough confirming evidence to justify sizing a position. -- Intermarket Edge (Note: COT (Commitment of Traders) data
XAUUSD Week W34-2026: Fed-Hike Bets Collapse and Gold Climbs, But the Structural Ceiling at 4438 Remains Unbroken

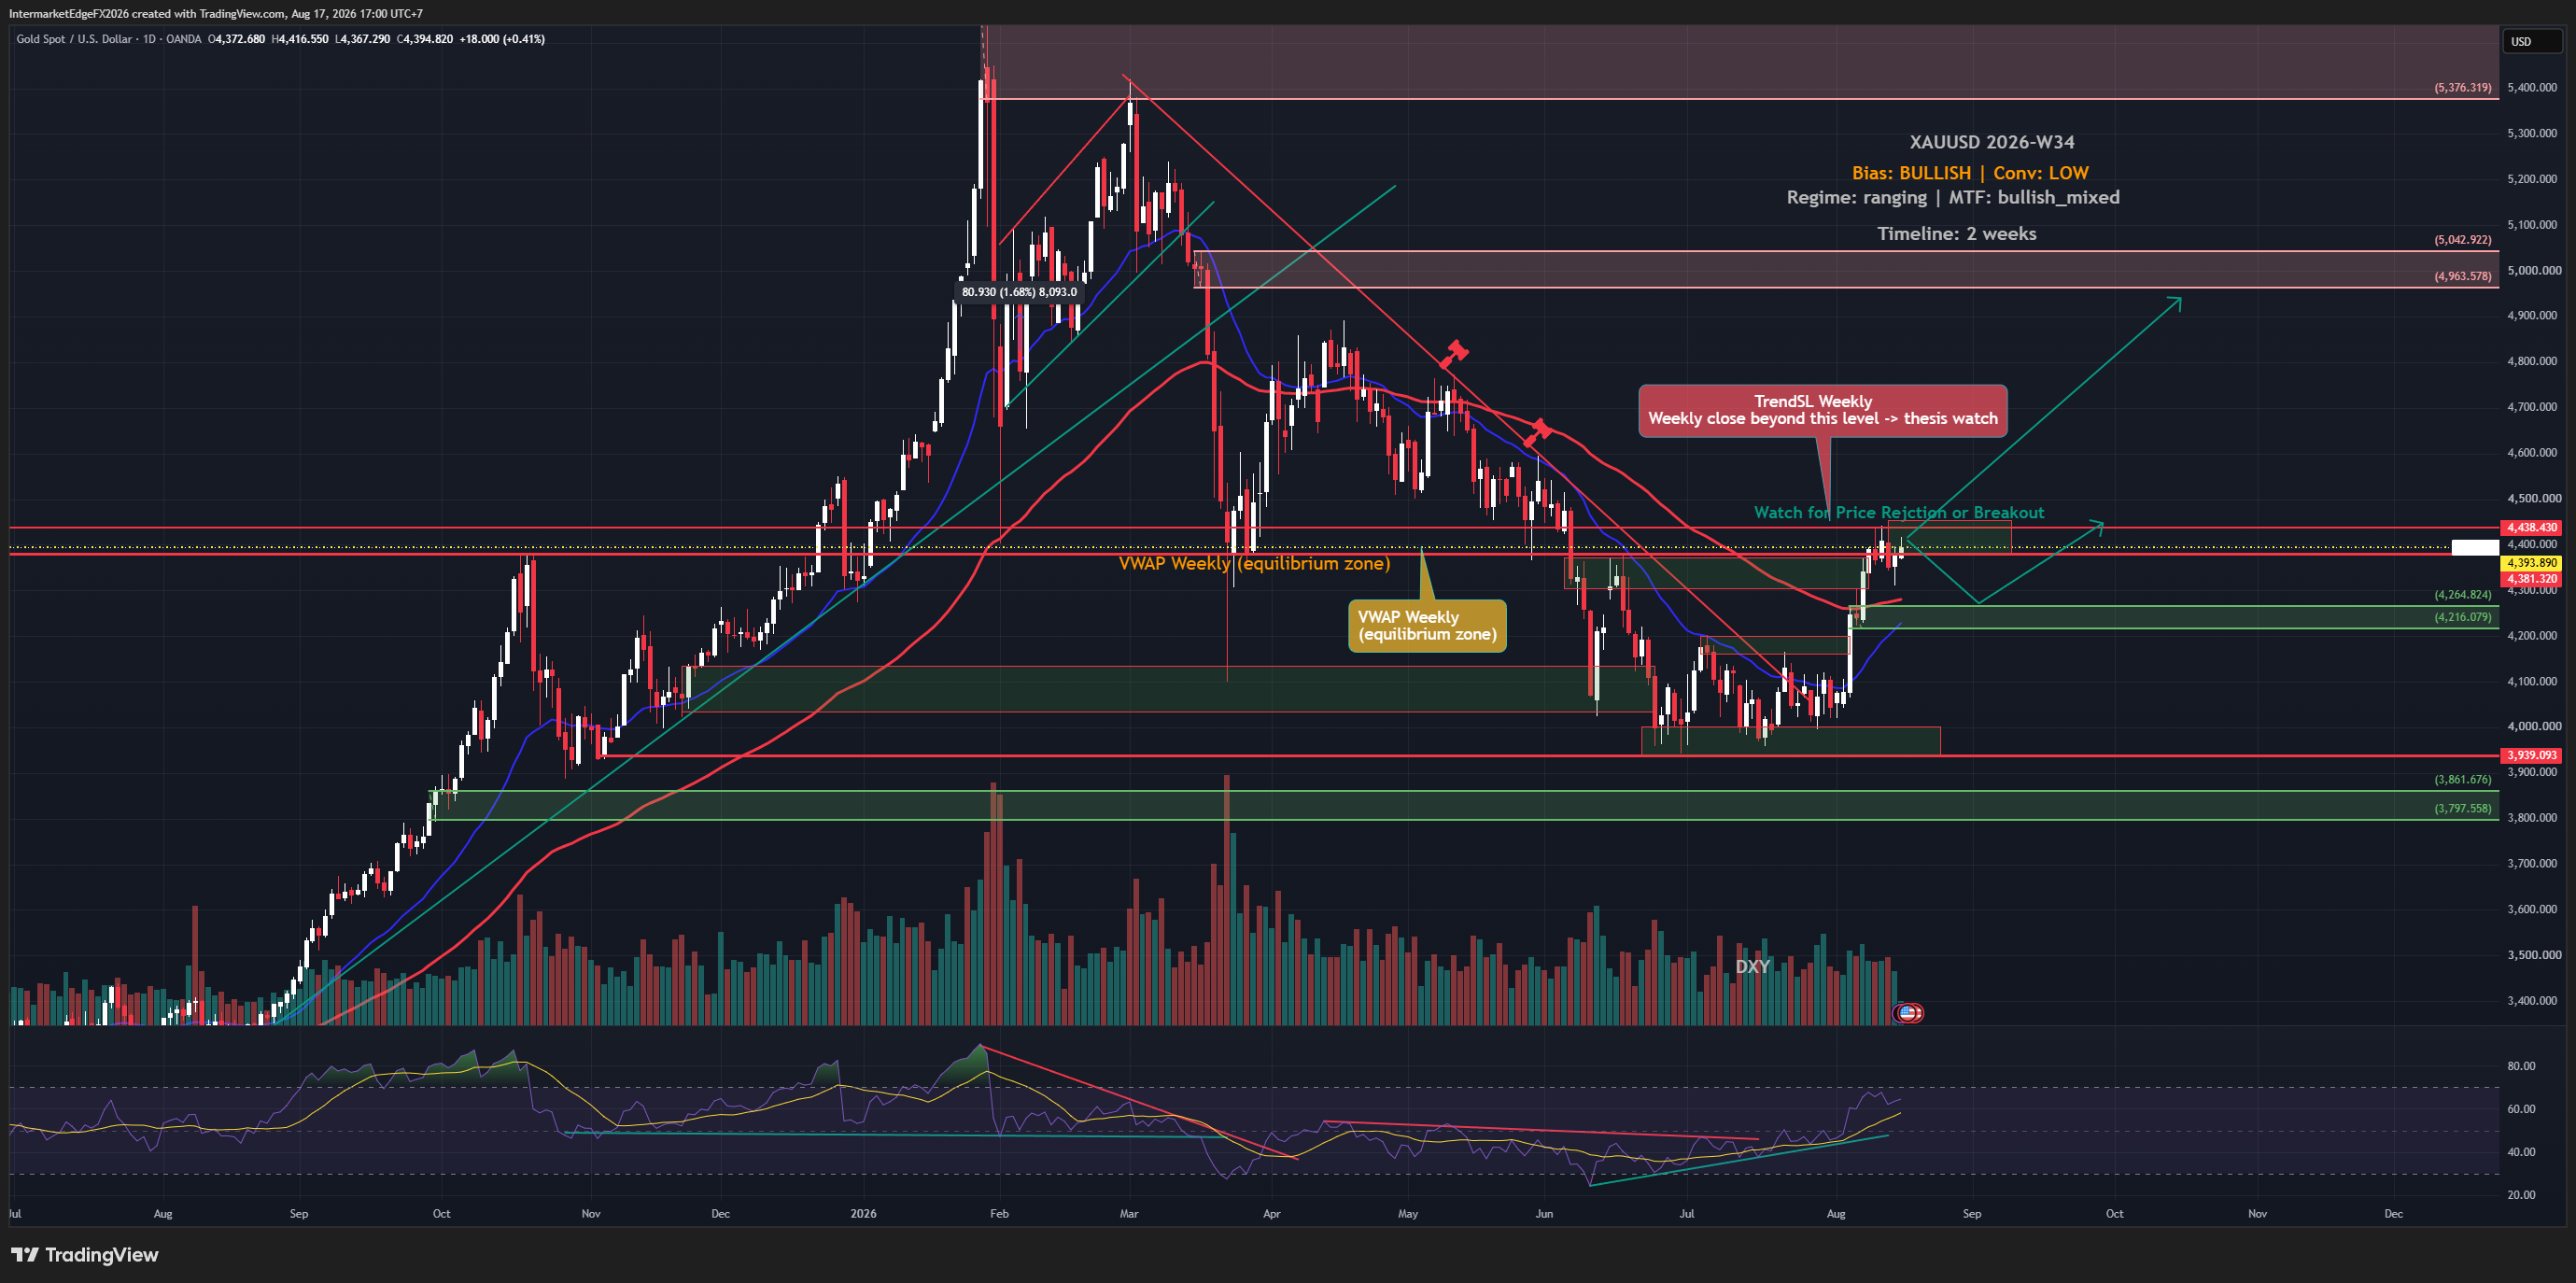
XAUUSD Week W34-2026: Fed-Hike Bets Collapse and Gold Climbs, But the Structural Ceiling at 4438 Remains Unbroken

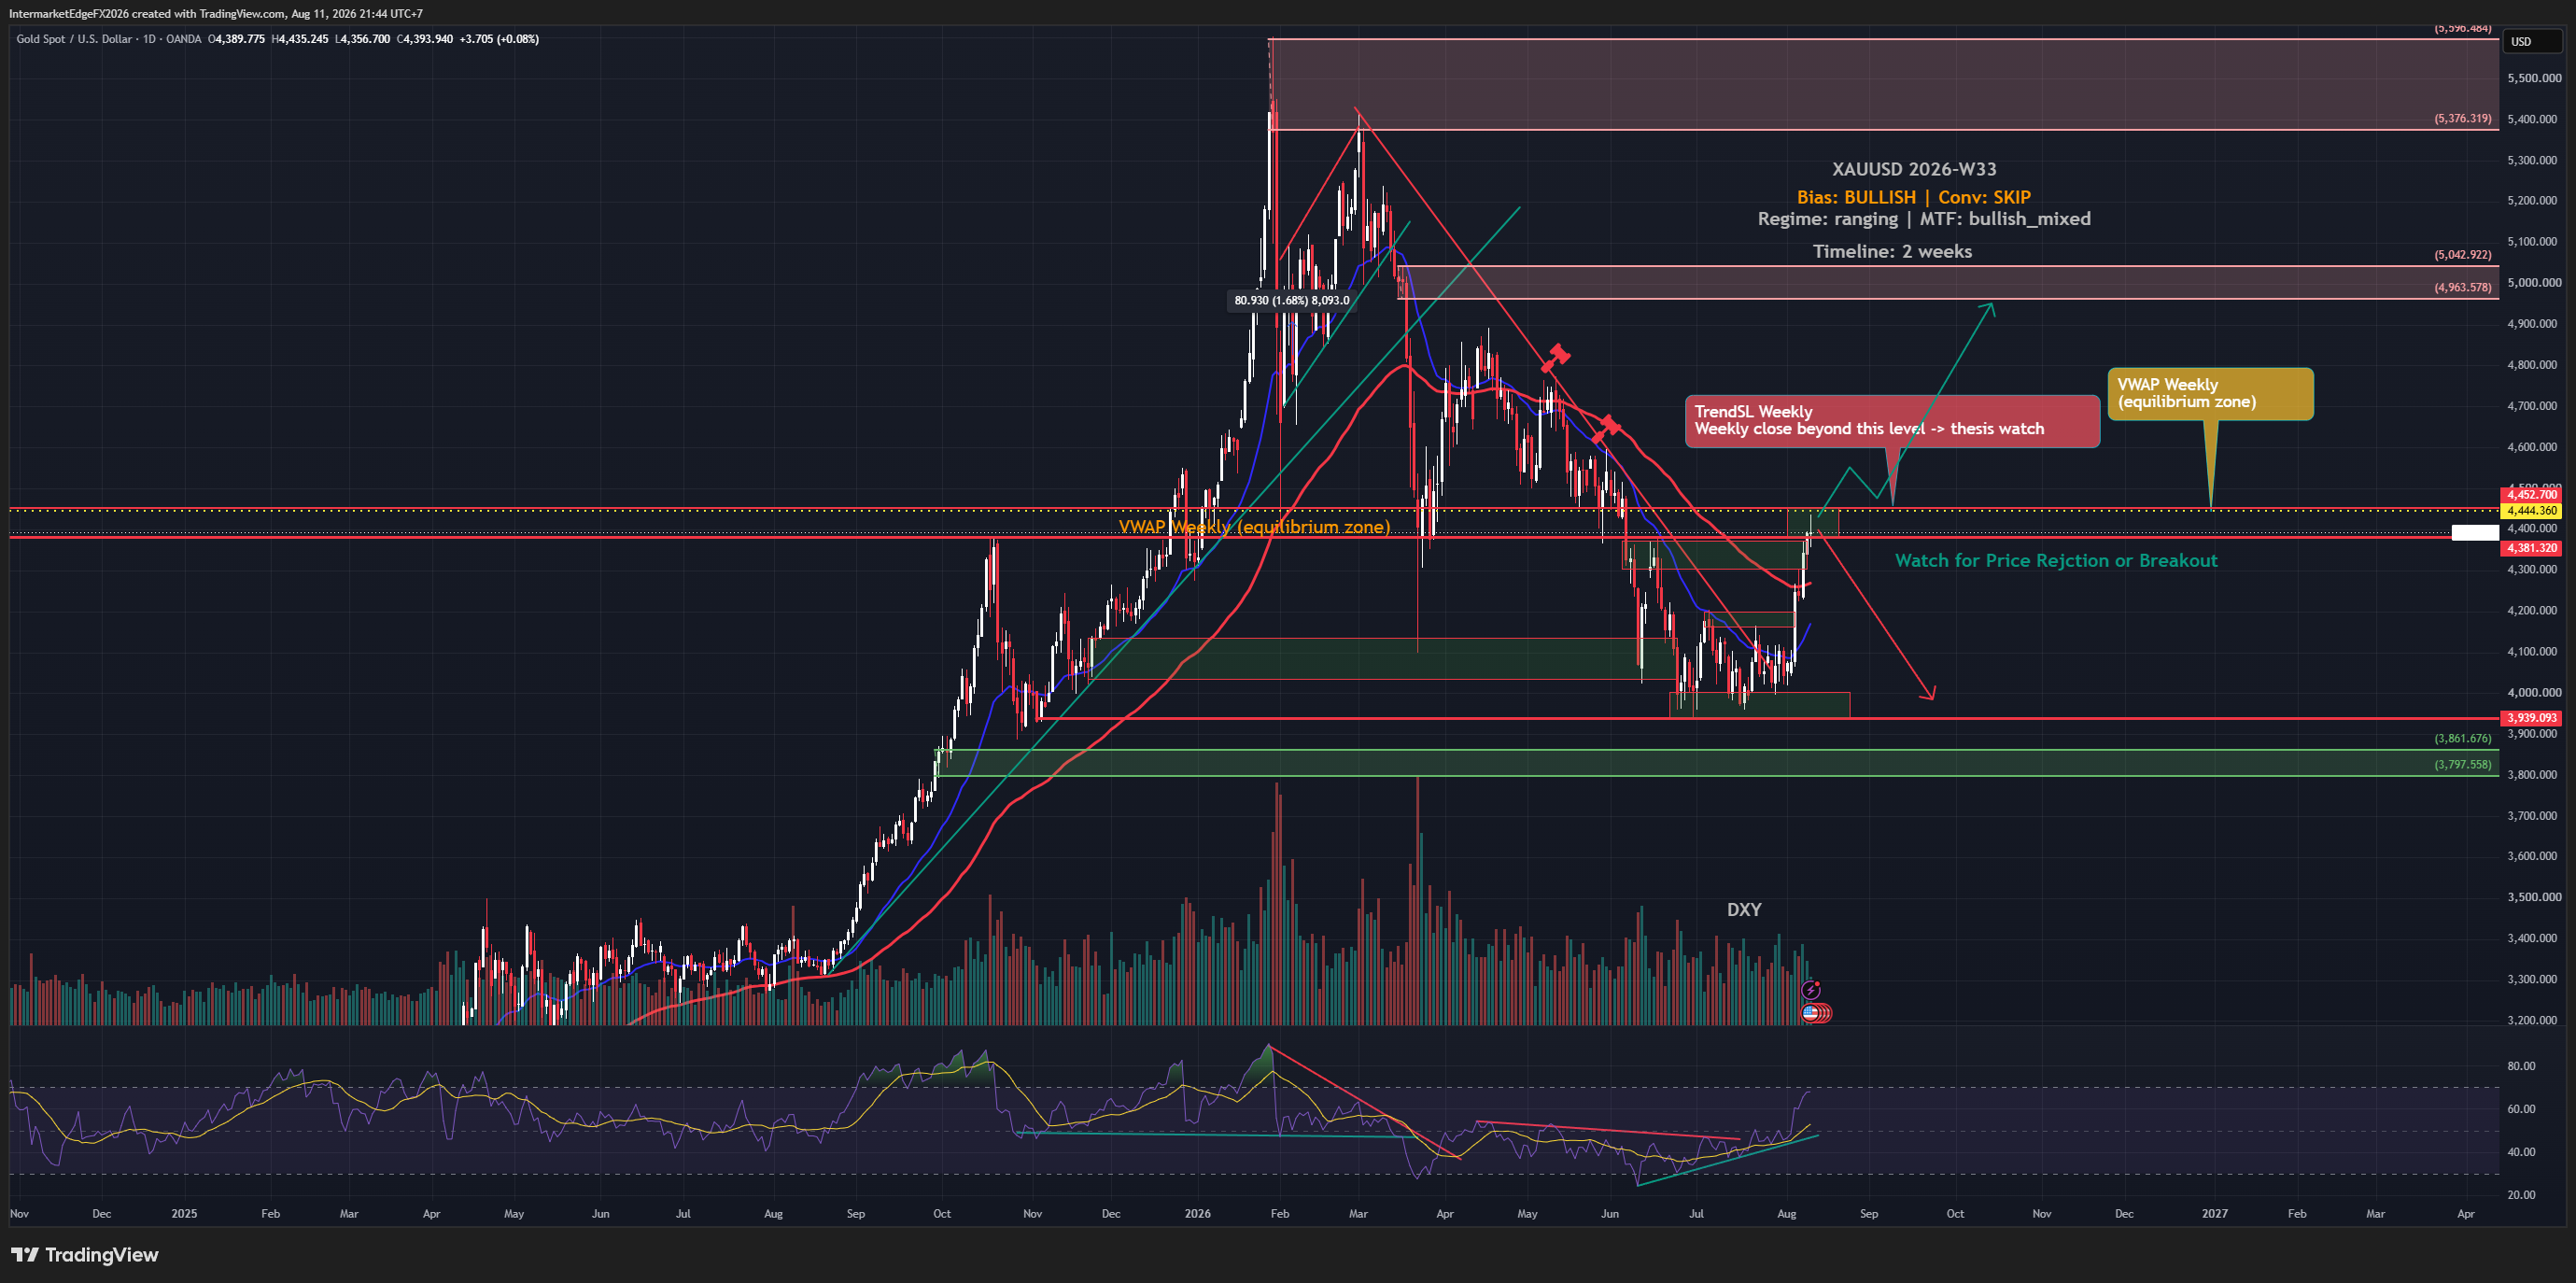
Gold is climbing toward $4,400 as Fed rate-hike bets collapse and the dollar softens, yet the bullish structure is not yet confirmed. Price on Monday, 17 August 2026 sits at 4394.5, marginally above the weekly VWAP but still well below the key trend structure level at 4438.43. The driver that was supposed to cap gold, Fed hawkishness, has been largely invalidated by the market itself, flipping the conventional bearish narrative on its head. The framework's bias for XAUUSD this week is bullish, but that label requires immediate qualification: conviction is low, and the structural picture at the time of thesis generation actually argues against the bullish call rather than supporting it. The reference close price of 4397.83 was already sitting below the weekly trend structure level at 4438.43 when the thesis was set, which means the bullish label is a directional lean, driven primarily by price action and COT positioning, not a technically confirmed trend. That distinction matters because it changes how much weight any given piece of confirming evidence should carry. The two active pillars supporting the bullish case are price behavior and COT positioning. On the COT side, commercial and speculative positioning in Comex gold futures and options as of the August 14 report leans bullish, but the specific net-position figure and the precise breakdown between commercial hedgers and large speculators are not available here, so this should be read as directional evidence, not a citable standalone number. On price, the multi-timeframe alignment is described as bullish-mixed: some shorter timeframes confirm the directional lean, others do not. Cutting across both pillars is a live Fed-hawkish causal chain that argues the opposite direction, rising real yields reducing gold's appeal, and these forces are partially offsetting each other right now. -- Intermarket Edge (Note: COT (Commitment of Traders) data is released weekly by the CFTC with a reporting-period lag -- it is no
USOIL Week W33-2026: Inventory Builds and Hormuz Uncertainty Leave Oil Caught Between 81.12 and 85.31

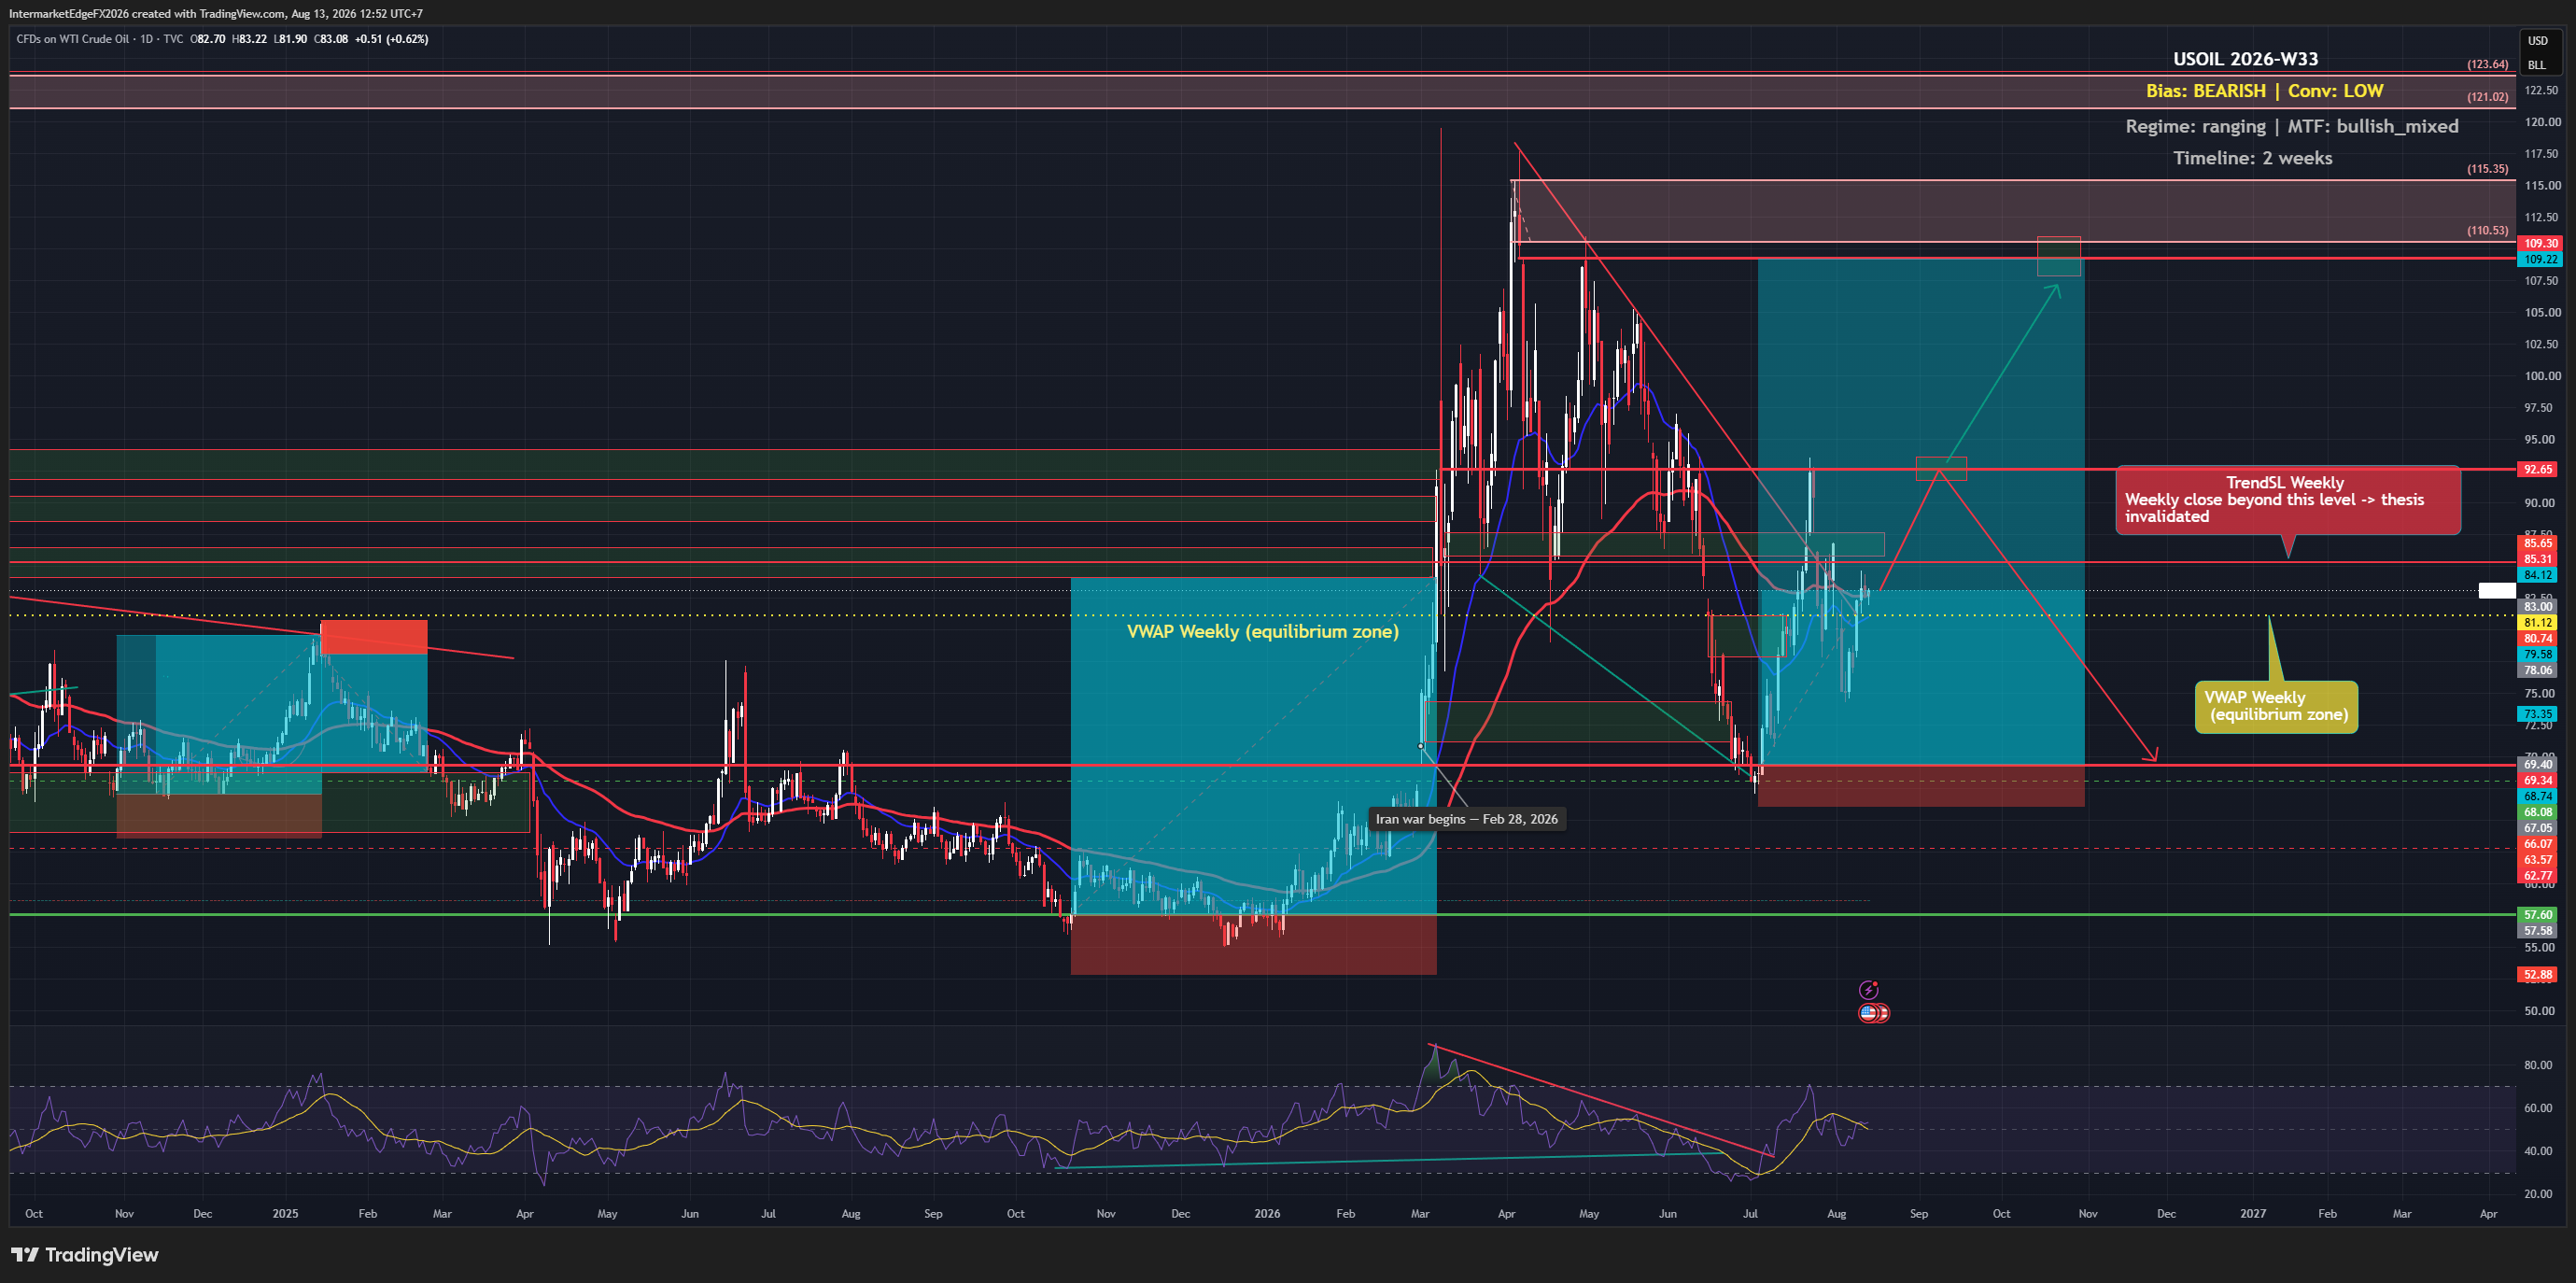
USOIL Week W33-2026: Inventory Builds and Hormuz Uncertainty Leave Oil Caught Between 81.12 and 85.31

USOIL is trading at 82.90 on the CL=F futures contract used as proxy, caught between a four-week streak of crude inventory builds averaging above 1.5 million barrels and a COT positioning read that still leans bullish. The macro story, rising real yields, a stronger dollar impulse, and China's structural shift away from gasoline, points lower. But price has not broken down yet, and that gap between the fundamental case and actual price behavior is exactly where traders get into trouble this week. The framework's output for W33-2026 is a bearish bias on USOIL, but the conviction is deliberately low, and that low conviction is not a soft bearish call, it is a signal that the evidence is conflicted enough to warrant real caution before sizing any directional position. Here is why the conflict matters: price, COT positioning, and the technical read all carry bullish signals in isolation. COT data shows a bullish lean among non-commercial participants, though the brief does not specify the exact report week, net-position figure, or sample, so this should be read as directional evidence rather than a precise citable statistic. Price itself is above the weekly VWAP at 82.90, meaning short-term momentum has not rolled over yet. And the multi-timeframe alignment reads as bullish-mixed, not cleanly bearish. What flips the framework's output to bearish despite all that is the macro overlay: the combination of a rising real yield environment creating dollar-bullish pressure, four consecutive weeks of crude inventory accumulation averaging above 1.5 million barrels per the EIA's actual reported figures, and the structural demand erosion from China's accelerating EV adoption together form a weight that the bullish positioning signals have not yet been able to lift price through. -- Intermarket Edge

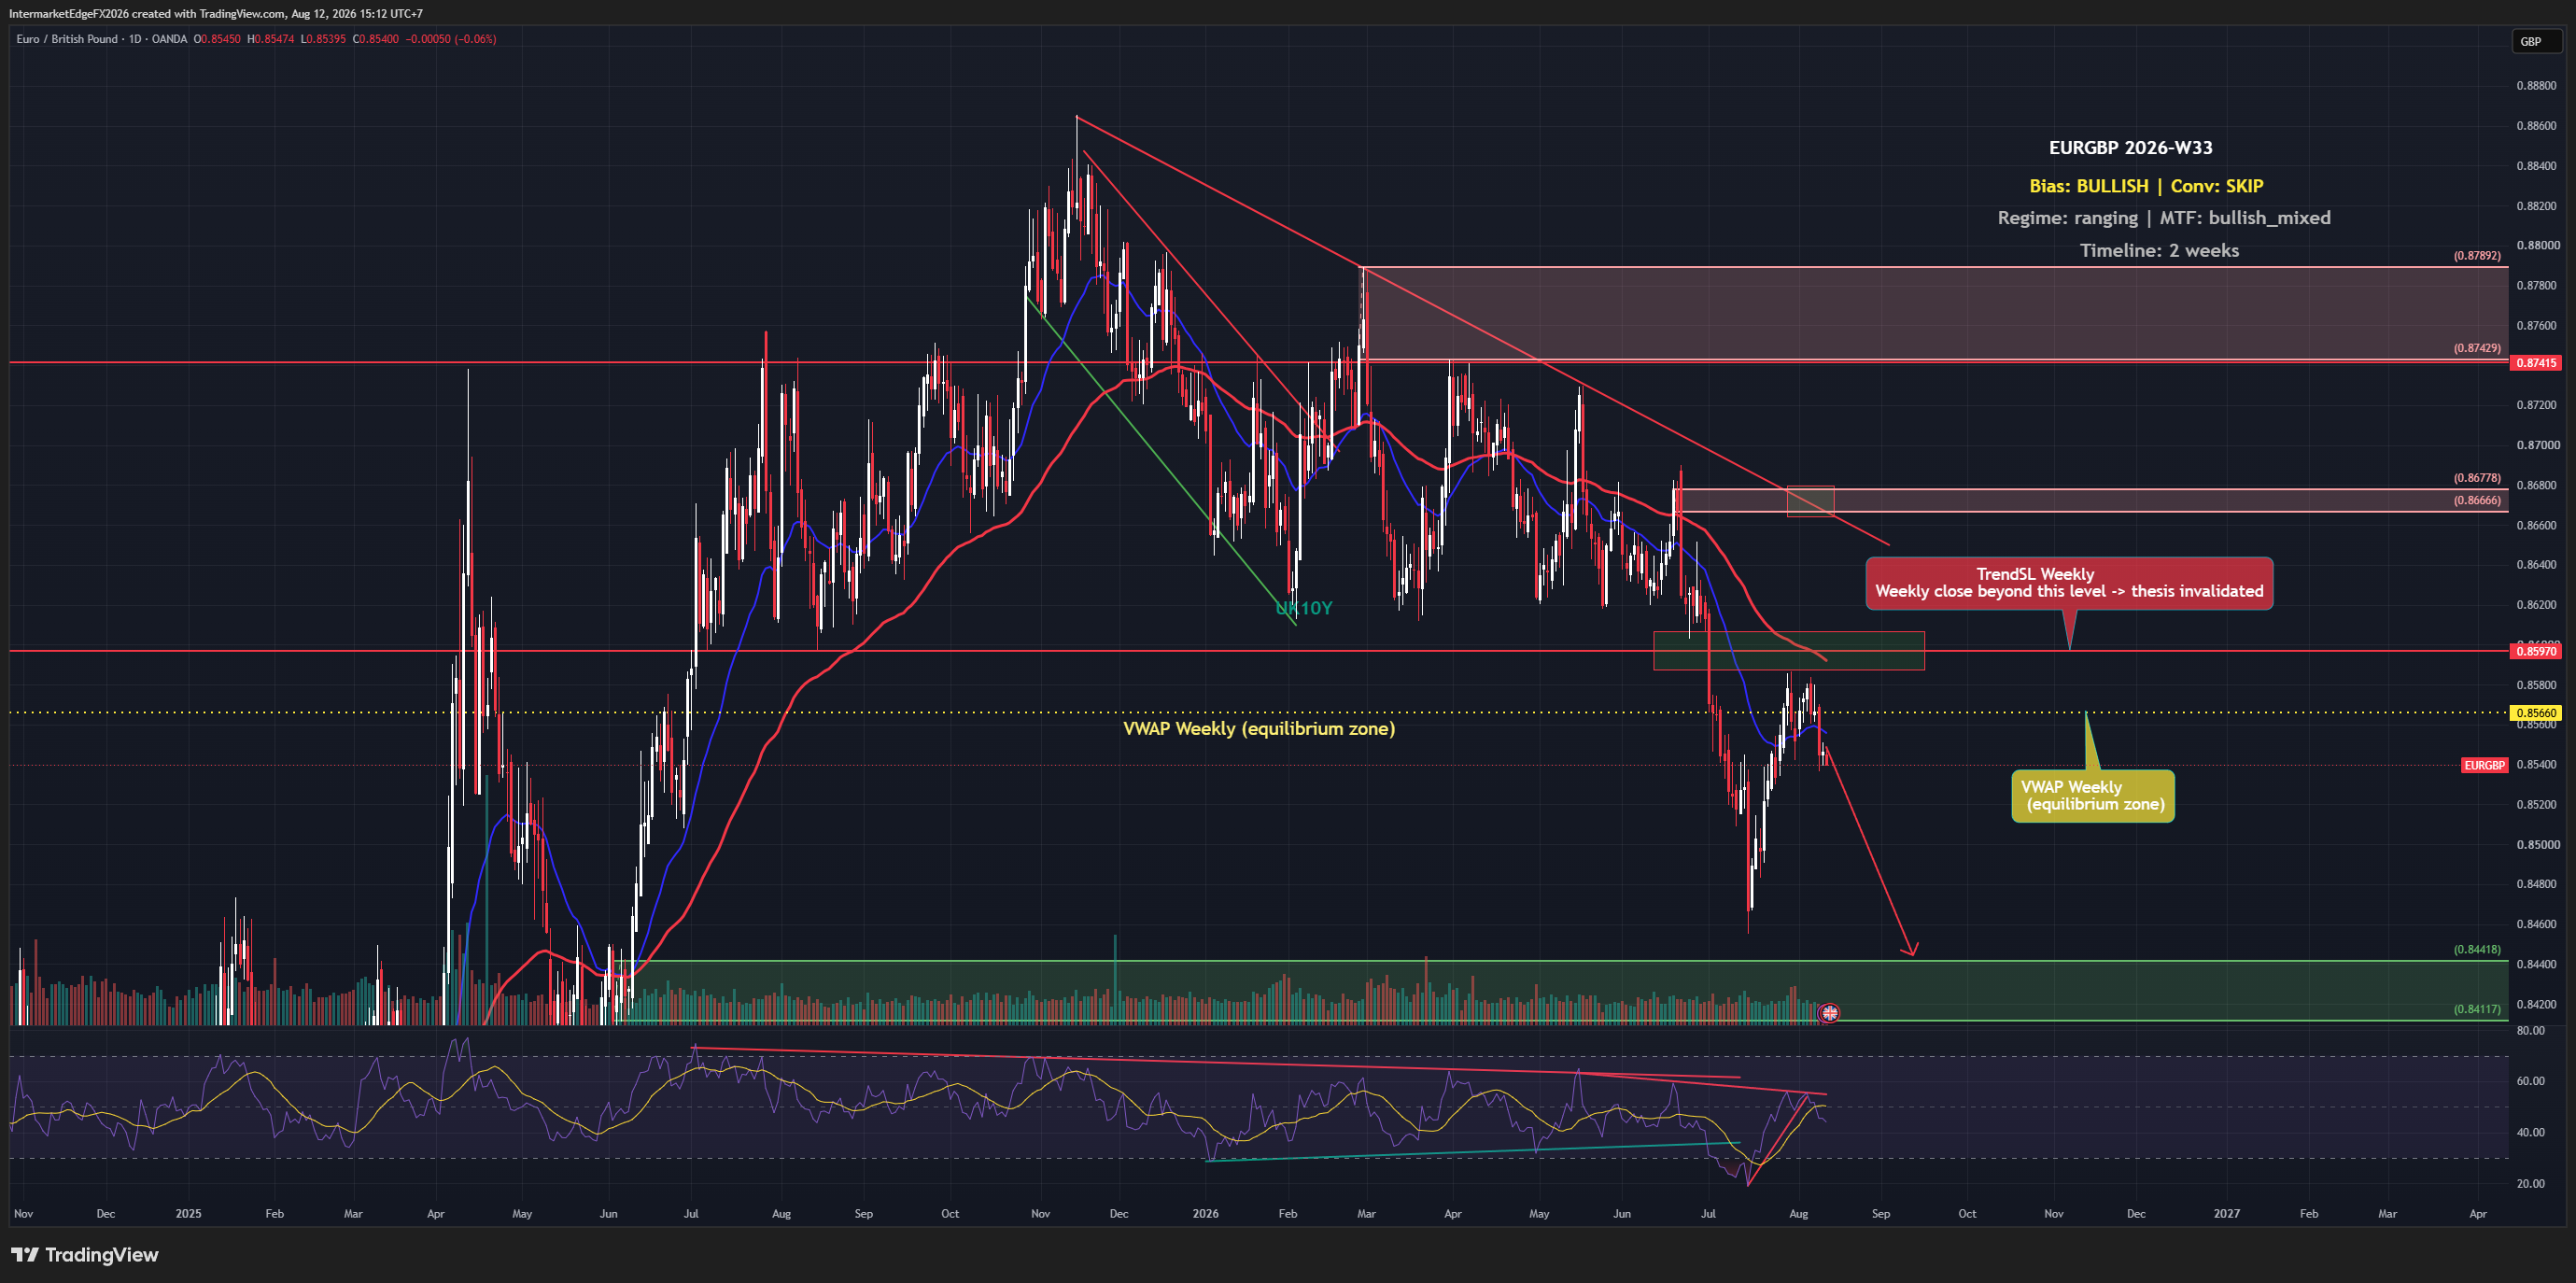
EURGBP Week W33-2026: BOE Holds at 3.75% But Sterling Fights Back, Leaving Bulls Stranded Below 0.8566

EURGBP Week W33-2026: BOE Holds at 3.75% But Sterling Fights Back, Leaving Bulls Stranded Below 0.8566

EURGBP is technically labelled bullish this week, yet as of Wednesday 12 August 2026, price at 0.85407 is sitting below the weekly VWAP at 0.8566, testing from underneath rather than pushing through it. That gap between the label and the price reality is exactly the kind of setup where traders get caught leaning on a bias that the market itself hasn't confirmed yet. With a BOE divided 6-3 on holding rates and a Euro-area CPI miss already in the books, neither side has a clean fundamental edge right now. The framework arrives at a weak bullish lean on EURGBP for this two-week window, but it is important to understand precisely how thin that lean is. The only active signal driving the bullish label comes from price action itself; positioning data, macro rules, liquidity signals, and sentiment indicators all contribute nothing, they fired no confirming evidence. A bias resting on a single source with no corroboration from other analytical layers is, by design, a low-confidence read that demands a correspondingly cautious posture. The analysis explicitly flags a structural conflict at the heart of the thesis: the overall directional label is bullish, but the structural bias is neutral, meaning the two core components of the framework are not pointing the same way. That internal contradiction is not a rounding error, it is a direct signal that the environment has not yet organised itself into a tradeable directional setup. The ECB-versus-BOE rate differential is cited as the primary fundamental narrative, the idea being that if ECB policy holds firmer relative to BOE policy, euro support should outpace sterling support over time. But no macro rule within the analysis has fired to validate that narrative in a quantifiable way this week, so it remains a story rather than a confirmed driver. What this means practically: the bullish label should be read as a directional lean, not a conviction call. -- Intermarket Edge

XAUUSD Week W33-2026: Gold Crosses the Line, but Confirmation Must Wait

XAUUSD Week W33-2026: Gold Crosses the Line, but Confirmation Must Wait

Gold printed a flat zero on the July Core CPI reading, the kind of number that should send an inflation hedge sharply higher. Instead, XAUUSD is hovering within a handful of dollars of a technical level that the bullish case still needs to close above on a weekly basis. The contradiction between a cooling inflation print and a 2.4% real yield that keeps the Fed's pressure alive is exactly the tension defining this week's tape. The overall lean for gold this week is bullish, but the honest framing is that this is a low-conviction technical bias rather than a macro-supported directional call. Price action and COT positioning, where large speculator positioning is tilted bullish, though the specific report date, net-position figure, and sample period are not disclosed in the underlying data, so treat this as directional evidence rather than a citable statistic, are carrying most of the analytical weight. The macro contribution is marginal, and both liquidity and sentiment indicators are quiet, offering no additional confirmation in either direction. The hawkish Fed causal chain is the key headwind worth understanding precisely: higher real yields reduce gold's relative appeal because bonds now compete meaningfully for capital, creating persistent downward pressure on prices. That chain has been deliberately downweighted in the framework after backtesting showed it produced correct directional calls only roughly 35.9% of the time when applied to XAUUSD specifically, a figure that comes without disclosed sample size or test period, so treat it as a caution flag rather than a hard statistical rule. The practical takeaway is that price and positioning should lead the analysis, not macro narratives alone. What makes this week's setup particularly difficult is that the CPI miss does not resolve the conflict, it creates a new one. -- Intermarket Edge

EURJPY Week W32-2026: US Yen-Buying Intervention Drives Price Below 184.58 VWAP as BOJ Holds at 1% and Flags Further Hike

EURJPY Week W32-2026: US Yen-Buying Intervention Drives Price Below 184.58 VWAP as BOJ Holds at 1% and Flags Further Hike

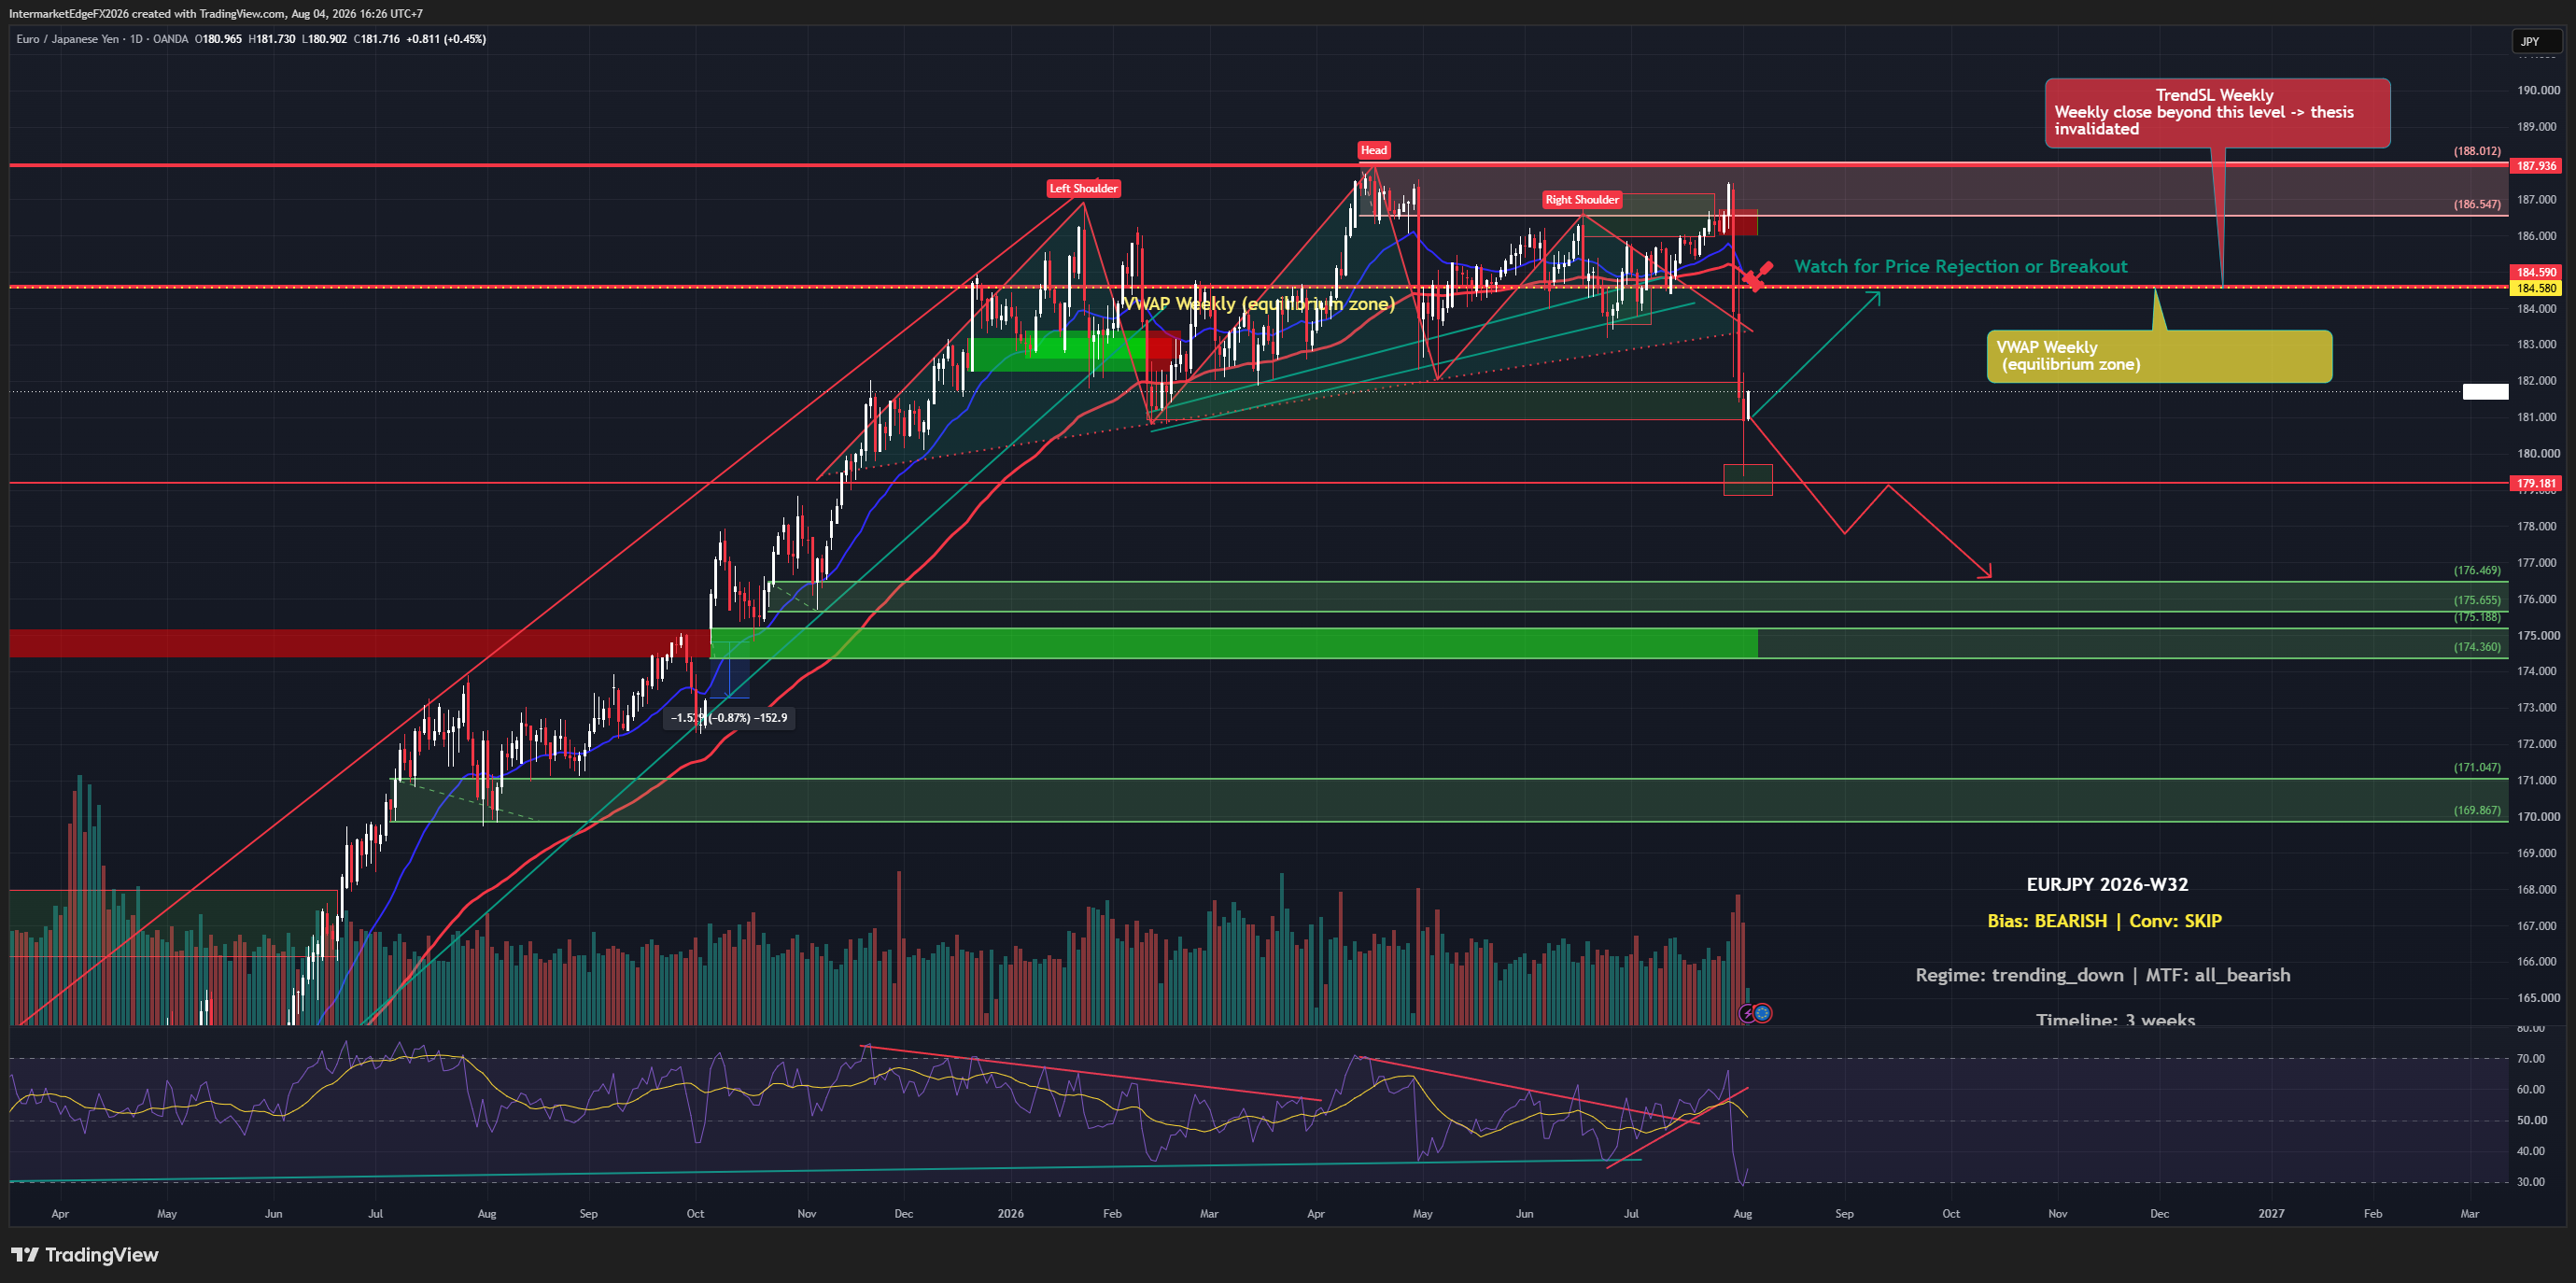
EURJPY is trading at 181.67 as of Tuesday, 04 August 2026, 09:09 UTC, nearly 3 full points below the weekly VWAP of 184.58, after the US shook currency markets by buying yen directly through euro sales. The BOJ held its overnight rate at 1% but reiterated its hiking path, keeping carry-unwind pressure alive. The multi-timeframe picture is all-bearish, yet conflicting signals between price action and macro mean conviction sits at skip level: the trend is real, but the evidence base is thin. The overall bias for EURJPY in Week W32-2026 is bearish, but the conviction level is explicitly rated skip, meaning the signal exists, but the evidence base is too thin and too conflicted to support a high-confidence directional trade. Let that framing govern everything that follows. The primary bearish driver is structural: BOJ hawkishness, reinforced by this week's hold-with-hike-guidance, pressures the rate differential that underpins euro-yen carry positioning. When the BOJ signals continued tightening while the ECB faces disinflationary data, the carry unwind dynamic, where traders exit long-EURJPY positions funded by cheap yen borrowing, becomes a credible medium-term force. The US intervention reported this week, specifically buying yen through euro sales rather than through the conventional dollar channel, is an unusually direct policy statement that adds event-driven downside pressure on top of the structural story. The regime is classified as trending down with moderate confidence, and the multi-timeframe alignment reads all-bearish, which in isolation would support a trend-follow posture. However, the thesis-level signal contains a direct conflict: price action scores bullish while the macro overlay scores bearish, producing a weak net bearish read with very low conviction overall. -- Intermarket Edge

EURUSD Week W31-2026: Euro Climbs to Two-Week High as Fed Holds Rates Steady, Dollar Sinks and Bearish Thesis Faces Short-Term Counter-Trend Pressure

EURUSD Week W31-2026: Euro Climbs to Two-Week High as Fed Holds Rates Steady, Dollar Sinks and Bearish Thesis Faces Short-Term Counter-Trend Pressure

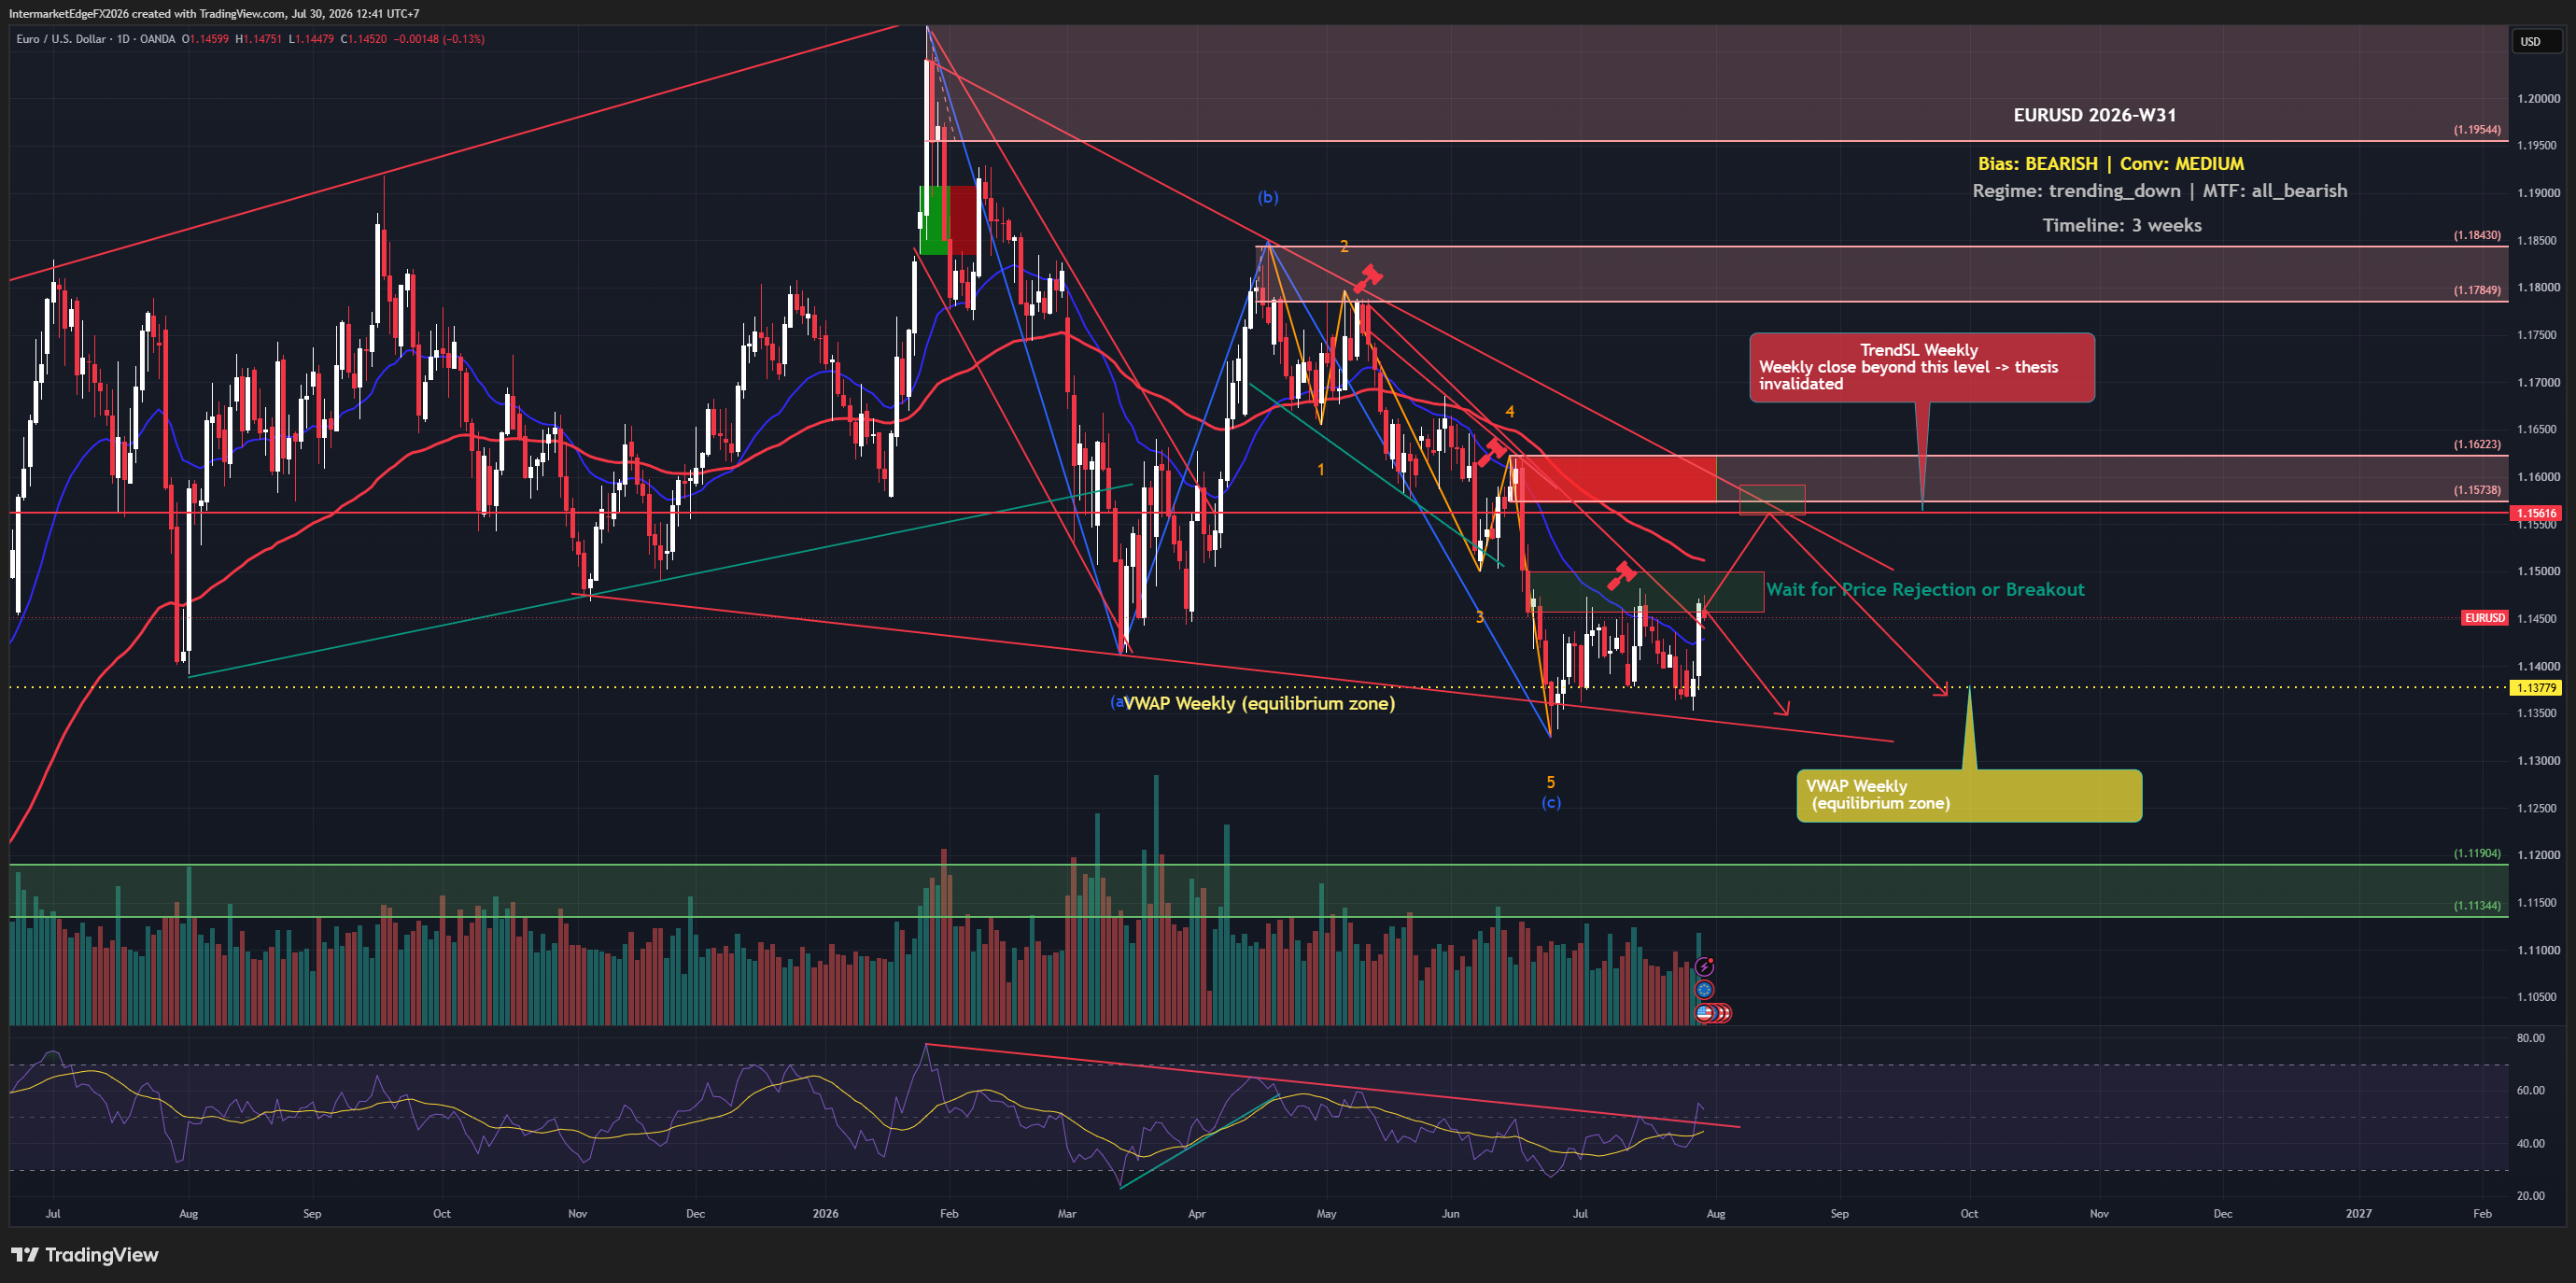
The Euro hit a two-week high this week as the Fed held rates steady and the dollar sank in the immediate aftermath, but don't mistake a short-term relief rally for a trend reversal. With US 10-year real yields running at 2.43% and the ECB-Fed rate differential still firmly favoring the dollar, the structural bearish case for EURUSD remains intact. The current bounce is trading against the macro grain, and that matters. The overall bias for EURUSD in W31-2026 is bearish with medium conviction, driven primarily by the ECB versus Fed rate differential that continues to favor USD strength across the medium-term horizon of roughly three weeks. The multi-timeframe technical alignment is fully bearish, every timeframe in the review is pointing in the same direction, which adds structural weight to the macro thesis even if short-term price action is temporarily running the other way. It is important to be explicit about the signal conflict present this week: both recent price action and COT positioning data are reading bullish, and the Euro is indeed trading above the weekly VWAP of 1.13779 as of Thursday, 30 July 2026 at 05:32 UTC. That is not a minor footnote, price at 1.14574 is already running against the thesis snapshot close, and that gap of roughly 80 pips is real counter-trend pressure that deserves respect. The COT signal showing net bullish positioning should also be noted, though the brief does not specify the exact report week, release date, or net contract figure, so it should be read as directional evidence rather than a precise citable statistic. The bearish thesis this week rests entirely on macro and causal-chain logic: Fed hawkishness feeds USD bullish pressure, which feeds EURUSD bearish pressure, with DXY directional weight being the strongest single input into the pair. -- Intermarket Edge

USDCAD Week W30-2026: Tariff Threats and Yield Spread Widening Push Pair to a One-Week Low, But VWAP at 1.40594 Keeps Bulls Cautiously Alive

USDCAD Week W30-2026: Tariff Threats and Yield Spread Widening Push Pair to a One-Week Low, But VWAP at 1.40594 Keeps Bulls Cautiously Alive

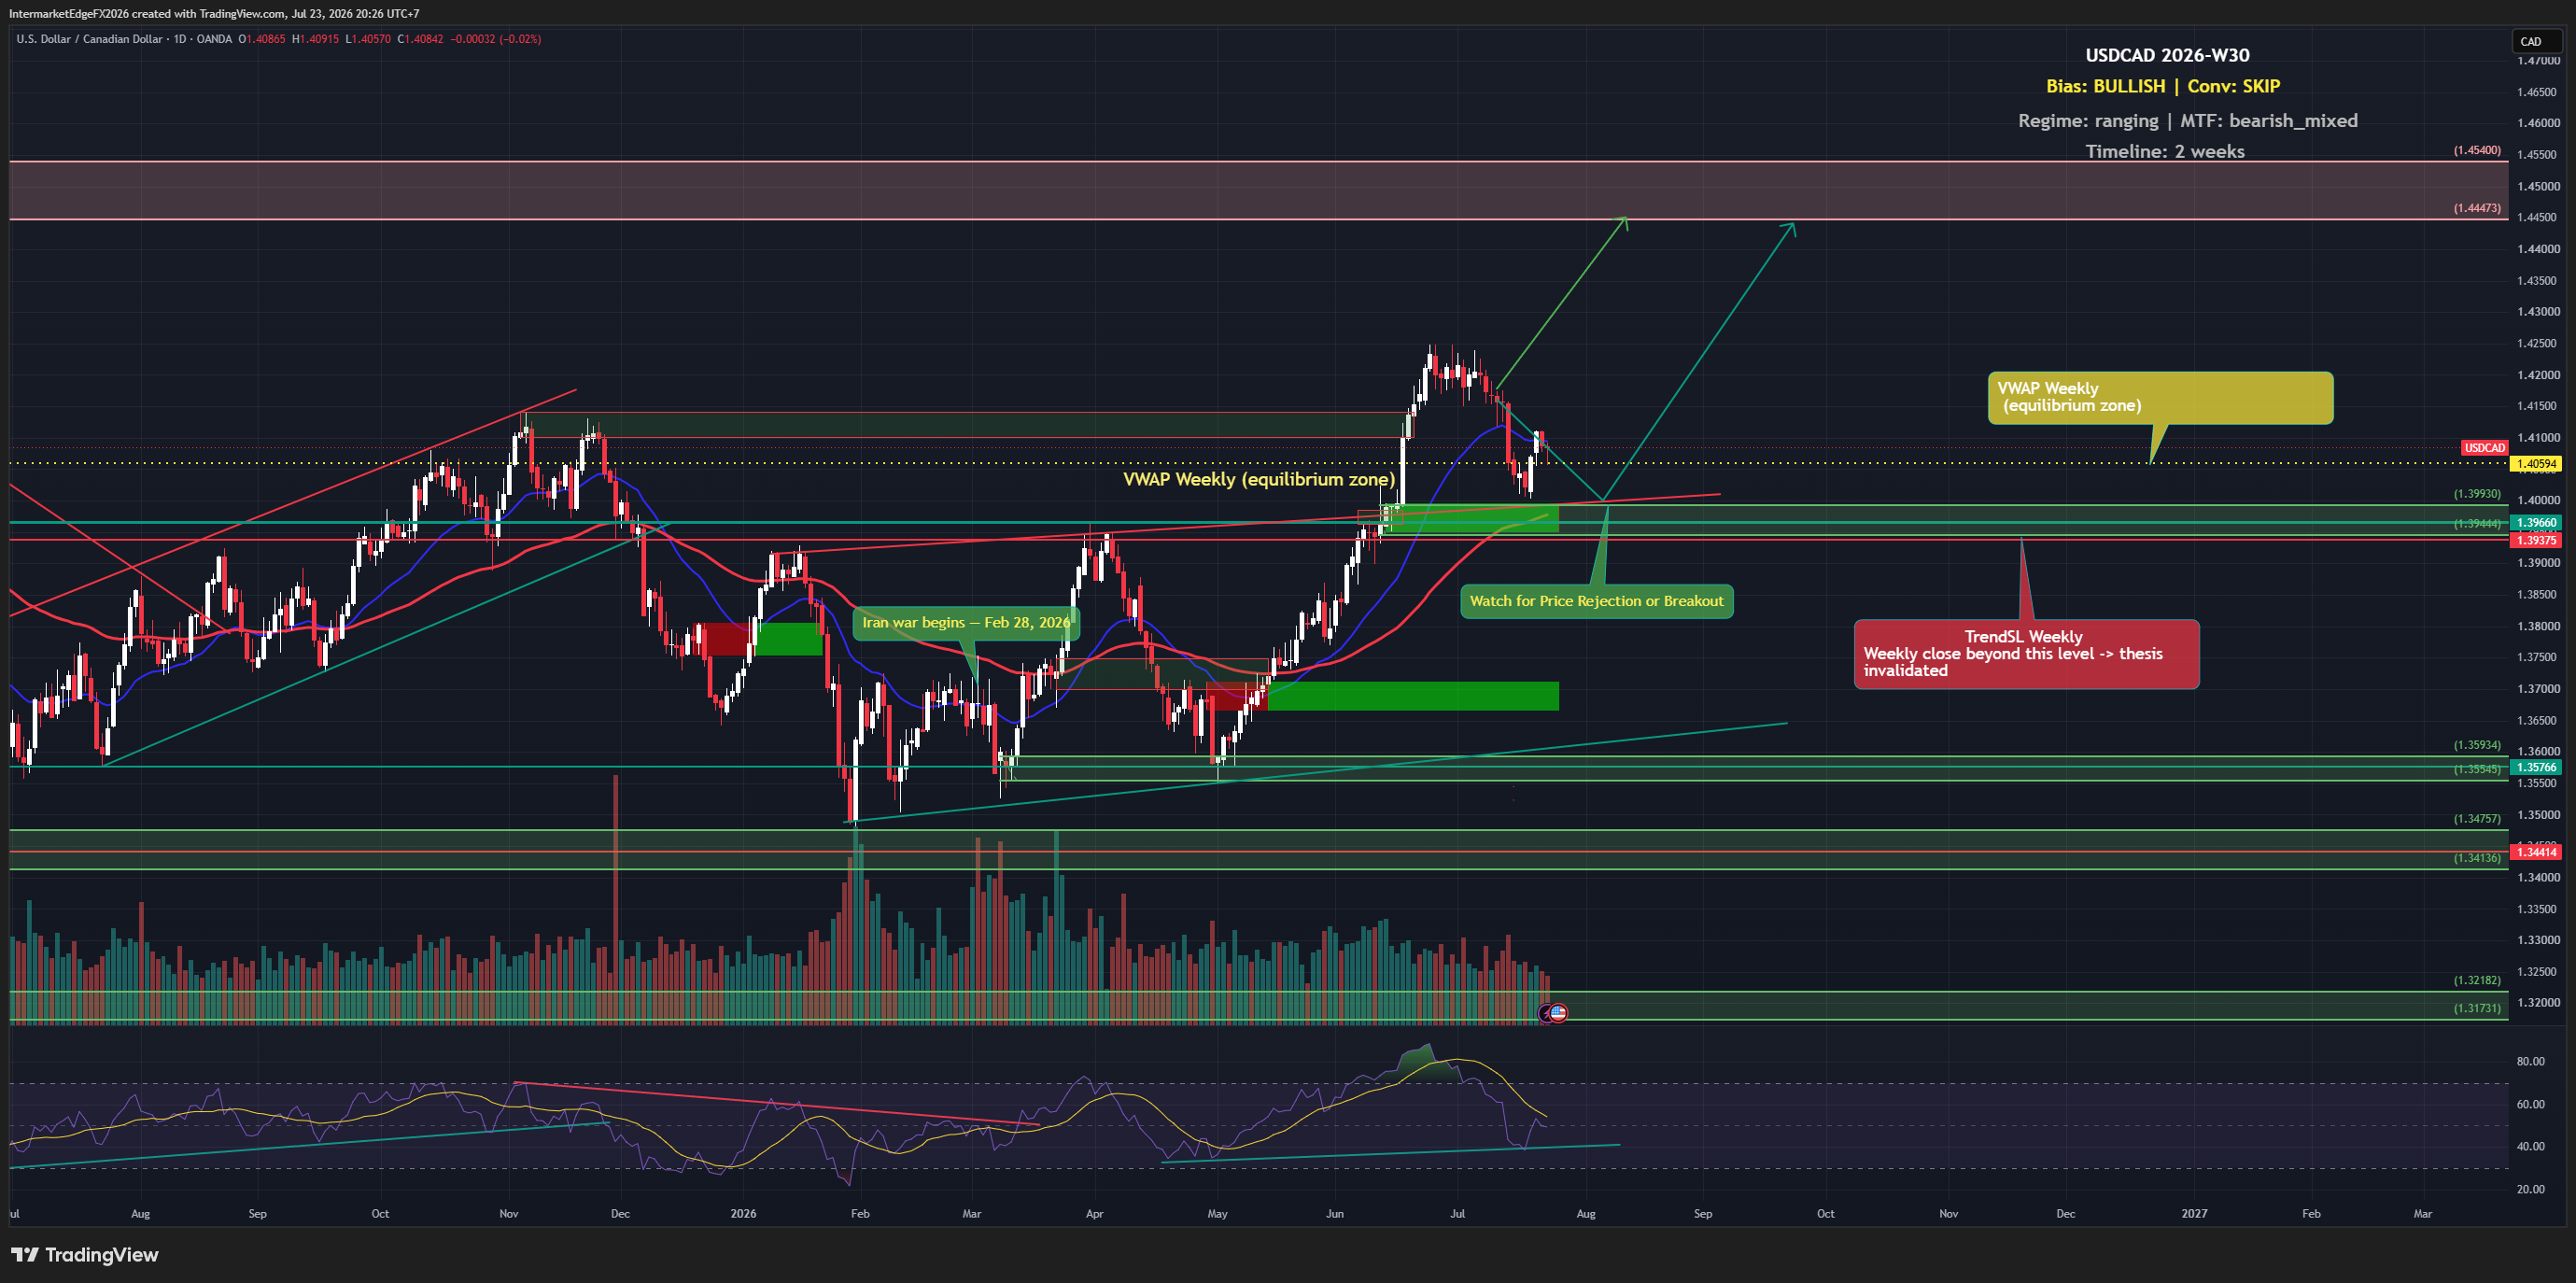
USDCAD is trading at 1.4083 (as of 2026-07-23T13:15 UTC, yfinance near-realtime), marginally above the weekly VWAP of 1.4059 and well above the trend support at 1.3937. The regime is ranging with a mean-reversion implication — not a trending environment. The news backdrop is mixed. The Canadian dollar briefly strengthened on rising benchmark yields, but then hit a one-week low as yield spreads widened following renewed U.S. tariff threats. Ottawa's response was sharp — PM Carney called the latest tariff move a USMCA violation, while USTR Greer countered that Canada is offering better deals to third parties. Separately, USD is finding a bid from U.S.-Iran tensions pushing Brent higher — which cuts both ways for USDCAD since oil strength typically supports CAD. The bullish bias rests on two pillars: COT positioning (net bullish) and macro fundamentals — the Fed remains hawkish, real yields are elevated at 2.37%, and the rate differential favors USD. However, conviction is low; price, liquidity, and sentiment signals are all neutral. A TGA drain is flagged as a partial offset, simultaneously supporting risk assets and capping USD upside. Critical override risk: a sustained oil rally would strengthen CAD and could neutralize the entire setup regardless of rate differentials. Structural levels to watch: a weekly close below VWAP (1.4059) warrants size reduction; a close below TrendSL (1.3937) invalidates the bullish structure entirely. Given low conviction, keep sizing conservative and wait for price confirmation before adding directional exposure. -- Intermarket Edge

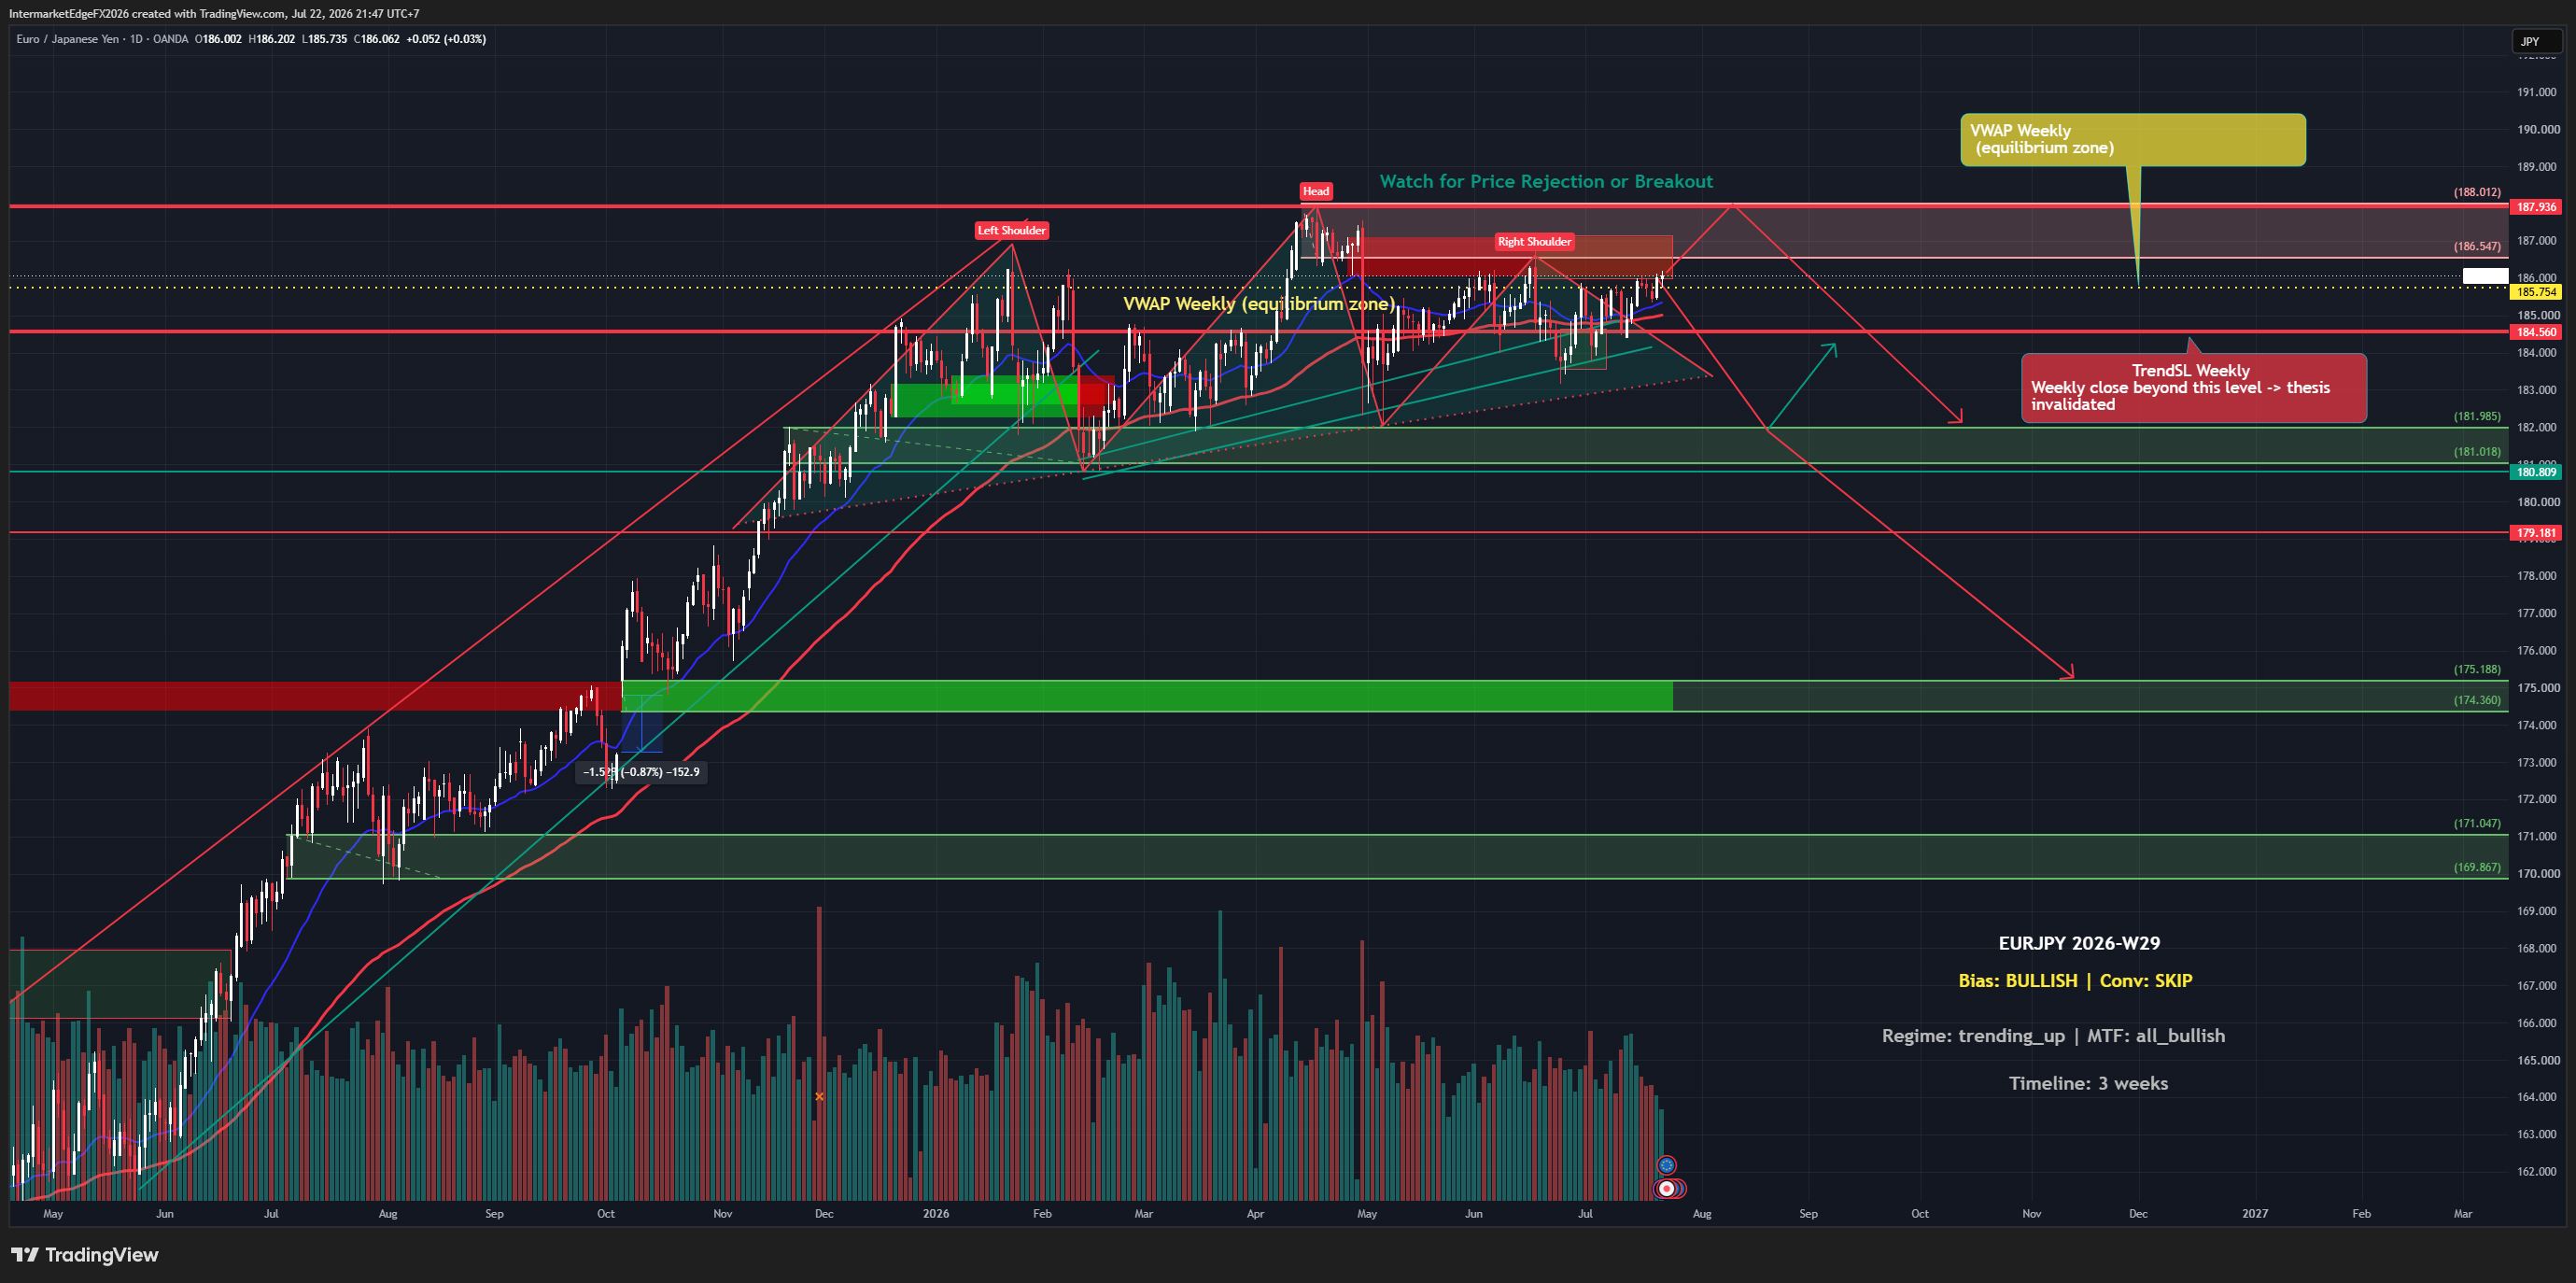
EURJPY Week W29-2026: Yen Slides Past 163 as Intervention Talks Mount, Bullish Trend Holds Above 184.56 But Carry-Unwind Risk Keeps Conviction Muted

EURJPY Week W29-2026: Yen Slides Past 163 as Intervention Talks Mount, Bullish Trend Holds Above 184.56 But Carry-Unwind Risk Keeps Conviction Muted

EURJPY sits at 185.75, hugging weekly VWAP exactly, with multi-timeframe alignment fully bullish and the trending regime intact. The technical picture hasn't broken — TrendSL at 184.56 remains unchallenged. That's the straightforward part. The macro backdrop is far messier. The yen has slid past 163, triggering intervention alerts and raising the prospect of a sudden BOJ/MOF response. Intervention risk is not theoretical at these levels — it's the single biggest tail risk to any long EURJPY position. Meanwhile, Japan's economy faces inflationary pressure partly driven by the weak yen making imports expensive, which ironically supports BOJ rate-hike bets. A surprise hike or credible intervention threat can produce a violent carry unwind (rapid JPY short-covering) with little warning. Adding complexity: US-Iran conflict has intensified, lifting Brent and supporting the dollar near-term. DXY bias is bearish but conviction is low, so EUR-side support is tepid at best. Euro CPI came in at 2.4% vs 2.6% forecast — a miss that modestly softens ECB hawkishness and limits EUR upside. Bottom line: bias is bullish, regime is trending up, but conviction is skip-level this week. The conflict between clean technicals and elevated geopolitical/intervention risk is real. If price closes below 184.56, the bullish structure is invalidated. Below 185.75 VWAP on a sustained basis, reduce exposure. Do not size aggressively into a crowded yen-short trade when intervention chatter is this loud. -- Intermarket Edge

Stay in the loop

Get notified about new research, macro insights, and market analysis.

InterMarketEdge

© 2026 InterMarketEdge. Financial intelligence for inter-market traders.