Articles — InterMarketEdge

Articles

Financial intelligence, macro research, and inter-market analysis.

EURUSD Week W37-2026: Price Reclaims 1.16274 VWAP as ECB and US CPI Collide, Bearish Case Loses Its Technical Footing

EURUSD Week W37-2026: Price Reclaims 1.16274 VWAP as ECB and US CPI Collide, Bearish Case Loses Its Technical Footing

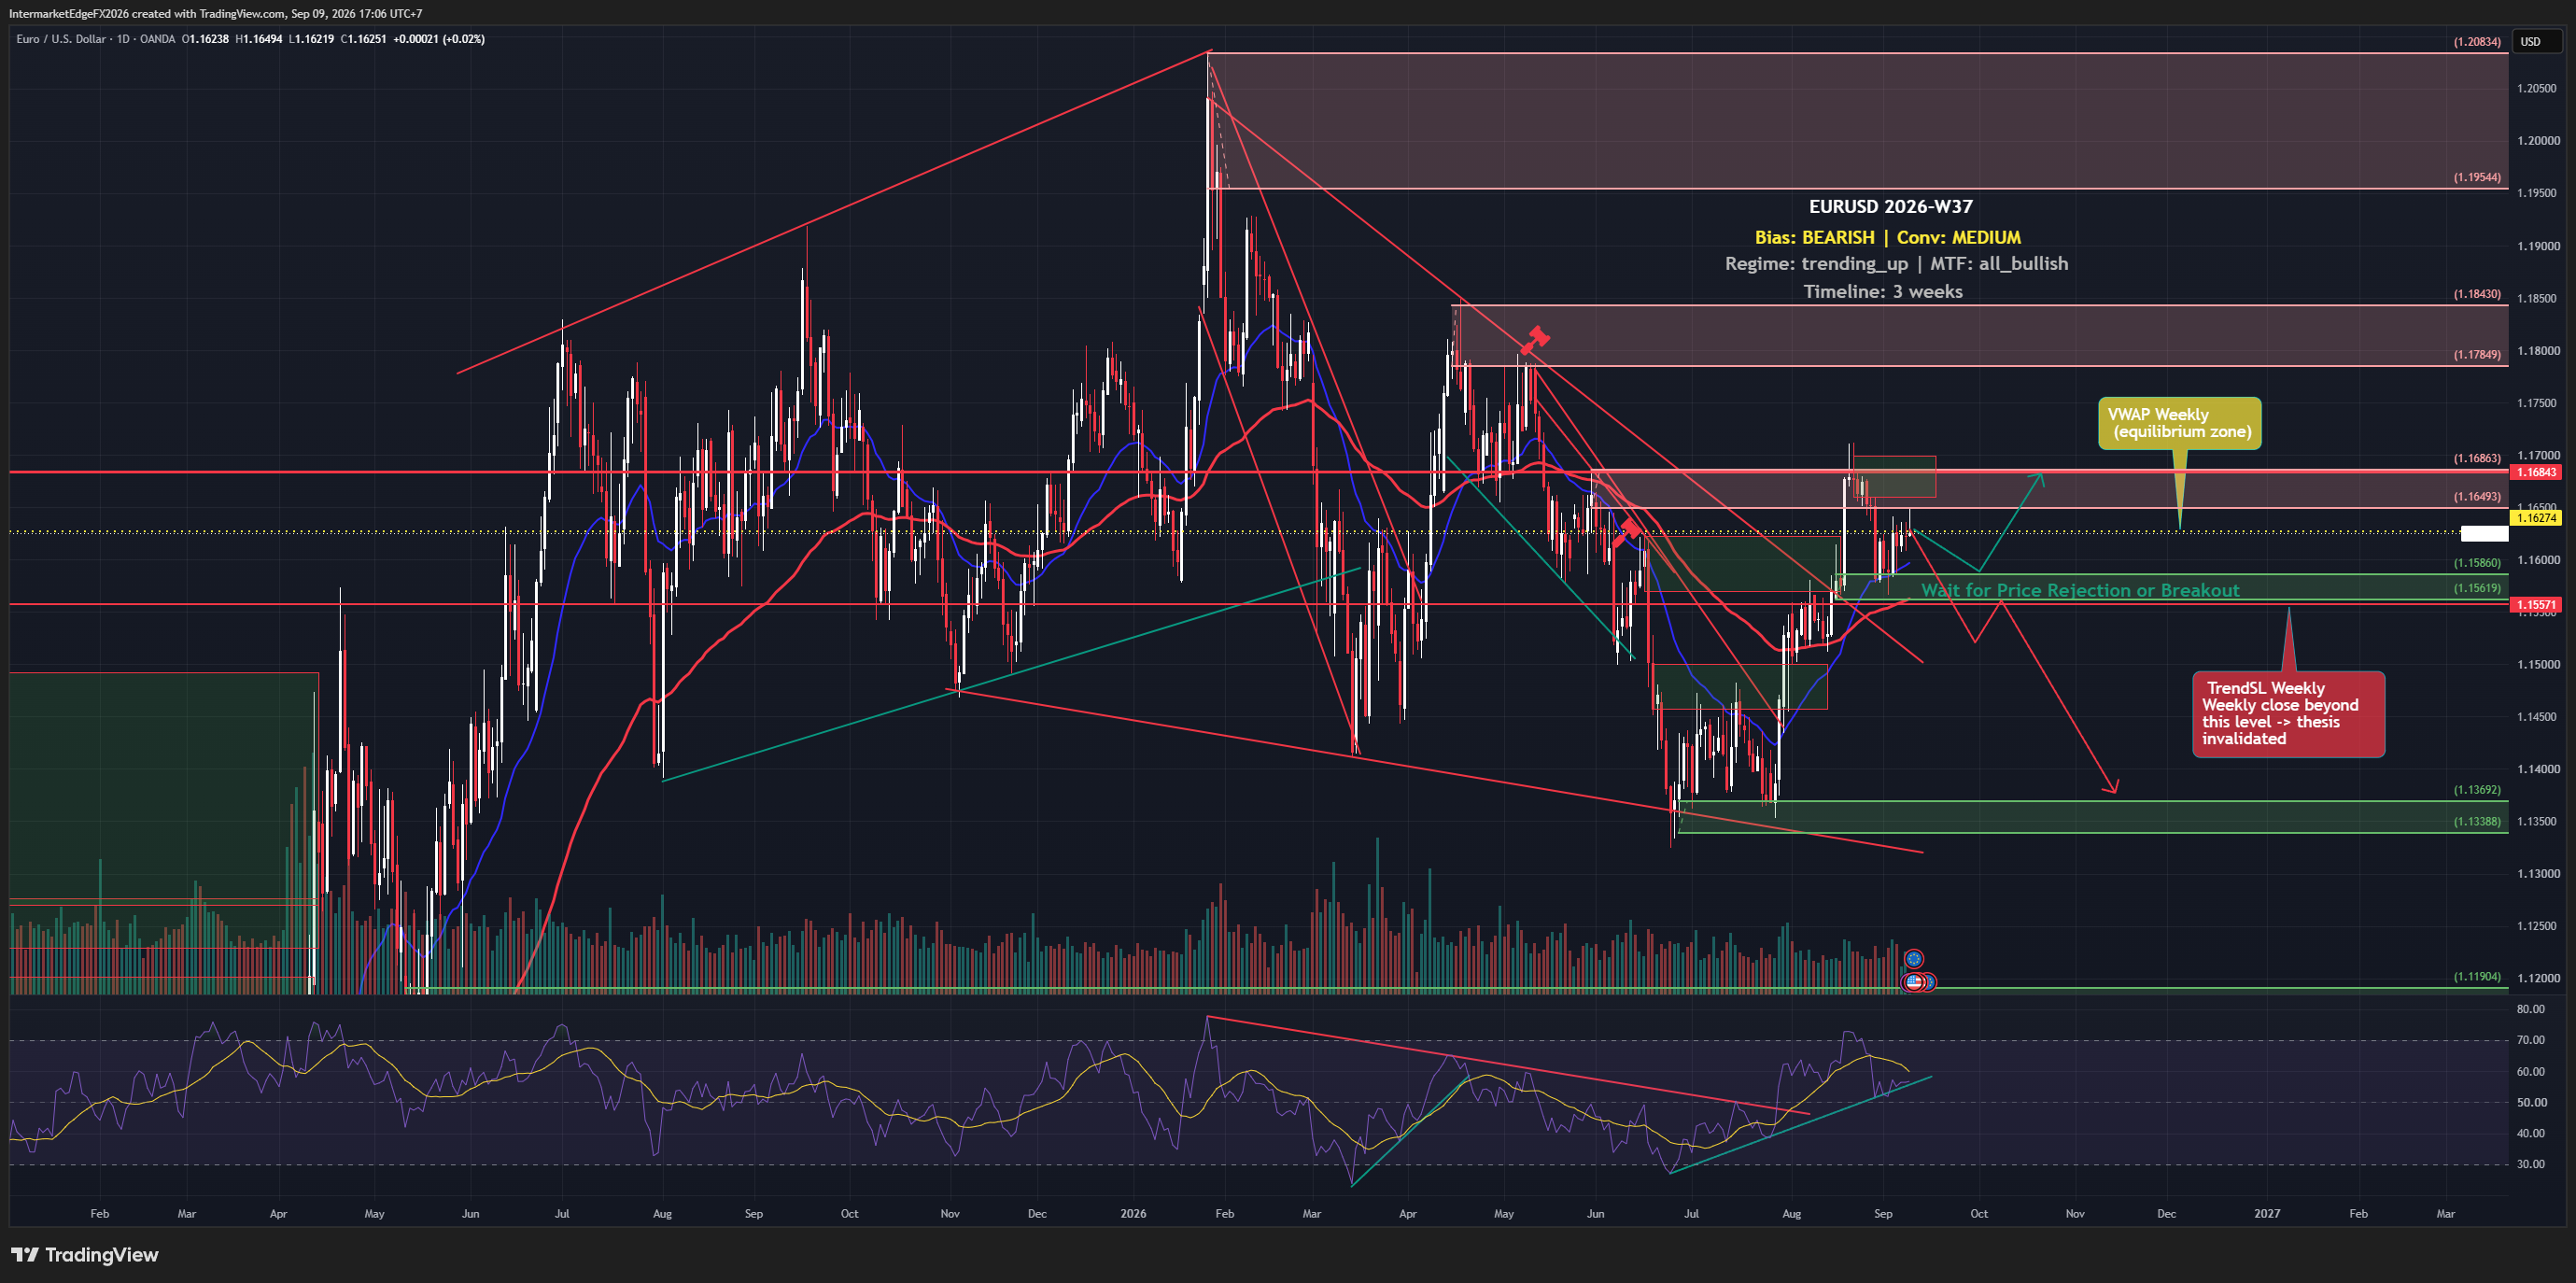
EURUSD is sitting at 1.16393 as of Wednesday, 09 September 2026, above its weekly VWAP at 1.16274 and well above the weekly trend support at 1.15571. The structural bias is bearish, driven by the Fed-ECB rate differential. But every technical and positioning signal points the other direction. When the chart, the COT data, and the price all contradict the macro label, the trade is rarely as clean as the thesis sounds. The bearish bias on EURUSD rests on one primary structural argument: the ECB versus Fed rate differential favors the dollar. When the Fed holds rates higher for longer while the ECB faces pressure to ease amid slowing European growth, the interest-rate gap widens, and wider differentials mechanically increase the cost of holding euro versus dollar, which tends to attract selling pressure on EURUSD. That logic is sound in principle. The problem is that virtually no other input this week agrees with it. The technical picture across daily, weekly, and monthly timeframes is uniformly bullish, the highest level of technical alignment available in this framework, meaning trend-following signals are pointing up, not down. COT positioning (which reflects the directional bets of large non-commercial traders in futures markets; note that this brief does not specify the report week, net-position figure, or release date, so treat it as directional evidence rather than a standalone data point) registers a bullish lean. Price itself, on a multi-timeframe basis, confirms the upward momentum. The result is an unusual configuration where the macro thesis and the market's actual behavior are pointing in opposite directions. Liquidity and sentiment indicators contributed no signal this week, which means the bearish case stands on the rate differential argument alone, without the support of positioning or price behavior to corroborate it. -- Intermarket Edge
USDJPY Week W37-2026: Yen Hits Seven-Month High as Price Slides Below 154.67, But the Bullish Thesis Hasn't Been Abandoned Yet

USDJPY Week W37-2026: Yen Hits Seven-Month High as Price Slides Below 154.67, But the Bullish Thesis Hasn't Been Abandoned Yet

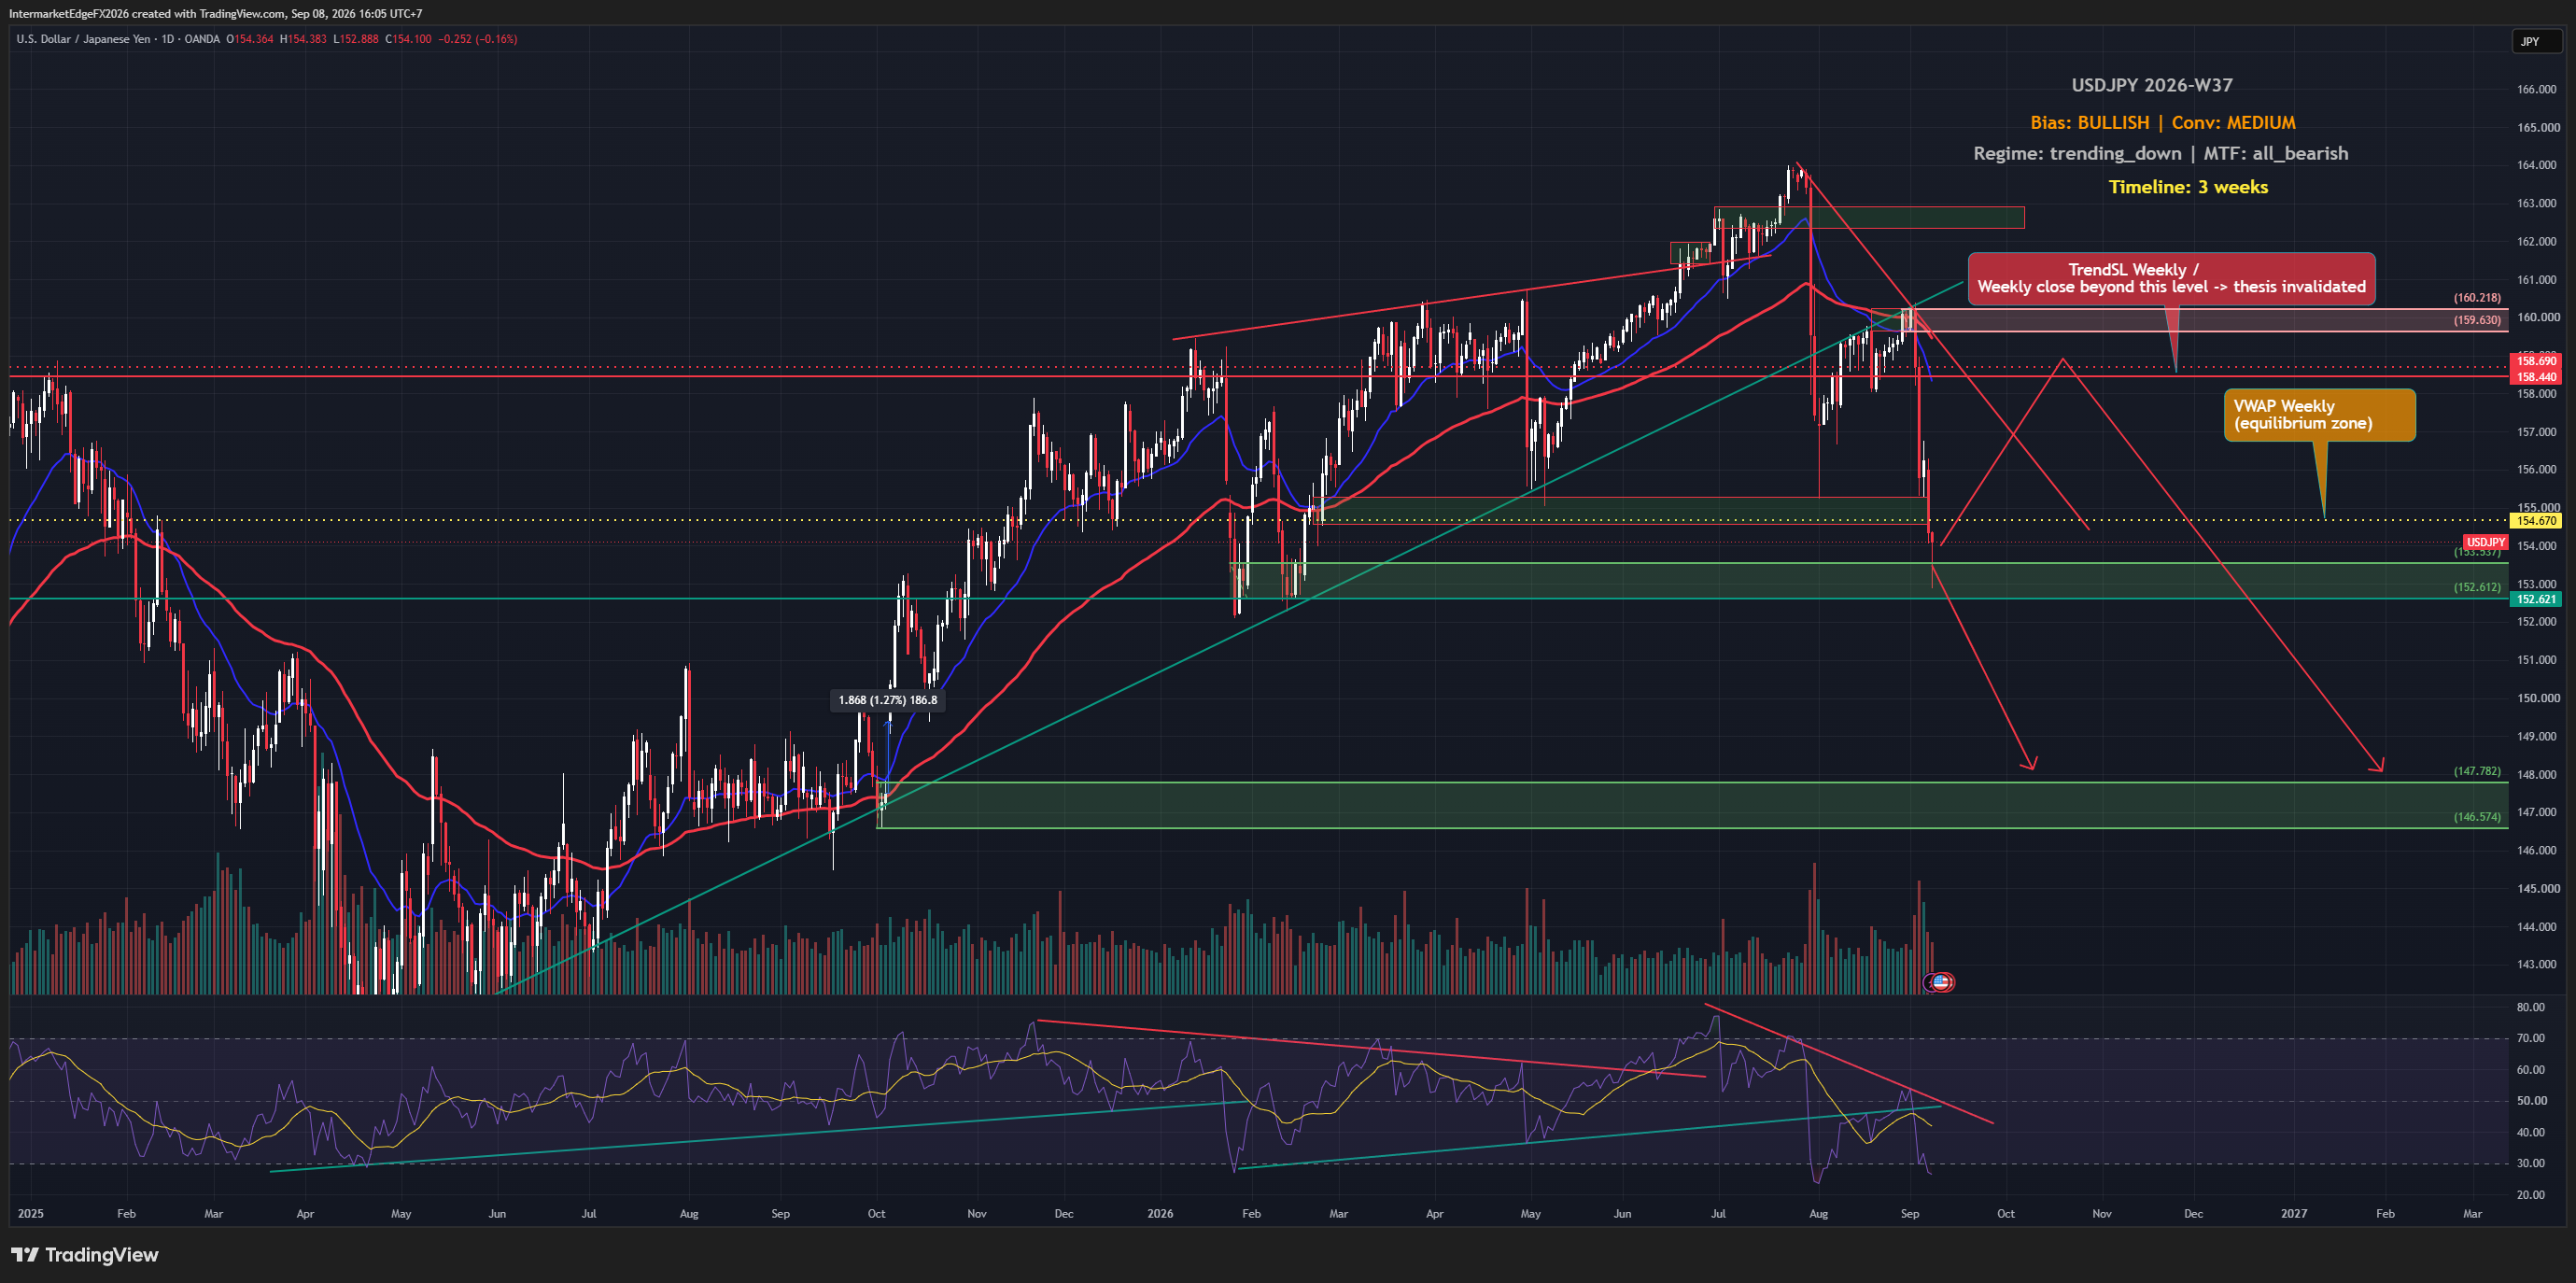
USDJPY is sitting at 153.55 as of Tuesday, 08 September 2026, with the yen at a seven-month high and every timeframe aligned bearish. The bullish thesis rests on the most extreme Fed-vs-BOJ rate differential in the G7, but price is already below the weekly VWAP at 154.67, meaning the pair hasn't even recovered to average territory yet. Before positioning around a macro argument, the technical structure deserves a hard look. The framework carries a bullish bias on USDJPY this week, but the conviction sits at medium, not high, and understanding why that ceiling exists matters more than the label itself. The core argument is straightforward: the Fed-vs-BOJ rate differential is the most divergent in the G7. A rate differential measures the gap between what investors earn holding one currency versus another; when it is wide and widening, it creates a structural incentive to hold the higher-yielding currency, in this case the dollar. Real yields reinforce this, a 2.42% US 10-year real yield means dollar holders are being compensated above inflation, which is a durable form of carry, not just a nominal illusion. Price action, COT positioning, and macro fundamentals all point the same direction. However, the COT data introduces a specific caution: speculative positioning is already extremely short yen, meaning most of the bearish-yen trade is already on. Crowding risk, the danger that a crowded trade reverses sharply when participants exit simultaneously, actively reduces conviction here. The exact net-position figures and report date for the COT data are not specified in this brief, so the reading should be treated as directional evidence rather than a precisely dated data point. -- Intermarket Edge

GBPUSD W37-2026: Bullish Technical Structure Conflicts With the Bearish Macro View

GBPUSD W37-2026: Bullish Technical Structure Conflicts With the Bearish Macro View

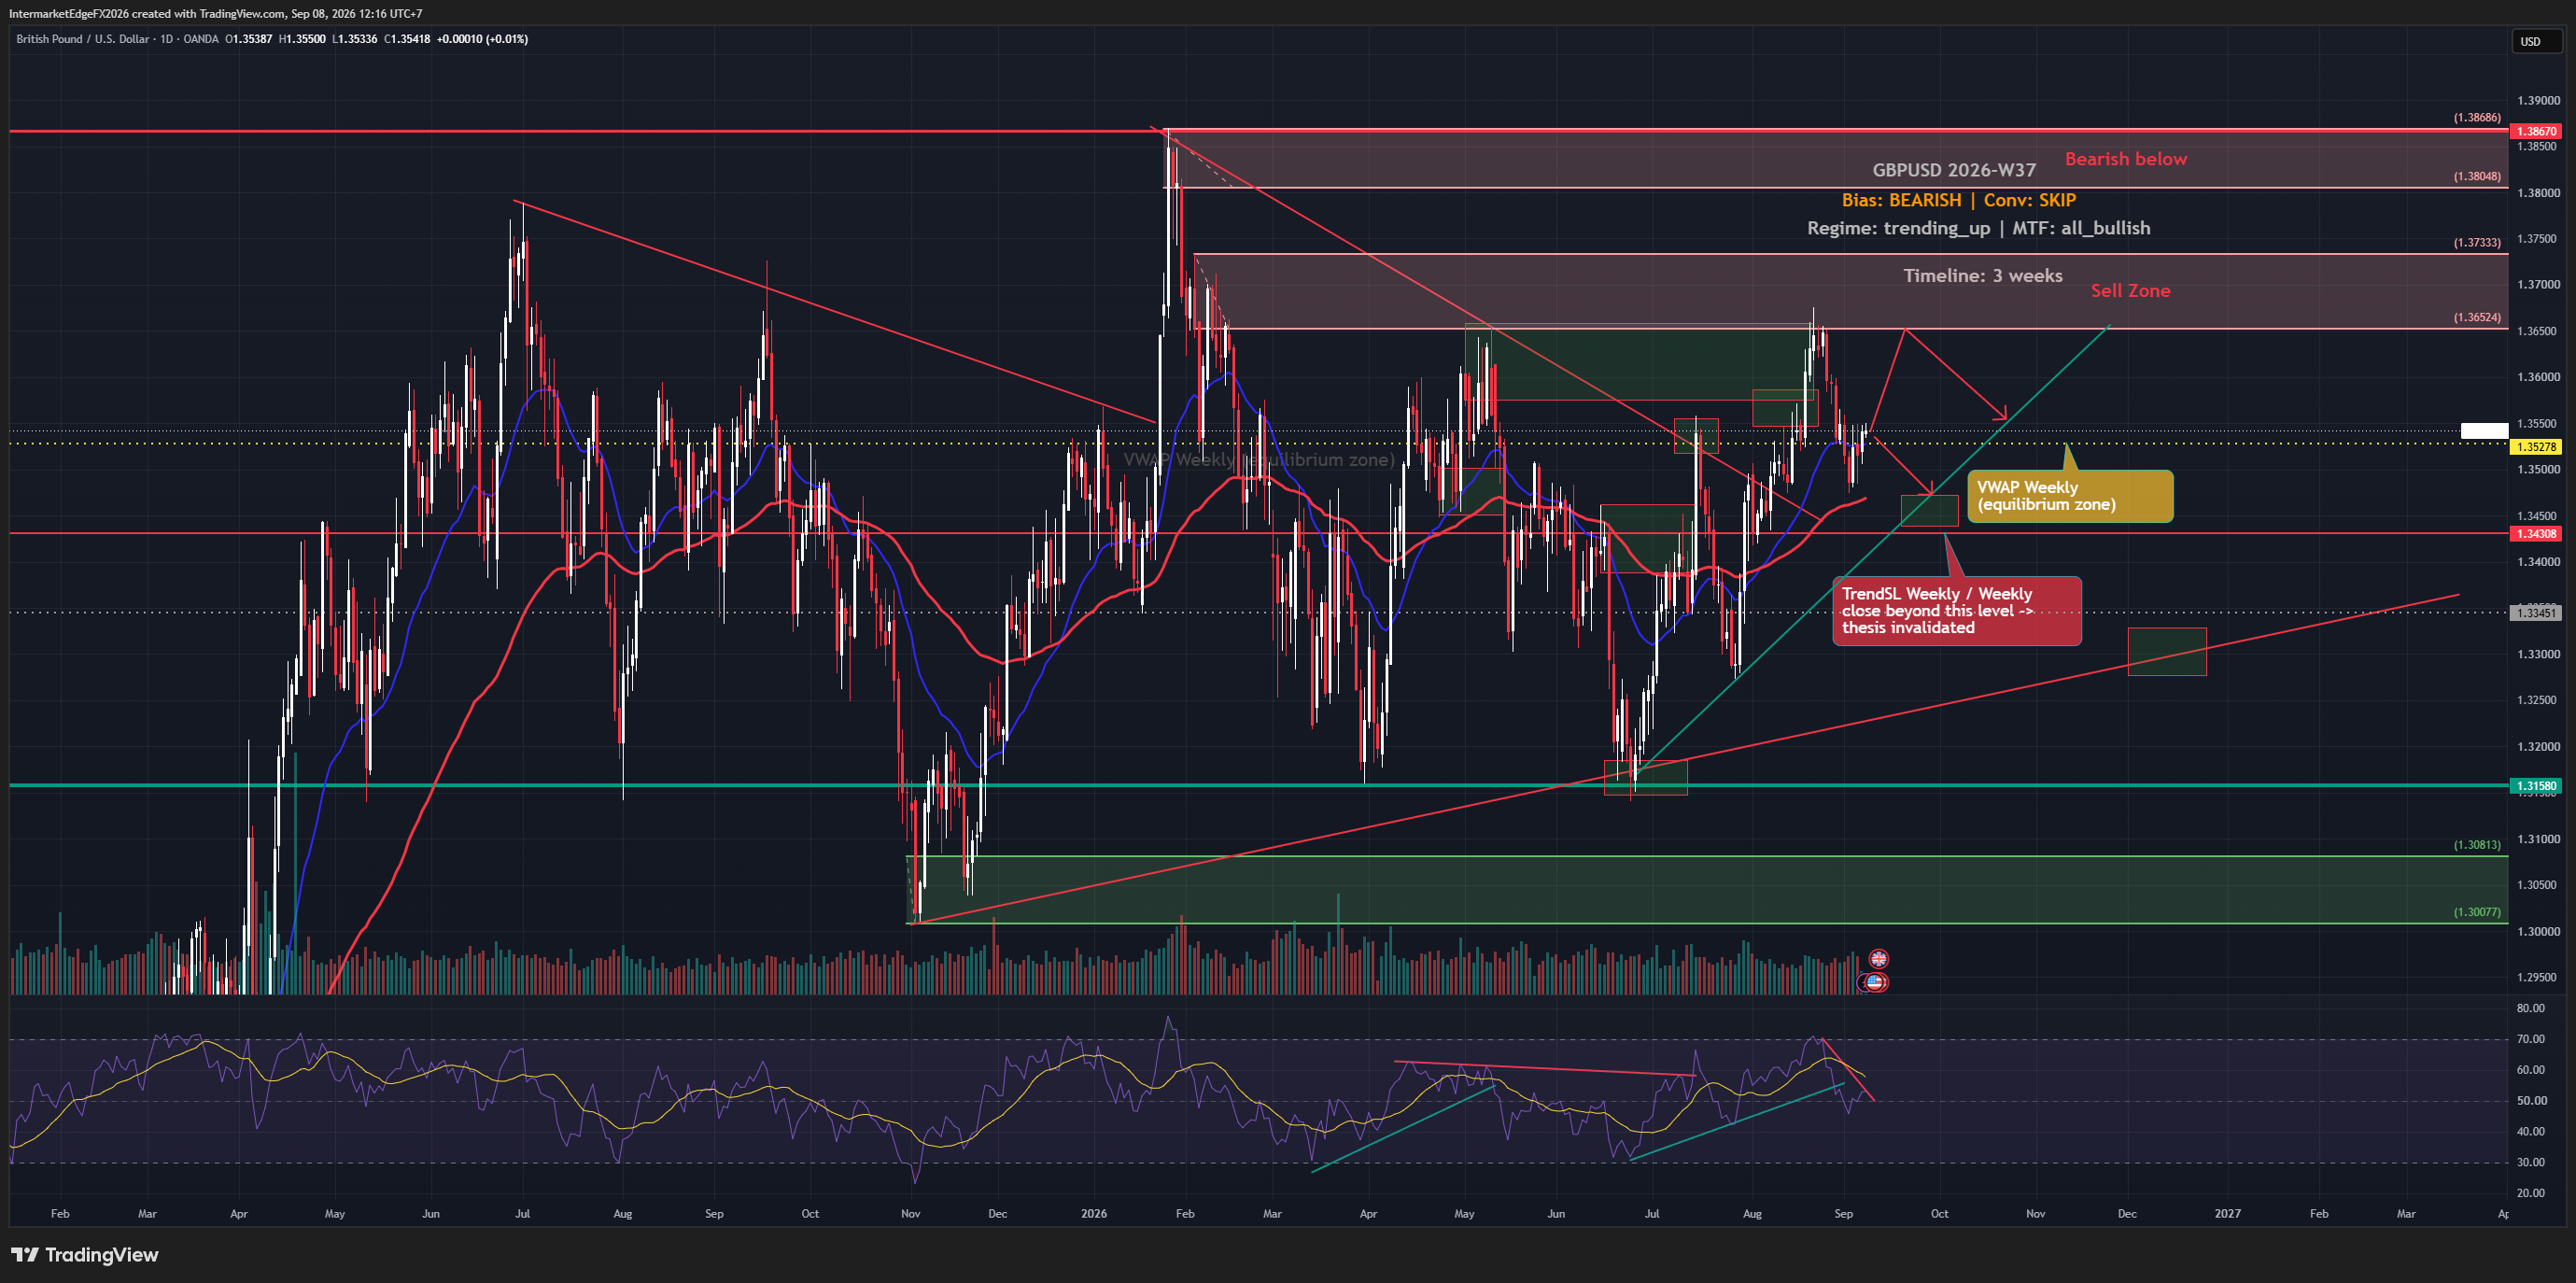
GBPUSD is technically bullish but carries a low-confidence bearish macro bias for W37-2026. The practical decision is to stand aside over a three-week analysis horizon. The locked price was 1.35479 at 05:03 UTC on Tuesday, September 8, 2026, from mt5:GBPUSD.sml:1m. Price was above weekly VWAP 1.35278 by about 20 pips and above weekly TrendSL 1.34308 by about 117 pips. The bullish structure is already active; the bearish label is not technically confirmed. A weekly close below 1.34308 is the defined bearish confirmation condition, not an automatic sell instruction. Strong US payrolls increased expectations of a Fed rate hike, while Reuters reported broad dollar softness ahead of August CPI. The CPI outcome is unknown. The US 10-year real-yield reference is 2.42%, but one level does not prove yields rose or that the US–UK rate differential widened. Huw Pill supported raising Bank Rate to 4% and warned about persistent second-round inflation effects from energy shocks. John Healey pledged fiscal discipline, but sterling received little clear direction from the speech. The COT input is directionally bearish for GBPUSD; its report week, release date and net position are missing, so it cannot establish current crowding or flows. Watch US PPI on September 10, then UK monthly GDP and US CPI on September 11, per ForexFactory calendar data. Outcomes remain unknown. Reassess after the releases and price reaction. Intermarket Edge For informational and educational purposes only. Not financial advice.

XAUUSD Week W37-2026: Jobs Data Crushes Consensus, But Gold Has Not Broken Down Yet

XAUUSD Week W37-2026: Jobs Data Crushes Consensus, But Gold Has Not Broken Down Yet

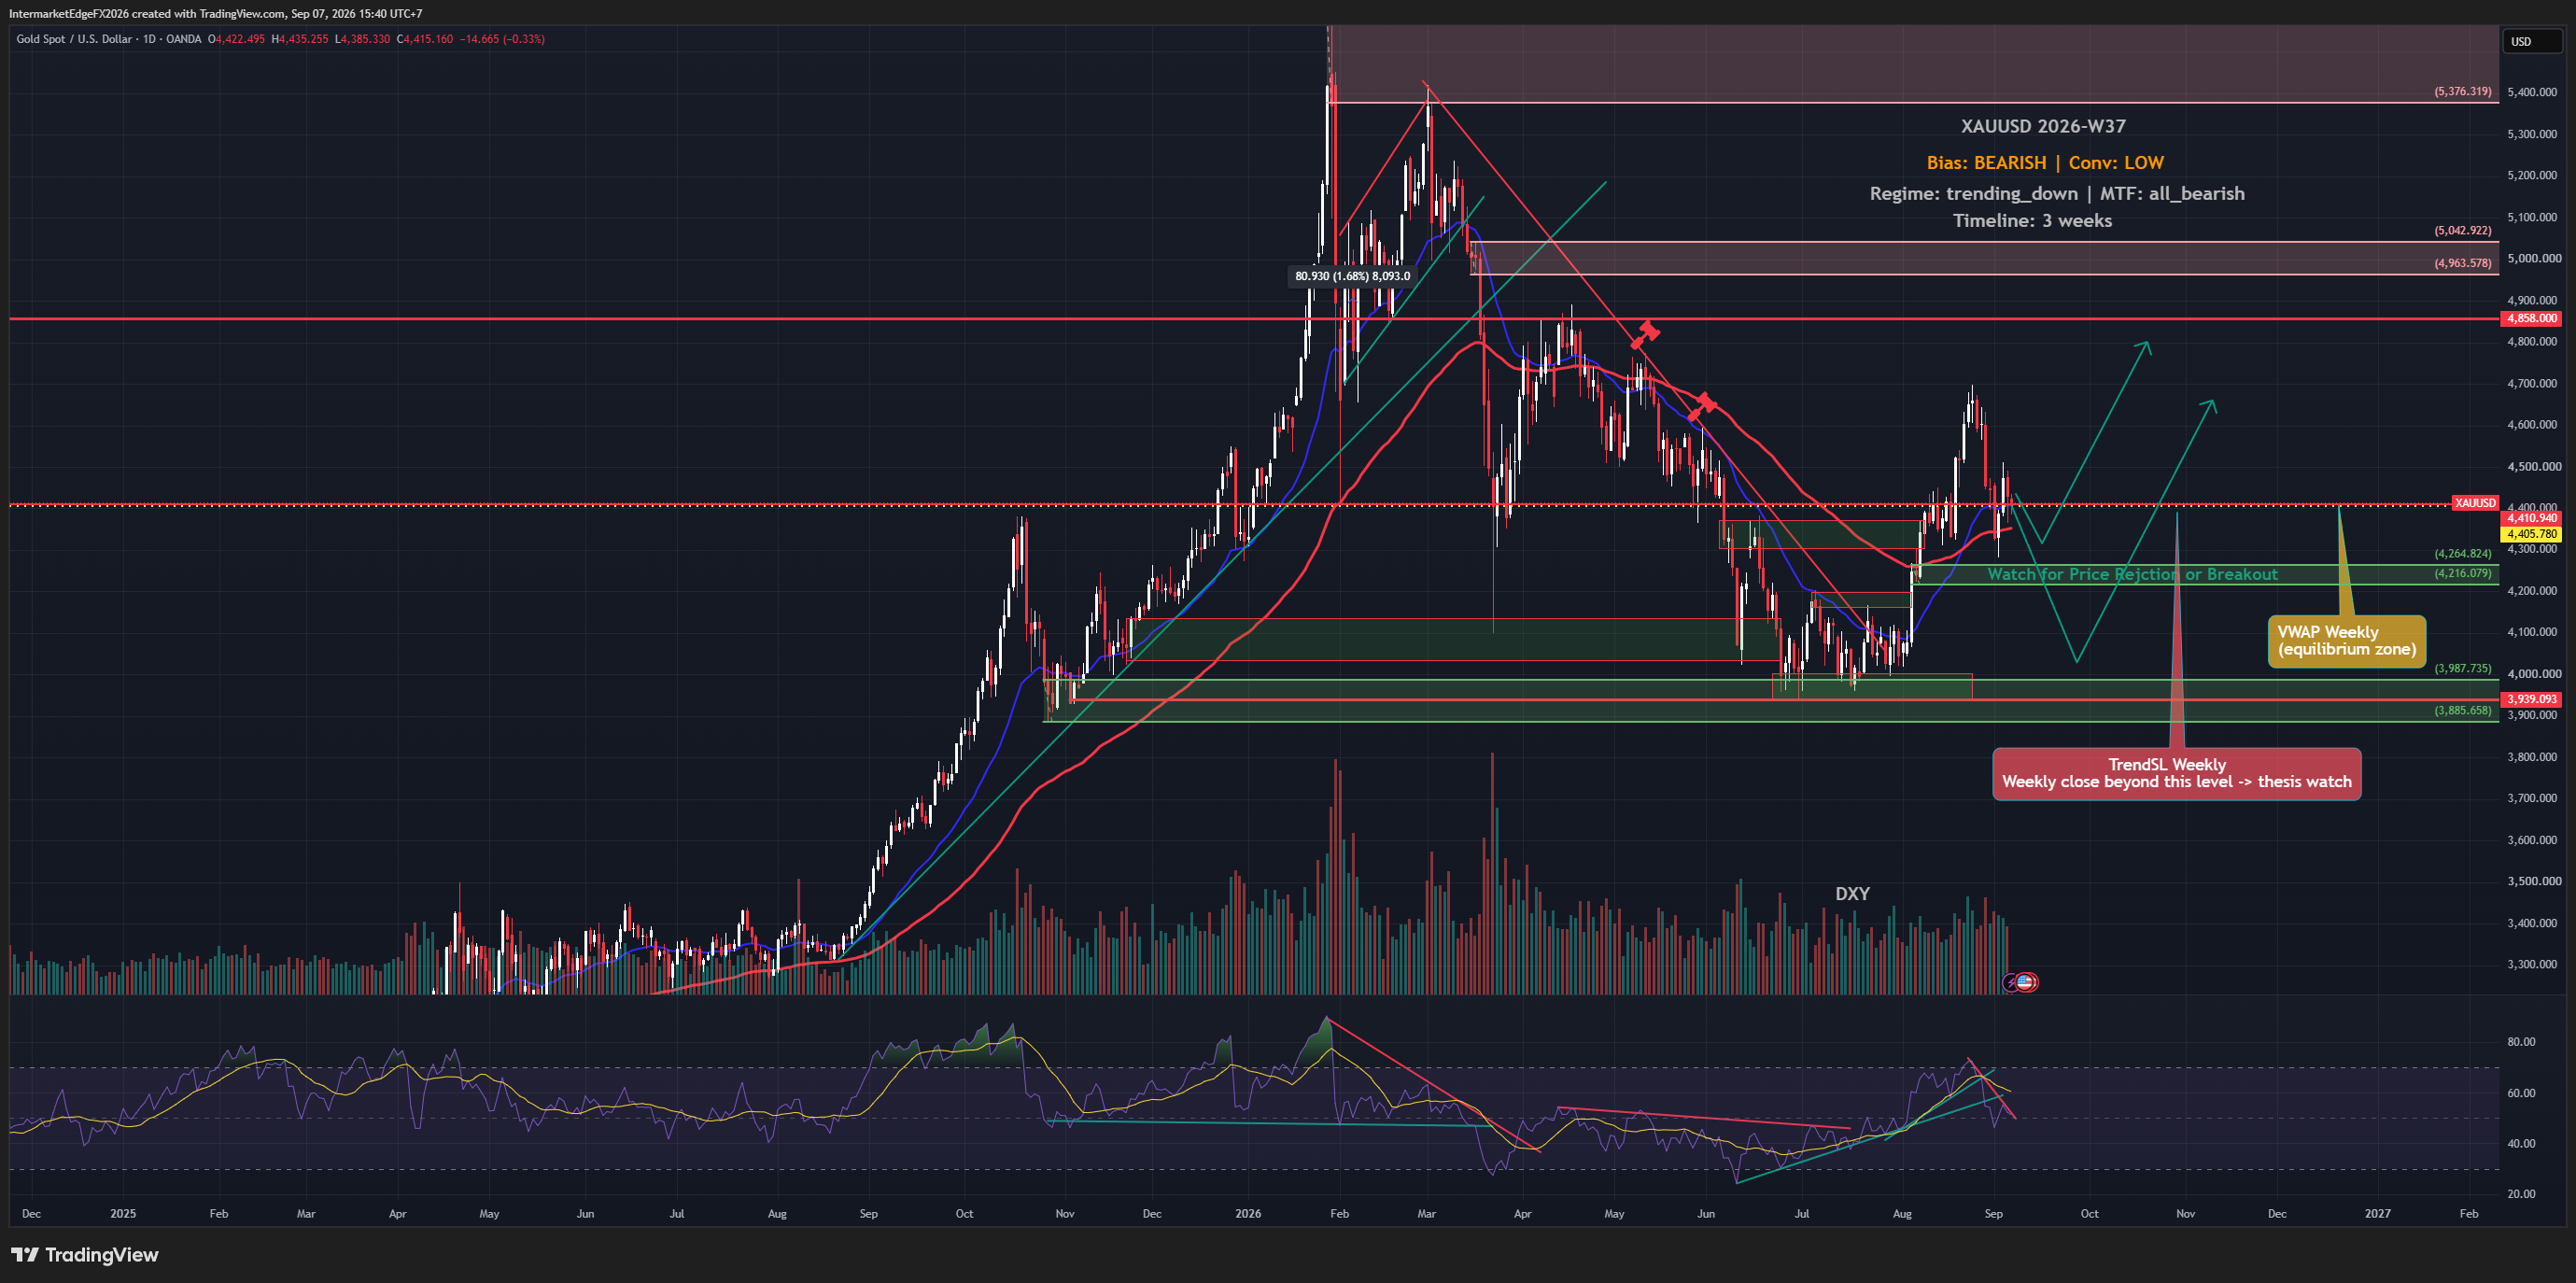
XAUUSD Week W37-2026: bearish structure, low conviction. Gold faced pressure after August payrolls rose 162,000 against the Reuters consensus of 56,000. But Hormuz tensions create competing safe-haven and inflation-policy risks. Neither that news nor the payrolls surprise guarantees a gold direction. The locked quote is 4403.68 at 08:17 UTC on Monday, September 7, 2026, source mt5:XAUUSD.sml:1m. Price is BELOW VWAP weekly 4405.78 by 2.10 and BELOW TrendSL weekly 4410.94 by 7.26, testing both from underneath. The view is bearish with low conviction over three weeks; the regime is a downtrend and monitored timeframes are bearish. The current stance is to stand aside. This is not an entry instruction. If price sustains above VWAP weekly 4405.78, it would warn of momentum against the thesis and warrant reviewing the size of existing shorts. Only a weekly close above TrendSL weekly 4410.94 would invalidate the bearish structure. Both conditions remain pending. August PPI is scheduled for September 10 and CPI for September 11, both at 08:30 US Eastern / 19:30 Vietnam time, per ForexFactory calendar data. Outcomes are unknown. Softer CPI could support gold if real yields and USD fall; hotter CPI could pressure it if both rise. Observe those responses rather than assuming them. Intermarket Edge For information and education only. Not financial advice.

DXY Week W37-2026: Strong Payrolls, but the Dollar Cannot Hold Its Gains

DXY Week W37-2026: Strong Payrolls, but the Dollar Cannot Hold Its Gains

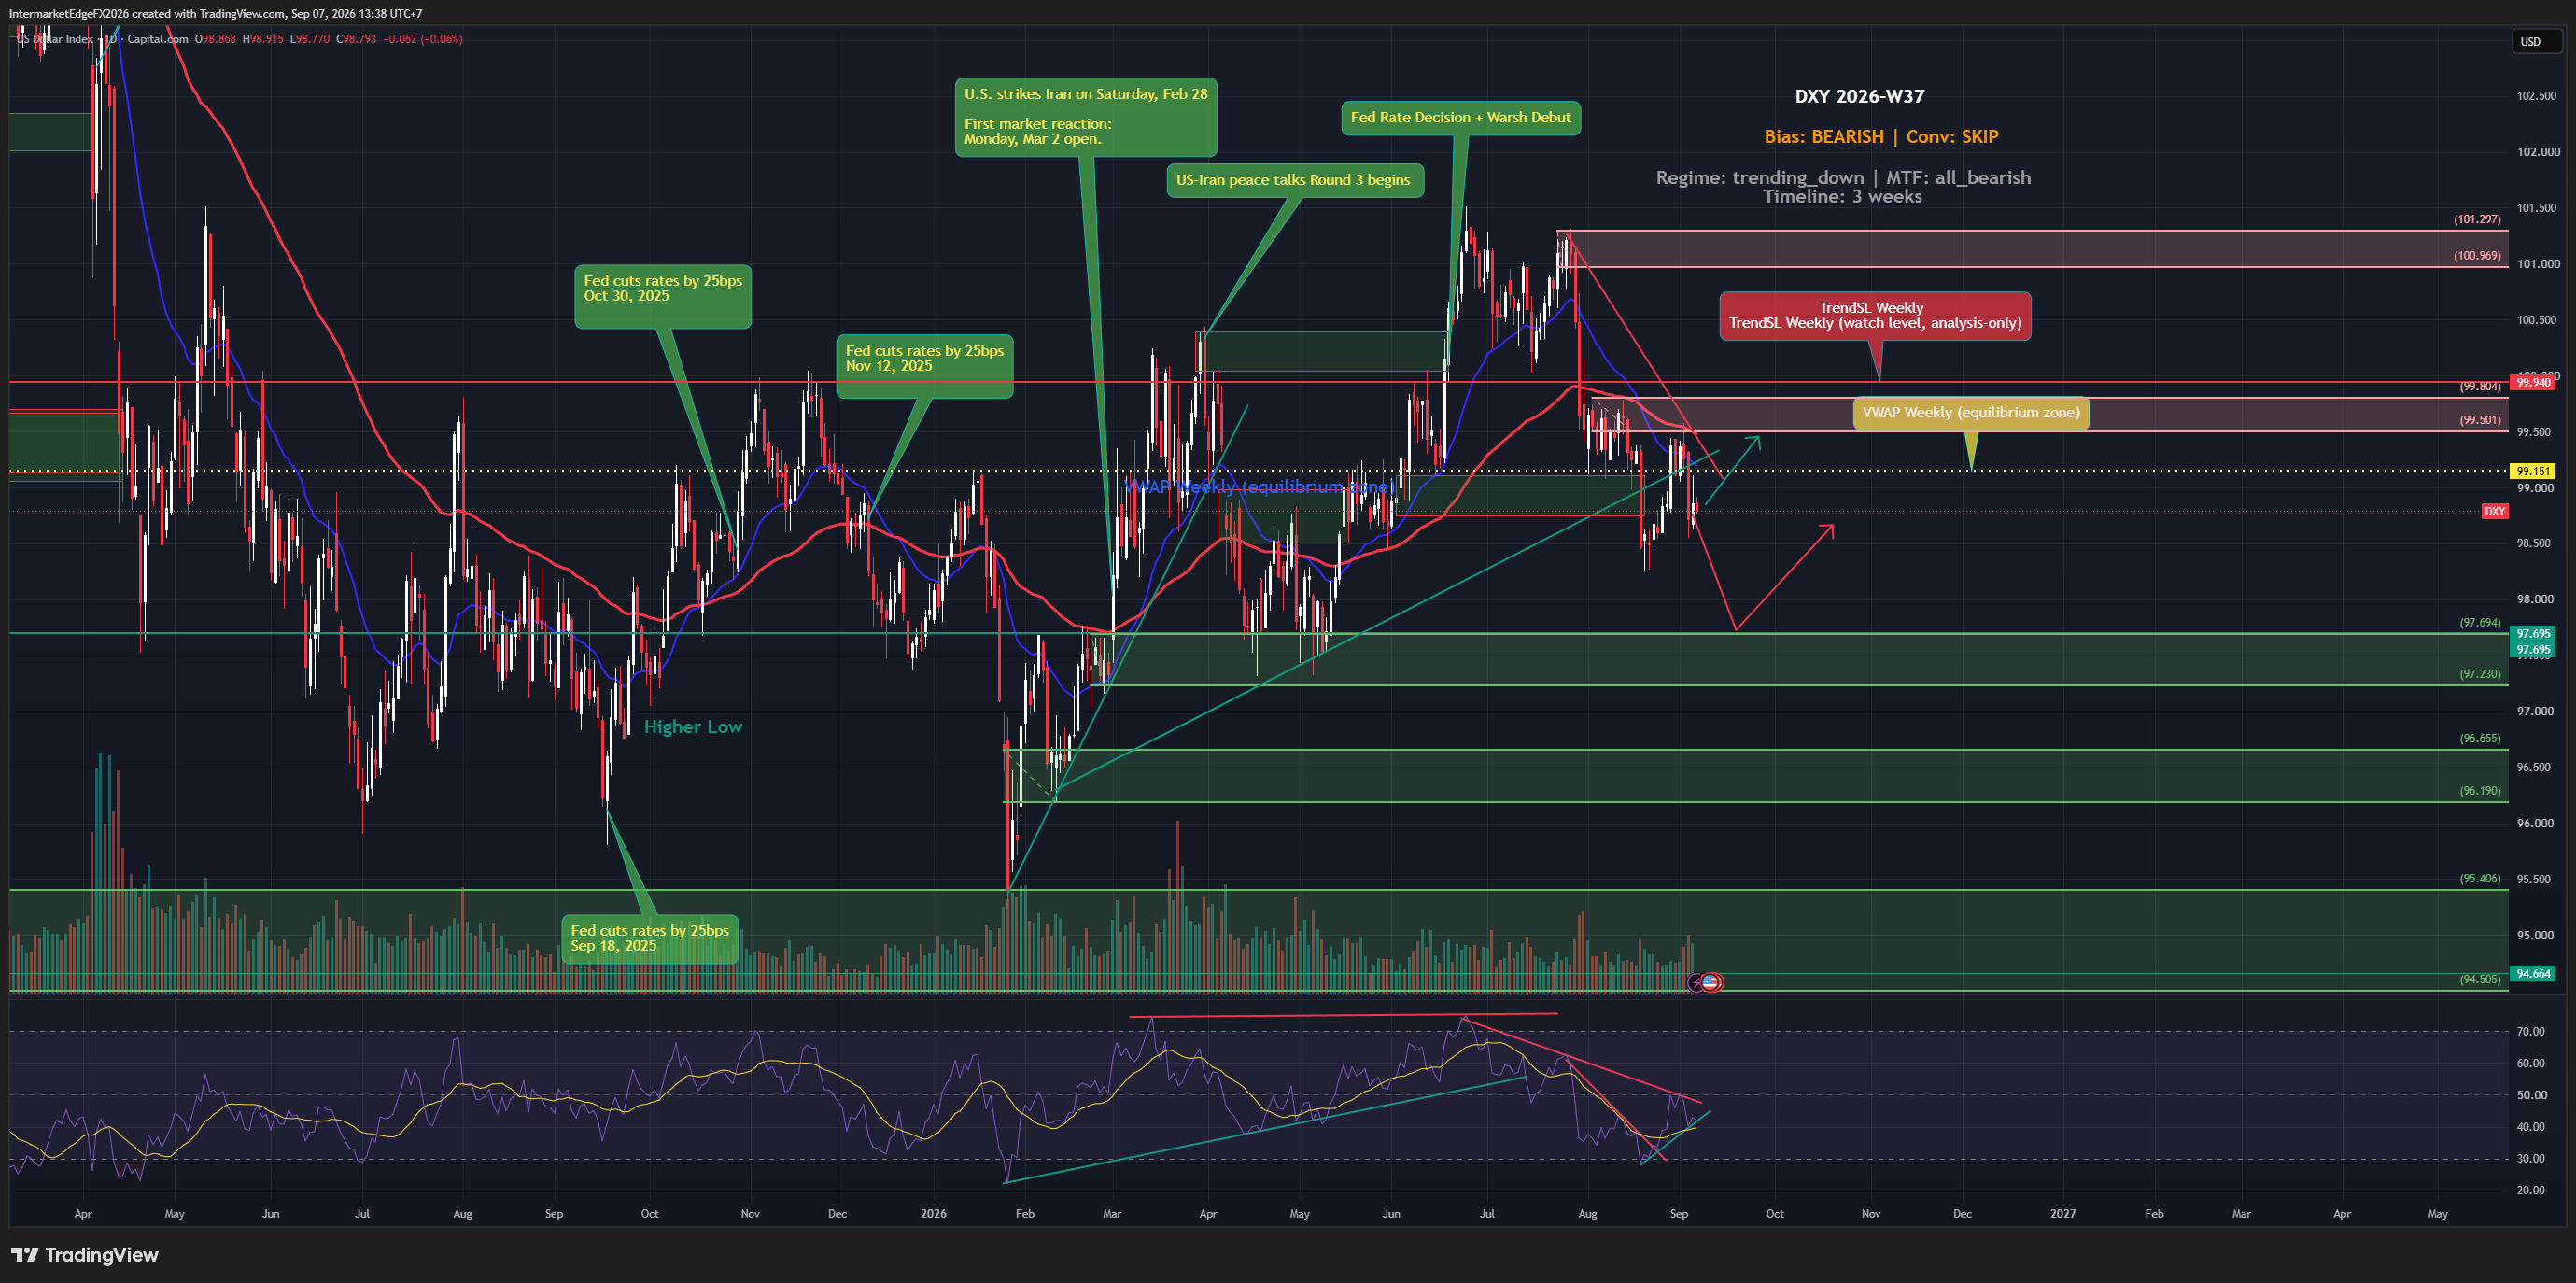
DXY Week W37-2026: strong payrolls, weak follow-through. August payrolls rose 162,000 against the Reuters consensus of 56,000, but the dollar pared its initial gains. Expectations of ECB and BOJ tightening can limit the relative US rate advantage; these remain expectations, not policy decisions. The locked quote is 99.165 at 03:58 UTC on Monday, September 7, 2026, from yfinance:DX-Y.NYB:1m. Price is ABOVE VWAP weekly at 99.151, testing from above by 0.014 points. That is an active short-term momentum conflict with the bearish view. Price remains BELOW TrendSL weekly at 99.94. The bias is bearish, the regime is a downtrend, and monitored timeframes are bearish. The horizon is three weeks. The action state is SKIP: stand aside. Neither the directional classification nor a later VWAP crossing is permission to enter a trade. A weekly close above TrendSL weekly at 99.94 would invalidate the bearish structure. This condition is pending; an intraday move would not be sufficient. August PPI is scheduled for September 10 and August CPI for September 11, both at 08:30 US Eastern / 19:30 Vietnam time, per ForexFactory calendar data. Outcomes are not yet known. For information and education only. Not financial advice.

USDCAD Week W36-2026: CAD Strengthens Despite a Hawkish Bank of Canada

USDCAD Week W36-2026: CAD Strengthens Despite a Hawkish Bank of Canada

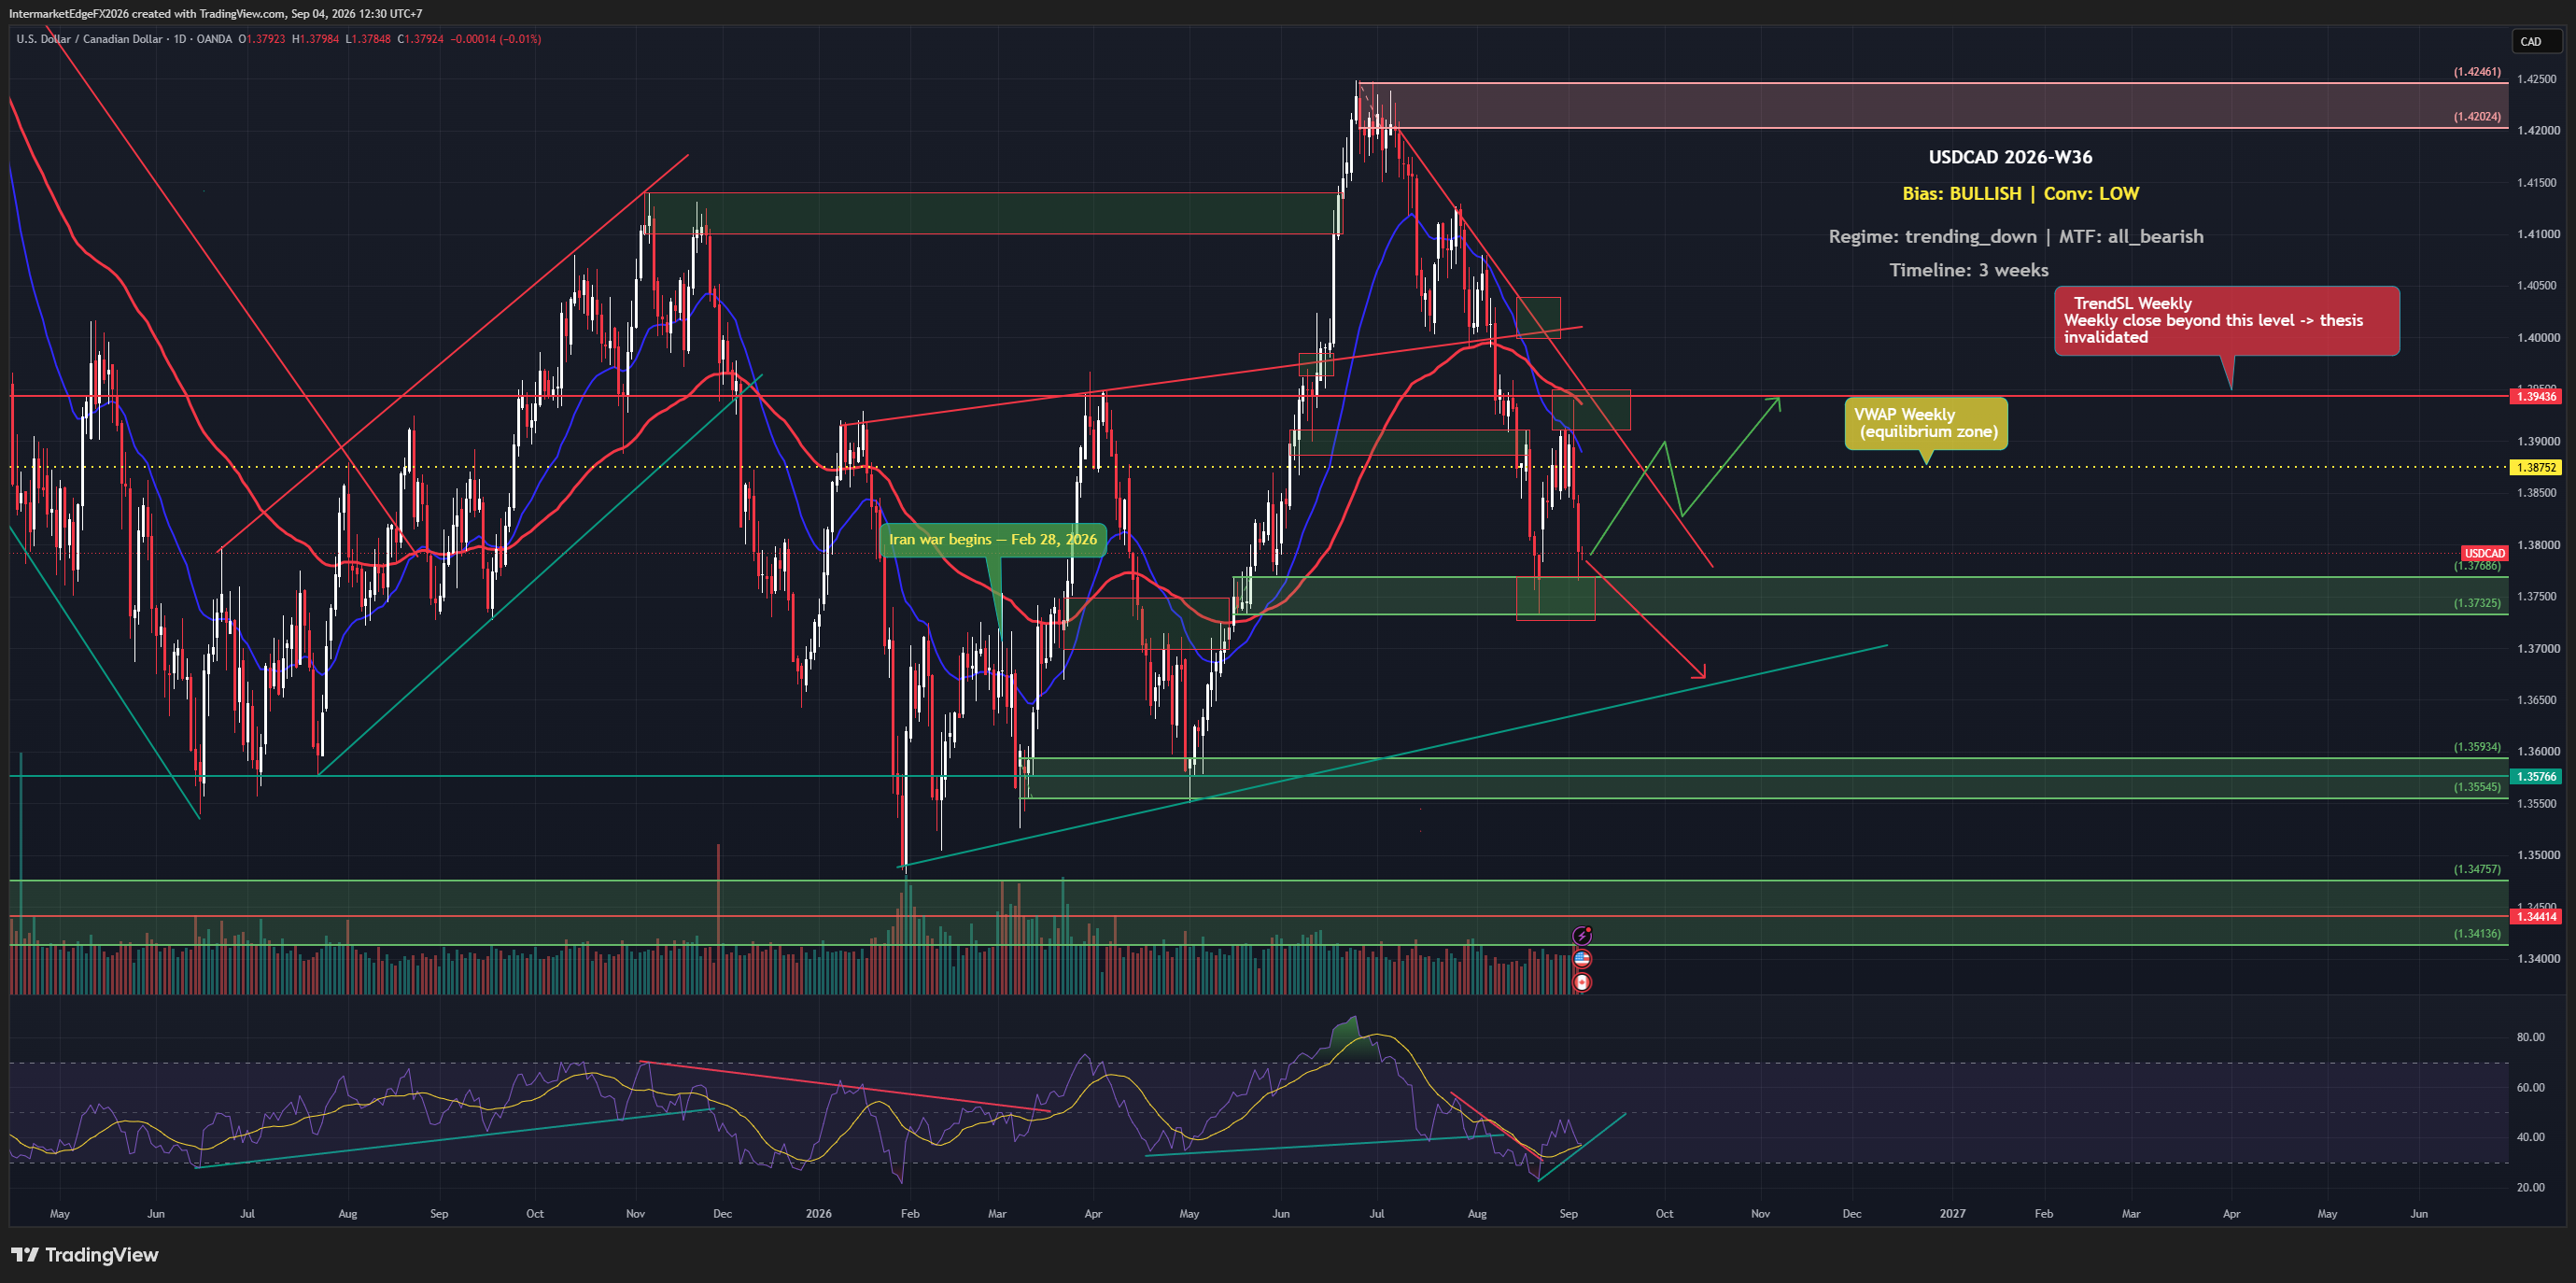
The Bank of Canada just signaled that persistent inflation could force multiple rate hikes, which on paper is a CAD-positive and USDCAD-negative catalyst. Yet as of Friday, 04 September 2026, the pair sits at 1.37896, below both its weekly VWAP and its trend stop-loss level, and the Canadian dollar actually strengthened in the latest session. When a hawkish central bank warning fails to lift the pair, that divergence between narrative and price deserves serious attention before any directional bet is sized. The directional call on USDCAD for this three-week window is bullish, anchored on two structural pillars: the Fed's hawkish posture lifting real yields and widening the rate differential against the BoC, and a COT positioning lean that tilts modestly in the dollar's favor. When the Fed keeps real yields elevated while the BoC sits on hold, the carry dynamic, the return earned by holding the higher-yielding currency, funded by selling the lower-yielding one, mechanically favors USD. That logic is coherent and consistent with past USDCAD behavior during Fed-BoC divergence cycles. The problem is that conviction here is deliberately low, and for reasons that go beyond a single data point. Two of the five analytical pillars, liquidity conditions and market sentiment, produced no usable signal this week. That silence does not mean those factors are neutral; it means the evidence base is incomplete, and sizing a position on three pillars when two are dark is a different risk than sizing on five. More critically, the price itself is already contradicting the thesis at its foundation: at 1.37896, USDCAD is trading below the weekly VWAP at 1.38752 and below the weekly trend stop-loss at 1.39429, meaning the technical structure does not support the bullish label, it actively contradicts it. The bullish bias reflects a macro and positioning overlay, not a technically confirmed setup. -- Intermarket Edge (Note: COT (Commitment of Traders) data is released weekly by the CFTC

EURUSD Week W36-2026: Price Holds Above 1.15942 VWAP as Fed Beige Book Strengthens the Dollar Case, But the Chart Refuses to Confirm

EURUSD Week W36-2026: Price Holds Above 1.15942 VWAP as Fed Beige Book Strengthens the Dollar Case, But the Chart Refuses to Confirm

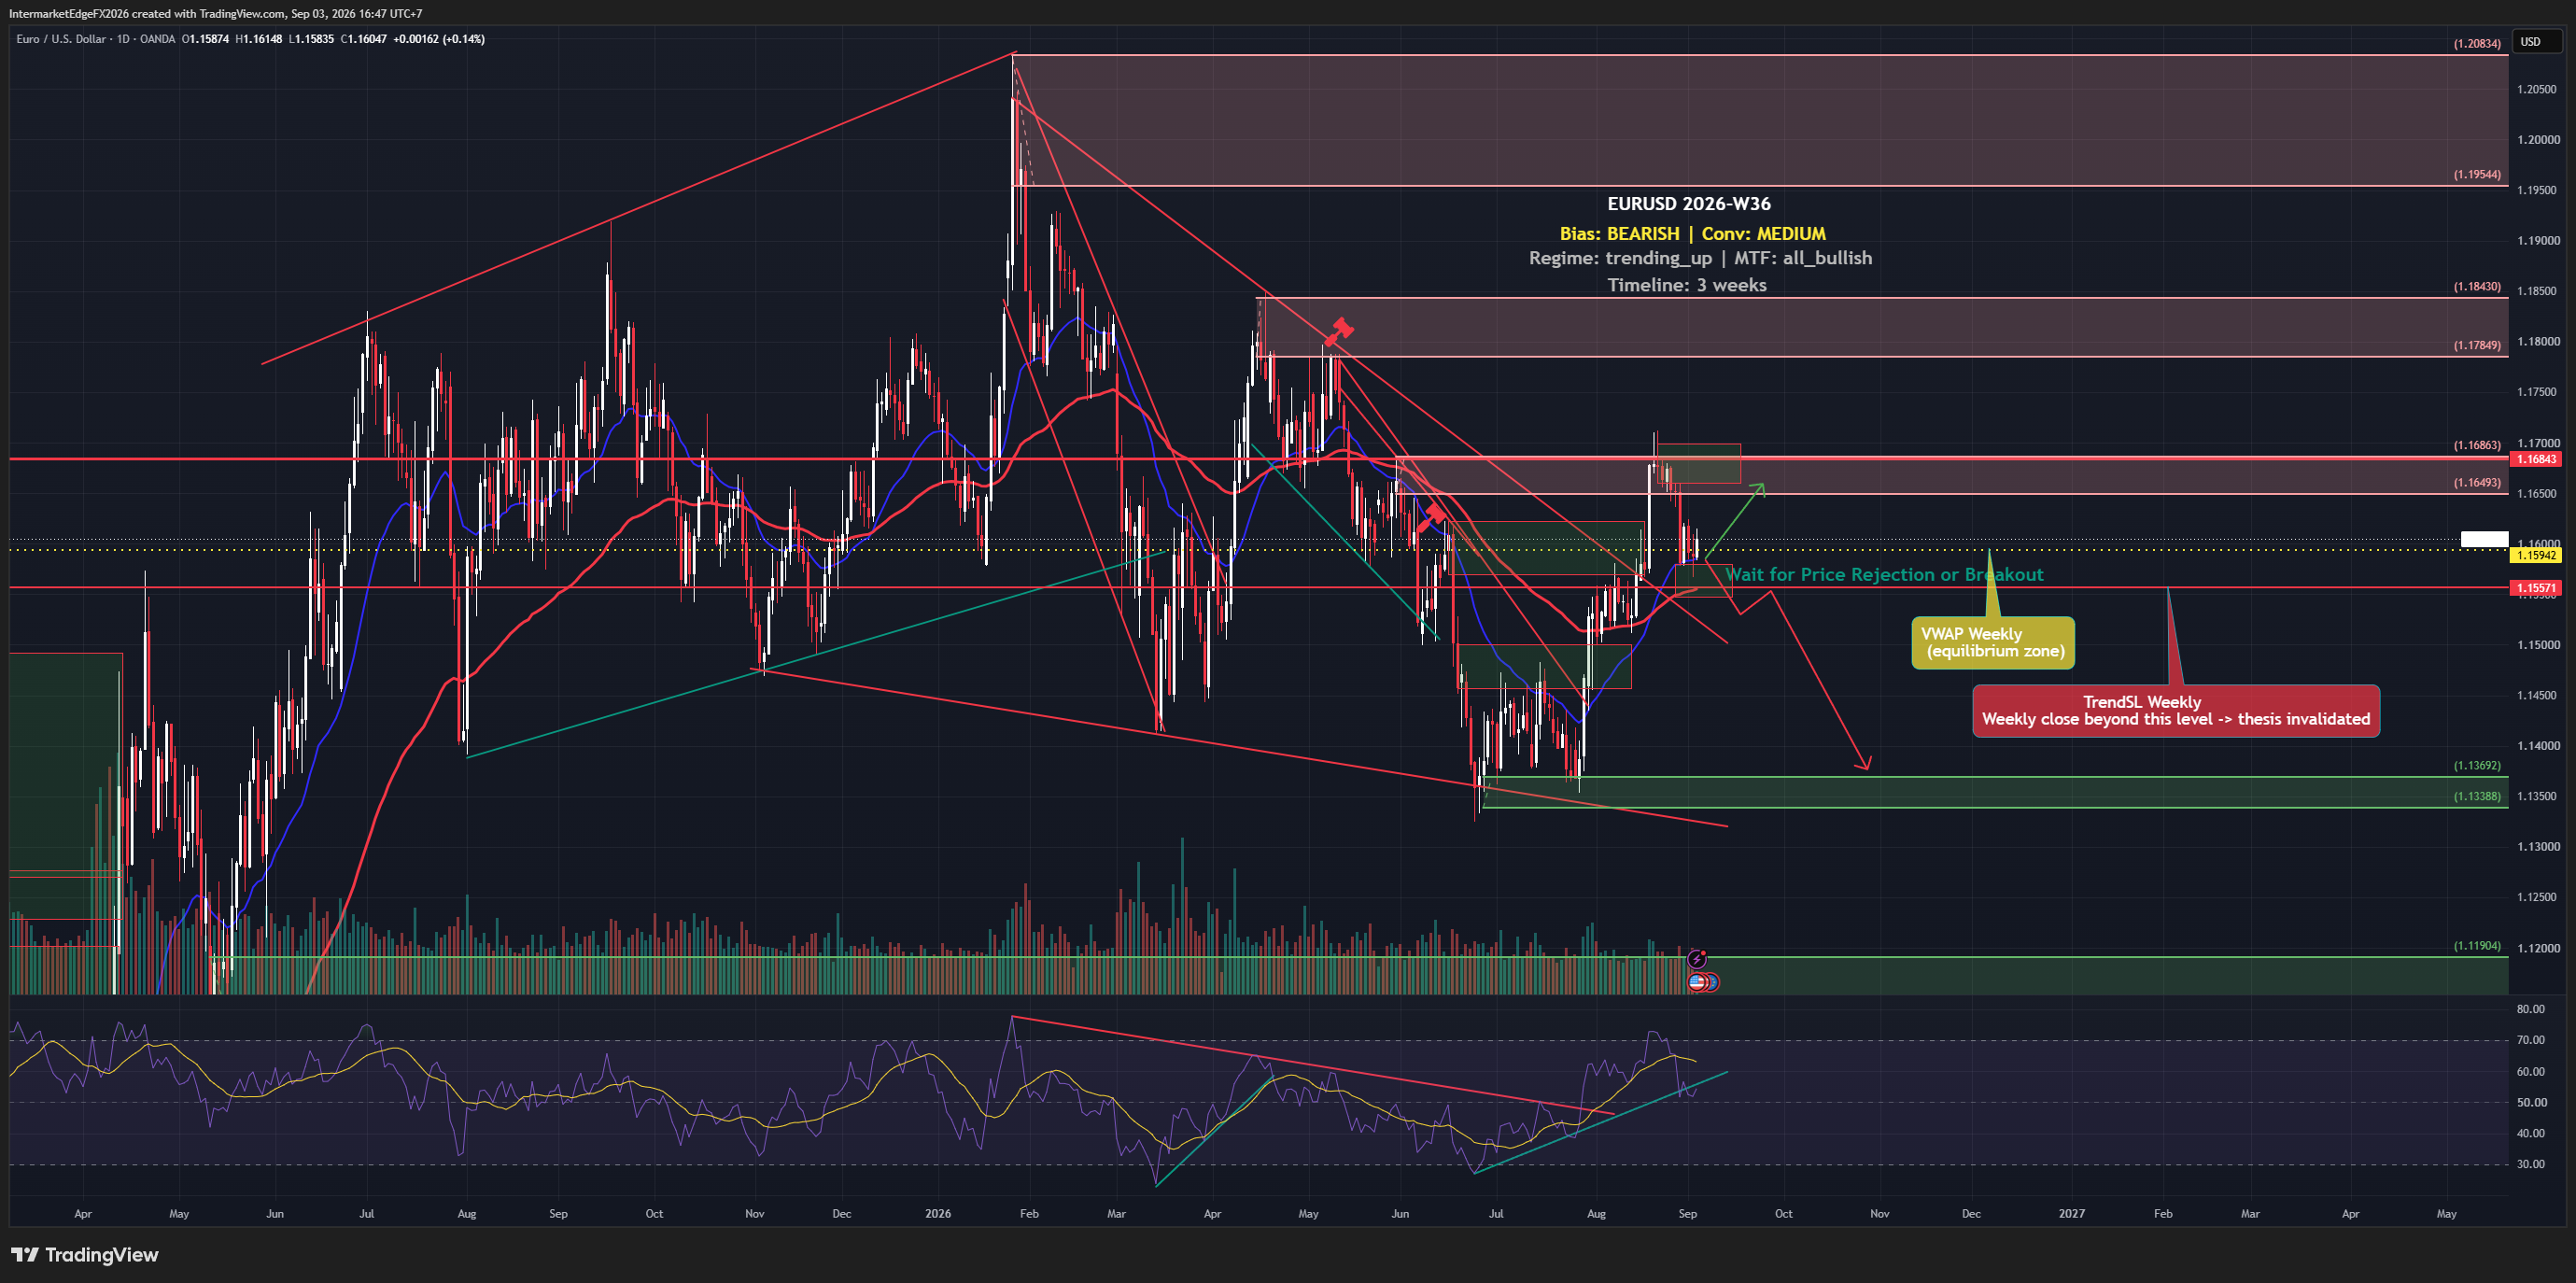
EURUSD is trading at 1.15972 as of Thursday, 03 September 2026, sitting above the weekly VWAP at 1.15942, and that positioning alone tells you the bearish macro thesis has not yet found technical confirmation. The Fed Beige Book flagged modest growth and elevated input-price pressures, keeping the hawkish USD narrative alive. But daily, weekly, and monthly trend signals are all pointing the same direction: up. That conflict is the trade problem this week, not the direction call. The analytical framework carries a bearish bias on EURUSD for the next three weeks, driven primarily by the ECB-versus-Fed rate differential. The causal chain runs as follows: the Fed remains hawkish because inflation, particularly in goods inputs, has not fully cooled, which means rate cuts are off the table near-term; that keeps real US yields elevated; elevated real yields make dollar assets genuinely attractive on a return-adjusted basis, not just nominally; and that sustained demand for dollars exerts downward pressure on EURUSD over a multi-week horizon. The conviction behind this view is medium, not high, and the reason matters. The conflict embedded in this setup is serious and should not be minimized. Price, COT positioning, and the technical trend structure are all reading bullish, not marginally, but comprehensively. Daily, weekly, and monthly trend signals are simultaneously aligned to the upside, which represents the maximum level of multi-timeframe technical conviction available. COT data shows a bullish lean as well, though the specific report week and net-position figures are not disclosed in this brief, so that reading should be treated as directional evidence rather than a precise positioning snapshot. What this means practically: the bearish label here is a macro-structural override, not a technically confirmed setup. -- Intermarket Edge

EURGBP Week W36-2026: Technicals Hold Bullish Structure Above 0.85647, But the Macro Story Has a Hole in It

EURGBP Week W36-2026: Technicals Hold Bullish Structure Above 0.85647, But the Macro Story Has a Hole in It

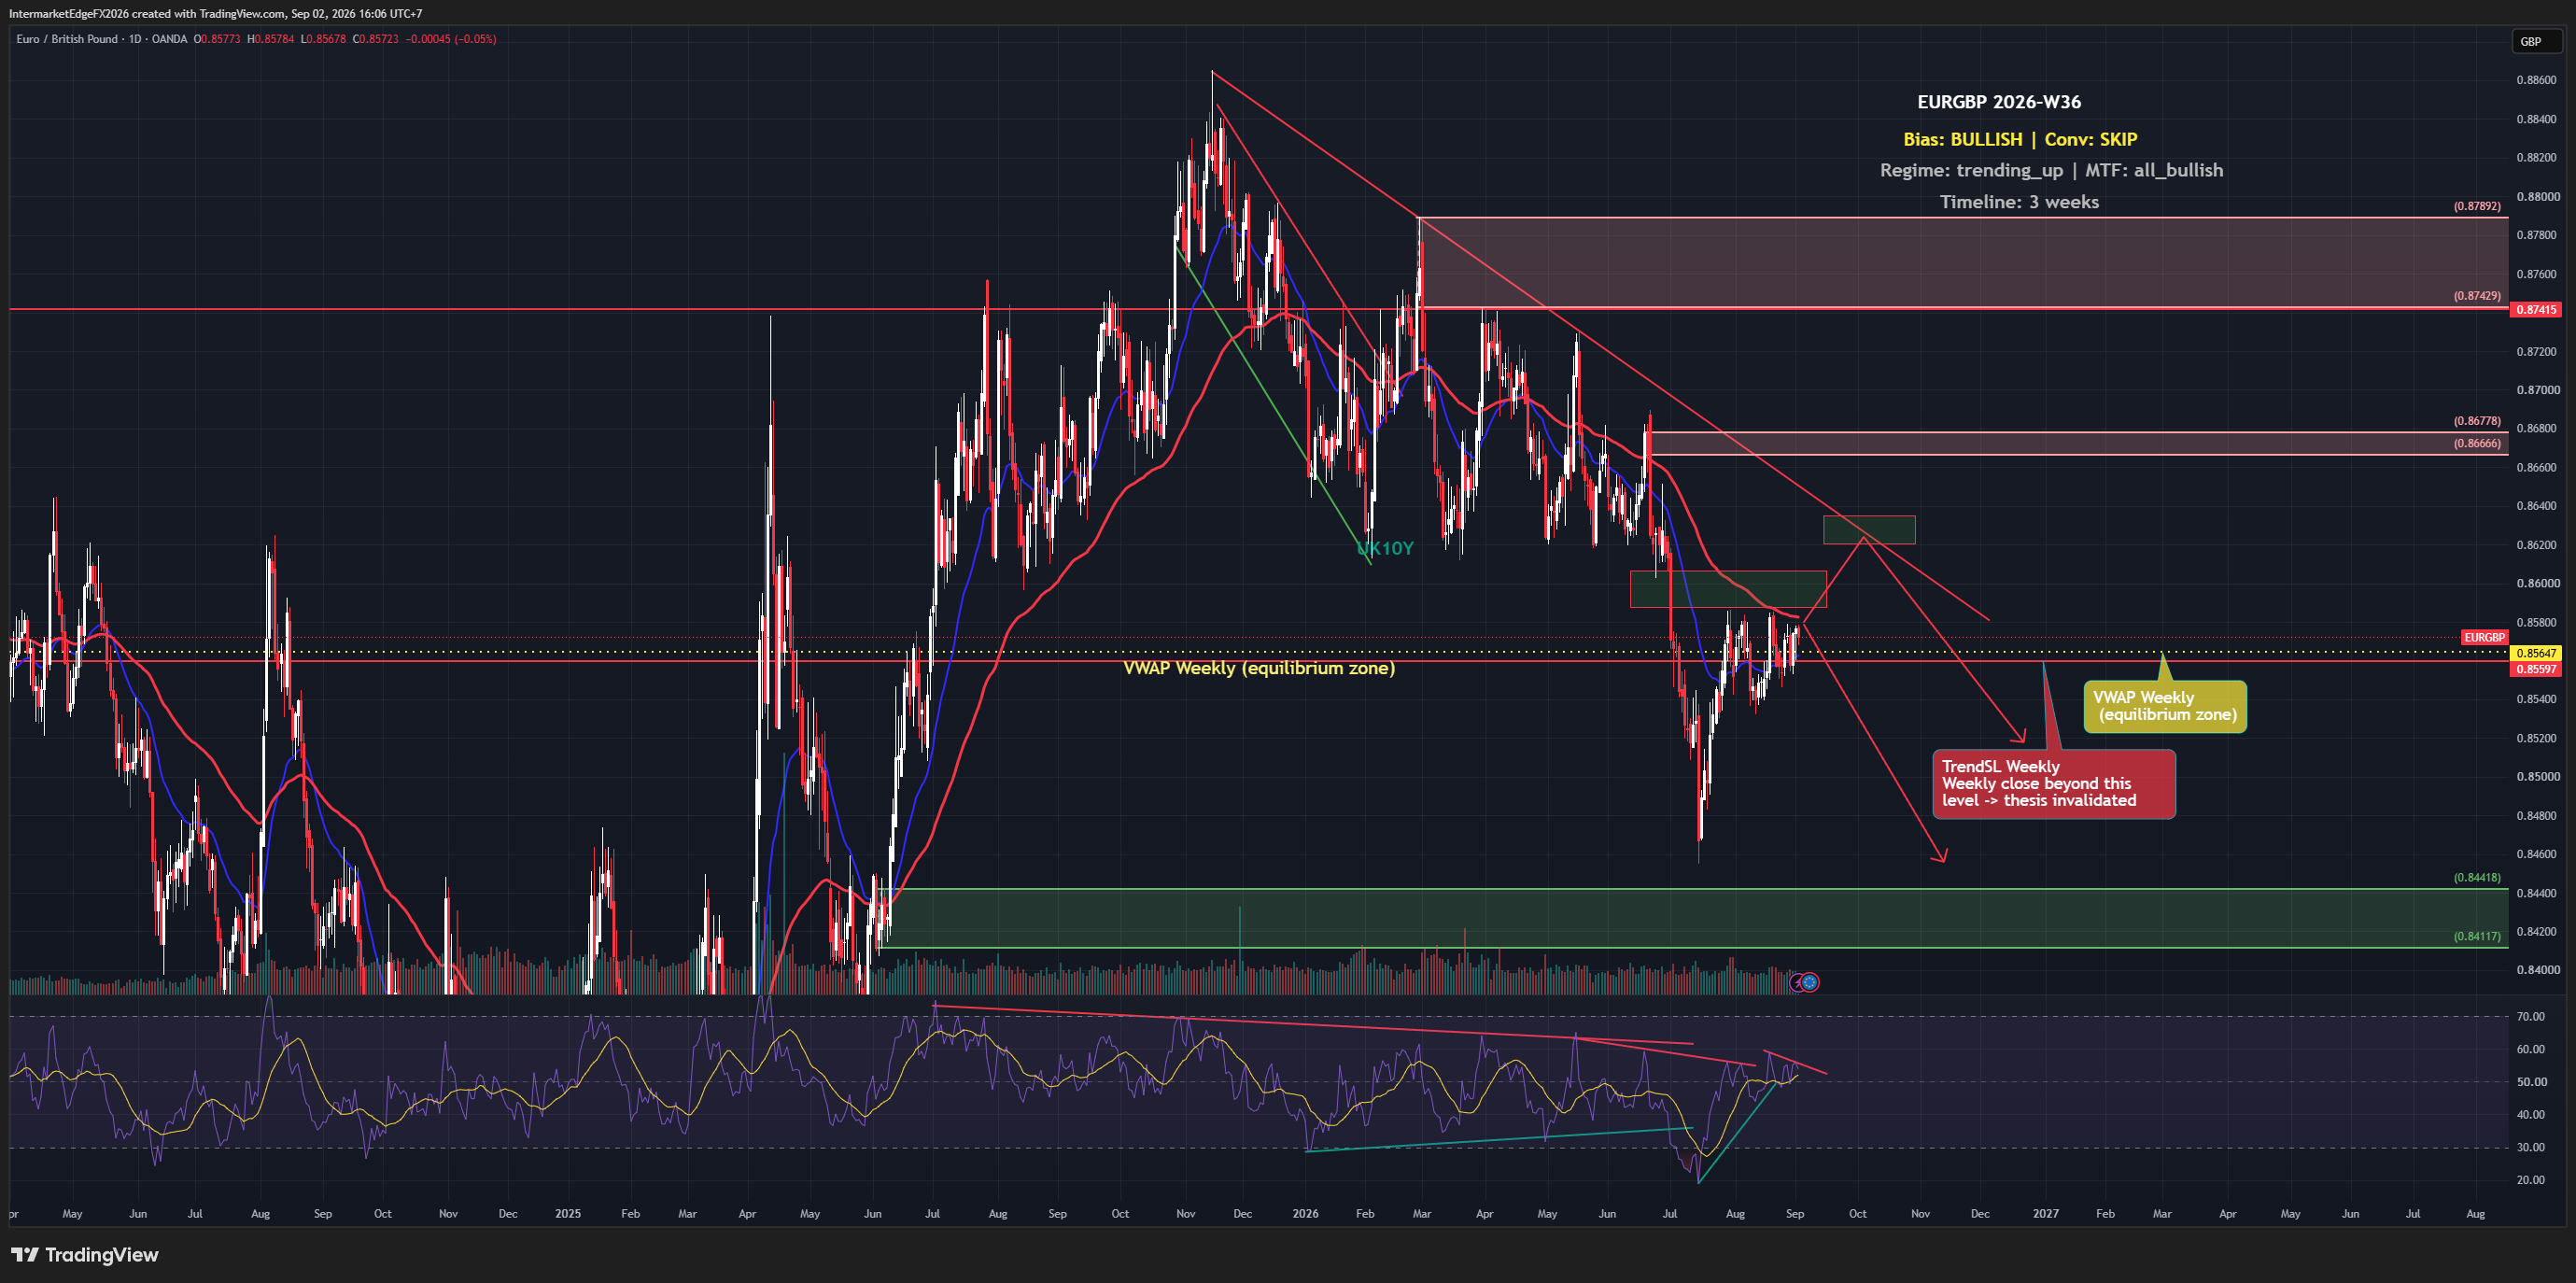
EURGBP is trading above its weekly VWAP at 0.8577 as of Wednesday, 02 September 2026, with charts aligned bullish across every timeframe. The catch: the entire bullish case rests on technical structure alone, no macro confirmation, no positioning signal, nothing beyond price telling you which way to lean. That narrow foundation is exactly what makes this week's setup worth watching carefully rather than trading aggressively. The bullish bias on EURGBP this week is real but structurally thin. Daily, weekly, and monthly technical trend signals are all pointing the same direction, that multi-timeframe alignment, where price structure agrees across short, medium, and long horizons, is the strongest argument for the upside case. It reduces the probability that you are catching a random short-term noise move against a larger trend. What it does not do is tell you why the move should continue or how far it goes. The stated fundamental driver for this pair is the ECB versus BoE rate differential, the gap between where the two central banks are setting rates and where markets expect them to go, which directly affects the relative attractiveness of holding euros versus pounds. That differential is a plausible and historically significant driver for EURGBP. The problem this week is that the macro evidence has produced no confirming signal. The rate differential is the narrative, but the data behind it has not fired. That gap between a coherent story and an absent signal is the defining tension. The practical consequence is that the conviction level here amounts to a deliberate decision to stand aside. The technical foundation is present; everything else that would normally underpin a higher-confidence directional trade, positioning data, a macro catalyst, sentiment confirmation, is not contributing. -- Intermarket Edge

EURJPY Week W36-2026: Technicals Hold Above 185.37 as Japan's Retail Sales Surge Meets a Dollar Bidding for Rate Hikes

EURJPY Week W36-2026: Technicals Hold Above 185.37 as Japan's Retail Sales Surge Meets a Dollar Bidding for Rate Hikes

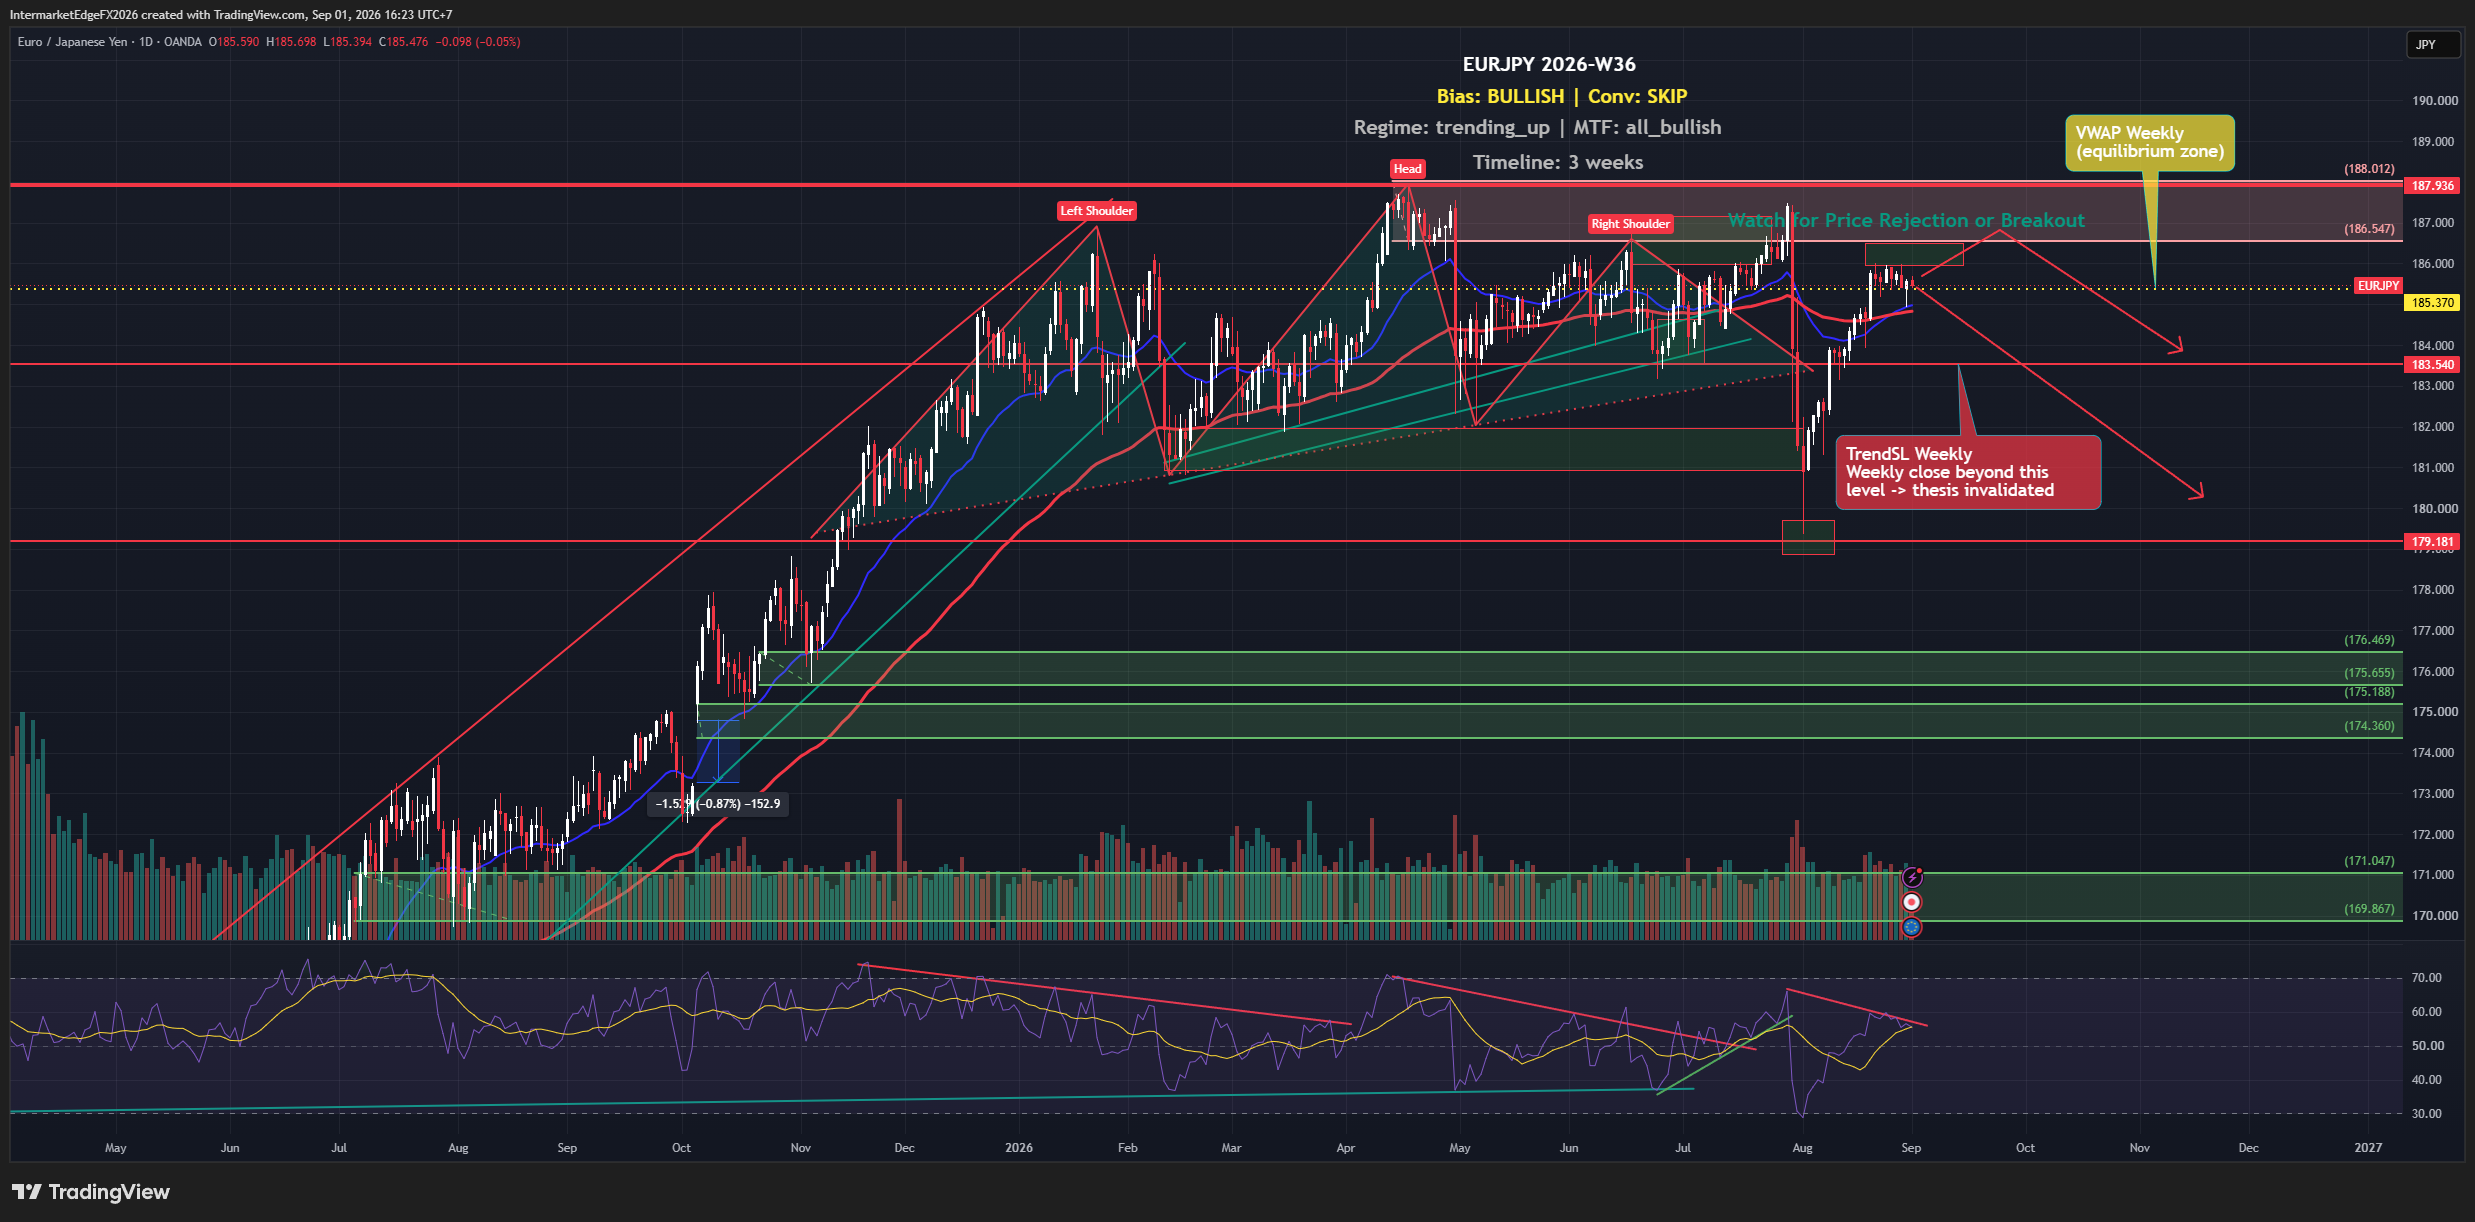
EURJPY is trading at 185.6 as of Tuesday, 01 September 2026, sitting just above its weekly VWAP at 185.37 with every timeframe technically aligned to the upside. Japan just delivered a retail sales print of 4.0% YoY, nearly double the forecast, and industrial output surprised to the upside as well. Yet the overall bullish conviction here is deliberately low, and that gap between clean technicals and absent macro support is exactly the tension worth understanding before sizing any exposure. The bullish bias on EURJPY for week W36-2026 rests on a single, structurally sound but narrowly sourced pillar: every technical timeframe, daily, weekly, and monthly, is aligned to the upside. That kind of multi-timeframe agreement is not common and is not trivial; it indicates the dominant trend is consistently reproduced at every analytical resolution, which reduces the probability that any one signal is noise. The practical effect is that the path of least resistance, absent a disrupting catalyst, points higher. What complicates this is that technical alignment is the only signal firing. COT positioning, which measures how leveraged and institutional accounts are positioned and would indicate whether professional capital is actually behind the move, has returned neutral with no directional read this week, so it is not possible to say the trend is being driven by the kind of committed positioning that sustains extended moves. Macro signals, sentiment gauges, and liquidity conditions have all returned similarly flat. This matters because a trend that rests solely on price-derived signals, without confirmation from who is positioned and why, carries crowding risk in a different form: the risk that the apparent trend is thin and vulnerable to a rapid unwind the moment a real macro trigger appears. The BOJ policy trajectory is the most direct potential disruptor on the JPY leg. -- Intermarket Edge (Note: COT (Commitment of Traders) data is released weekly by the CFTC with a report

Stay in the loop

Get notified about new research, macro insights, and market analysis.

InterMarketEdge

© 2026 InterMarketEdge. Financial intelligence for inter-market traders.