Articles — InterMarketEdge

Articles

Financial intelligence, macro research, and inter-market analysis.

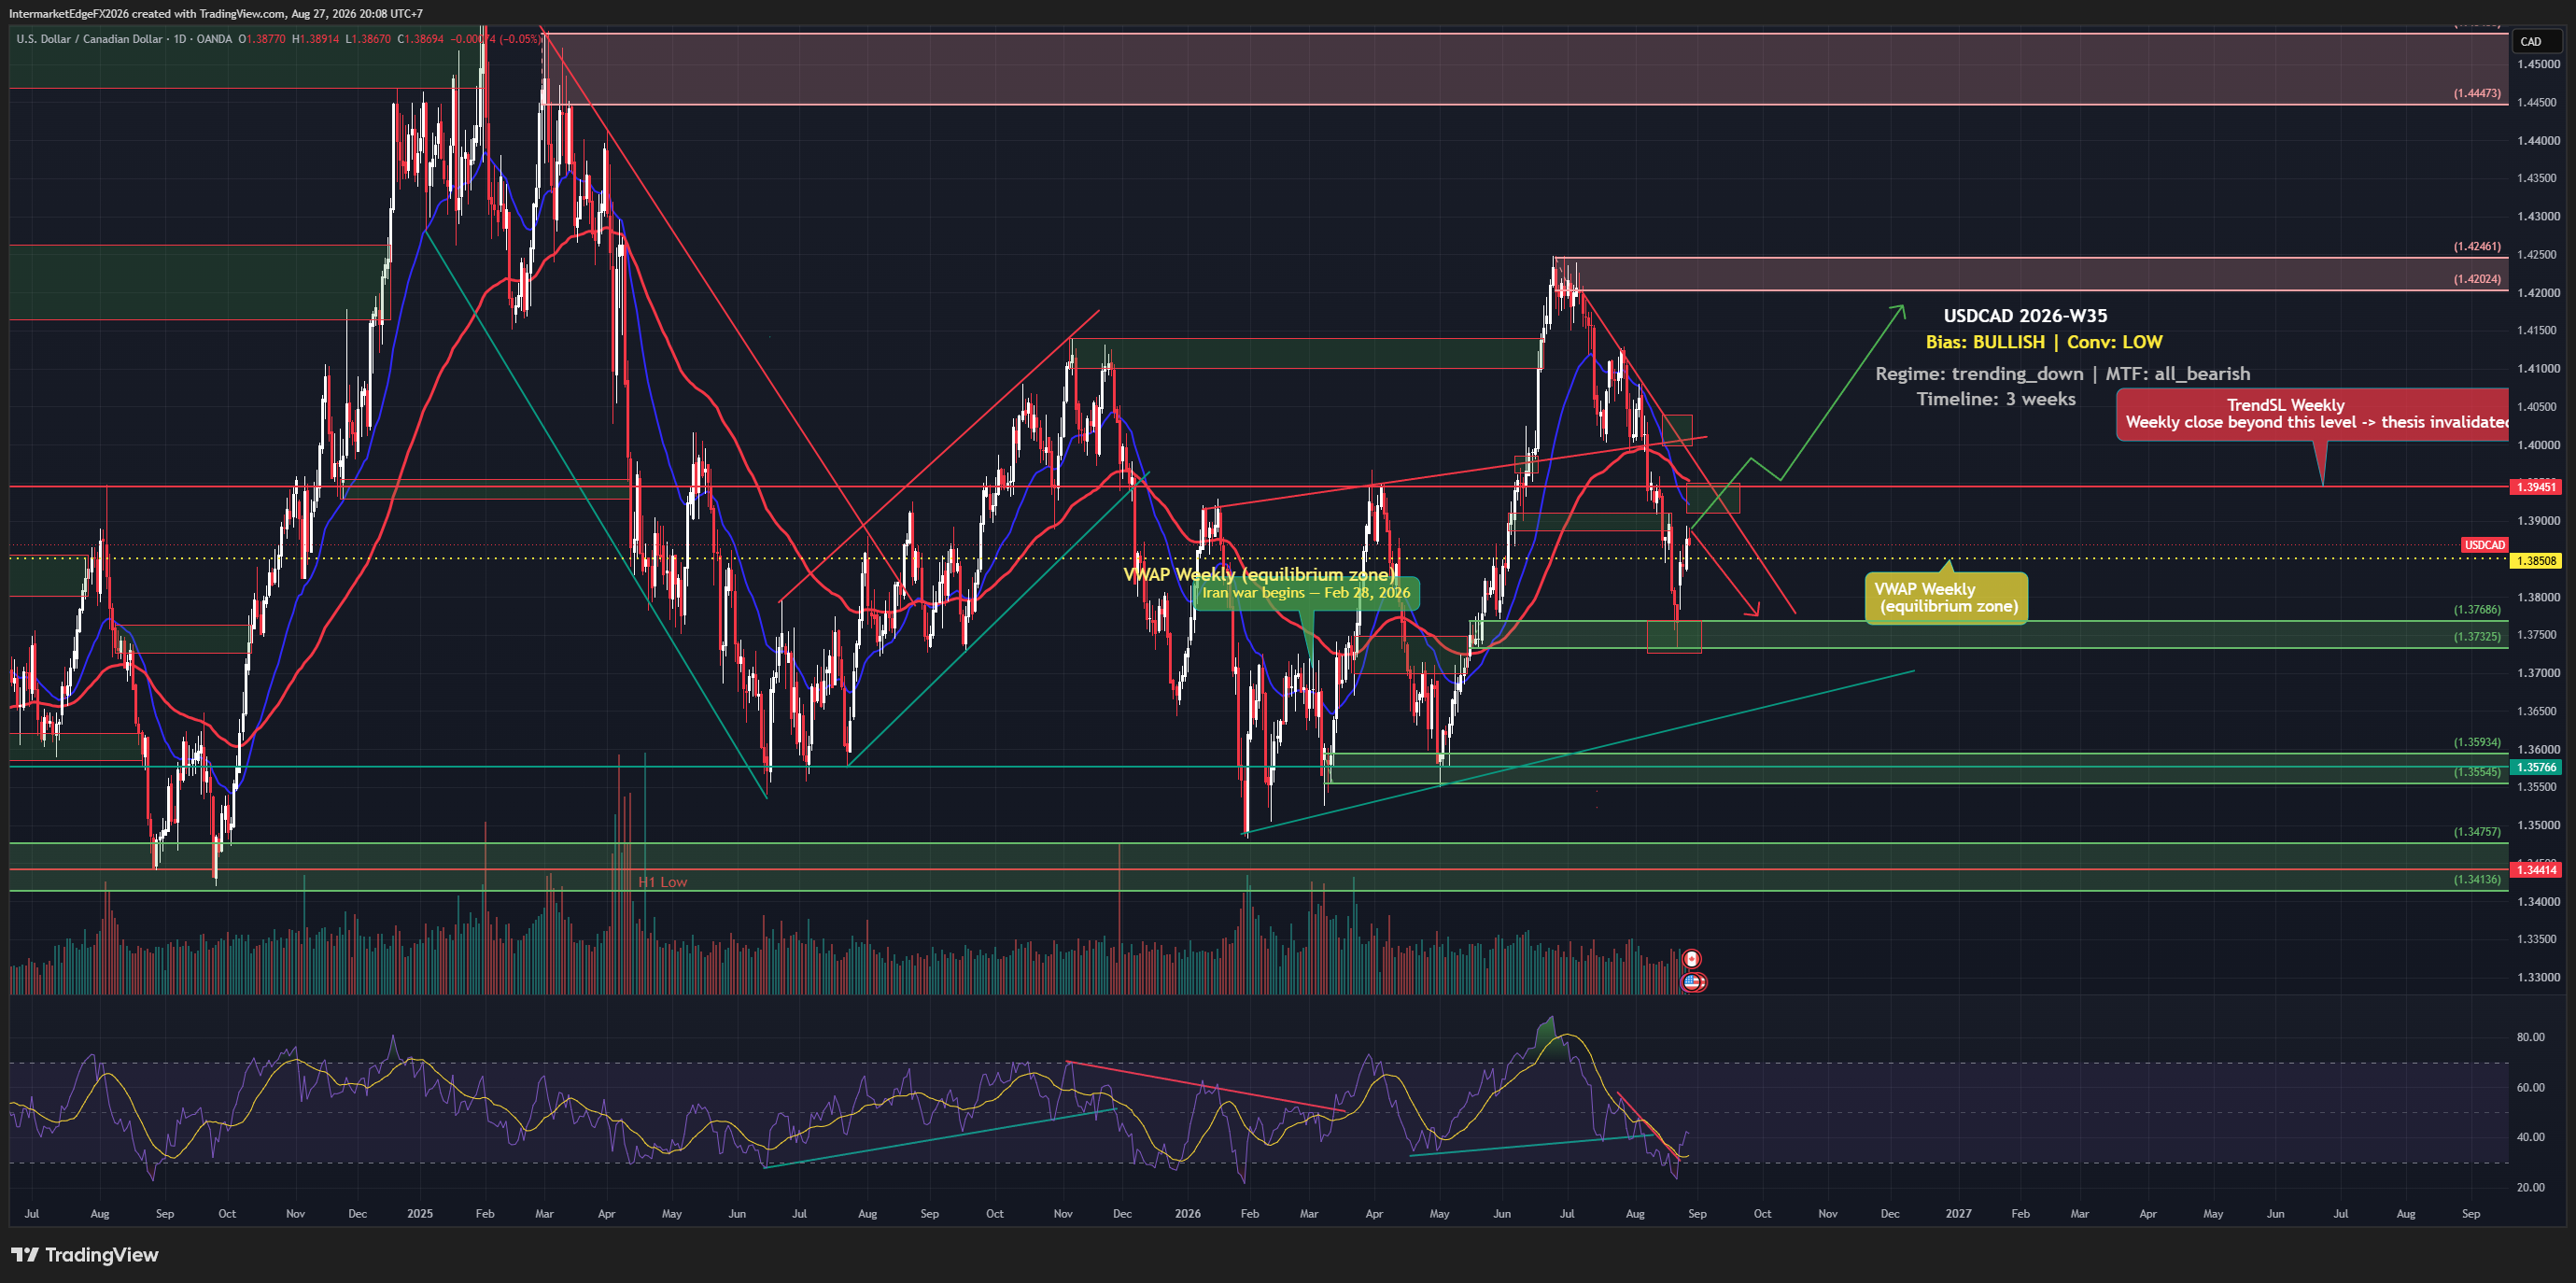
USDCAD - Wave (4) Absorbing at 1.415-1.417 Before Wave (5) Targets 1.4447-1.4540, but Macklem Is No Longer Purely Dovish

USDCAD - Wave (4) Absorbing at 1.415-1.417 Before Wave (5) Targets 1.4447-1.4540, but Macklem Is No Longer Purely Dovish

USDCAD - SUMMARY 02/07/2026 Regime: Wave (4) Absorbing at Anticipated Support, Medium-High Bull. USDCAD 1.4165 (-0.36%), wave (3) completed at the ~1.42 peak (double squeeze of DXY 13m high + oil below 70). Price now testing exactly the 1.415-1.417 support zone. Bias: Medium-High Bull. Strongest driver: USOIL 67.6 continuing to decline (per yesterday's USOIL "5 weeks of ignored draws" thesis) -- CAD petro-currency, weak oil weakens CAD. DXY in its own wave (4) (100.8, -0.71%), adds further tailwind on completion. US real yield +0.27% (corrected, actually lower than pipeline's 2.089%). New variable: BoC Macklem at Sintra today no longer purely dovish -- "comfortable where we are," rejects "stagflation," though still flags tariffs and inflation dilemma. Slows but does not reverse the thesis. Headwind: VIX -3.2% (risk-on supports commodity FX), XAUUSD +2.39% -- both overridden by oil weakness. D1 structure: wave (3) peak 1.42, wave (4) testing 1.415-1.417. Wave (5) targets: 1.4447 then 1.4540. Invalidation: below 1.400. Scenarios: wave (4) holds, wave (5) initiates (55%); sideways awaiting NFP (25%); BoC more hawkish, breaks 1.410 (15%); sharp oil bounce, falls to 1.400 (5%). Do not commit full position. Await confirmation via NFP 3 July. For informational purposes only. Not financial advice.

USOIL - Five Consecutive Weekly Draws and Price Keeps Falling: When the Market Ignores Inventory, the Supply Narrative Is Winning Absolutely

USOIL - Five Consecutive Weekly Draws and Price Keeps Falling: When the Market Ignores Inventory, the Supply Narrative Is Winning Absolutely

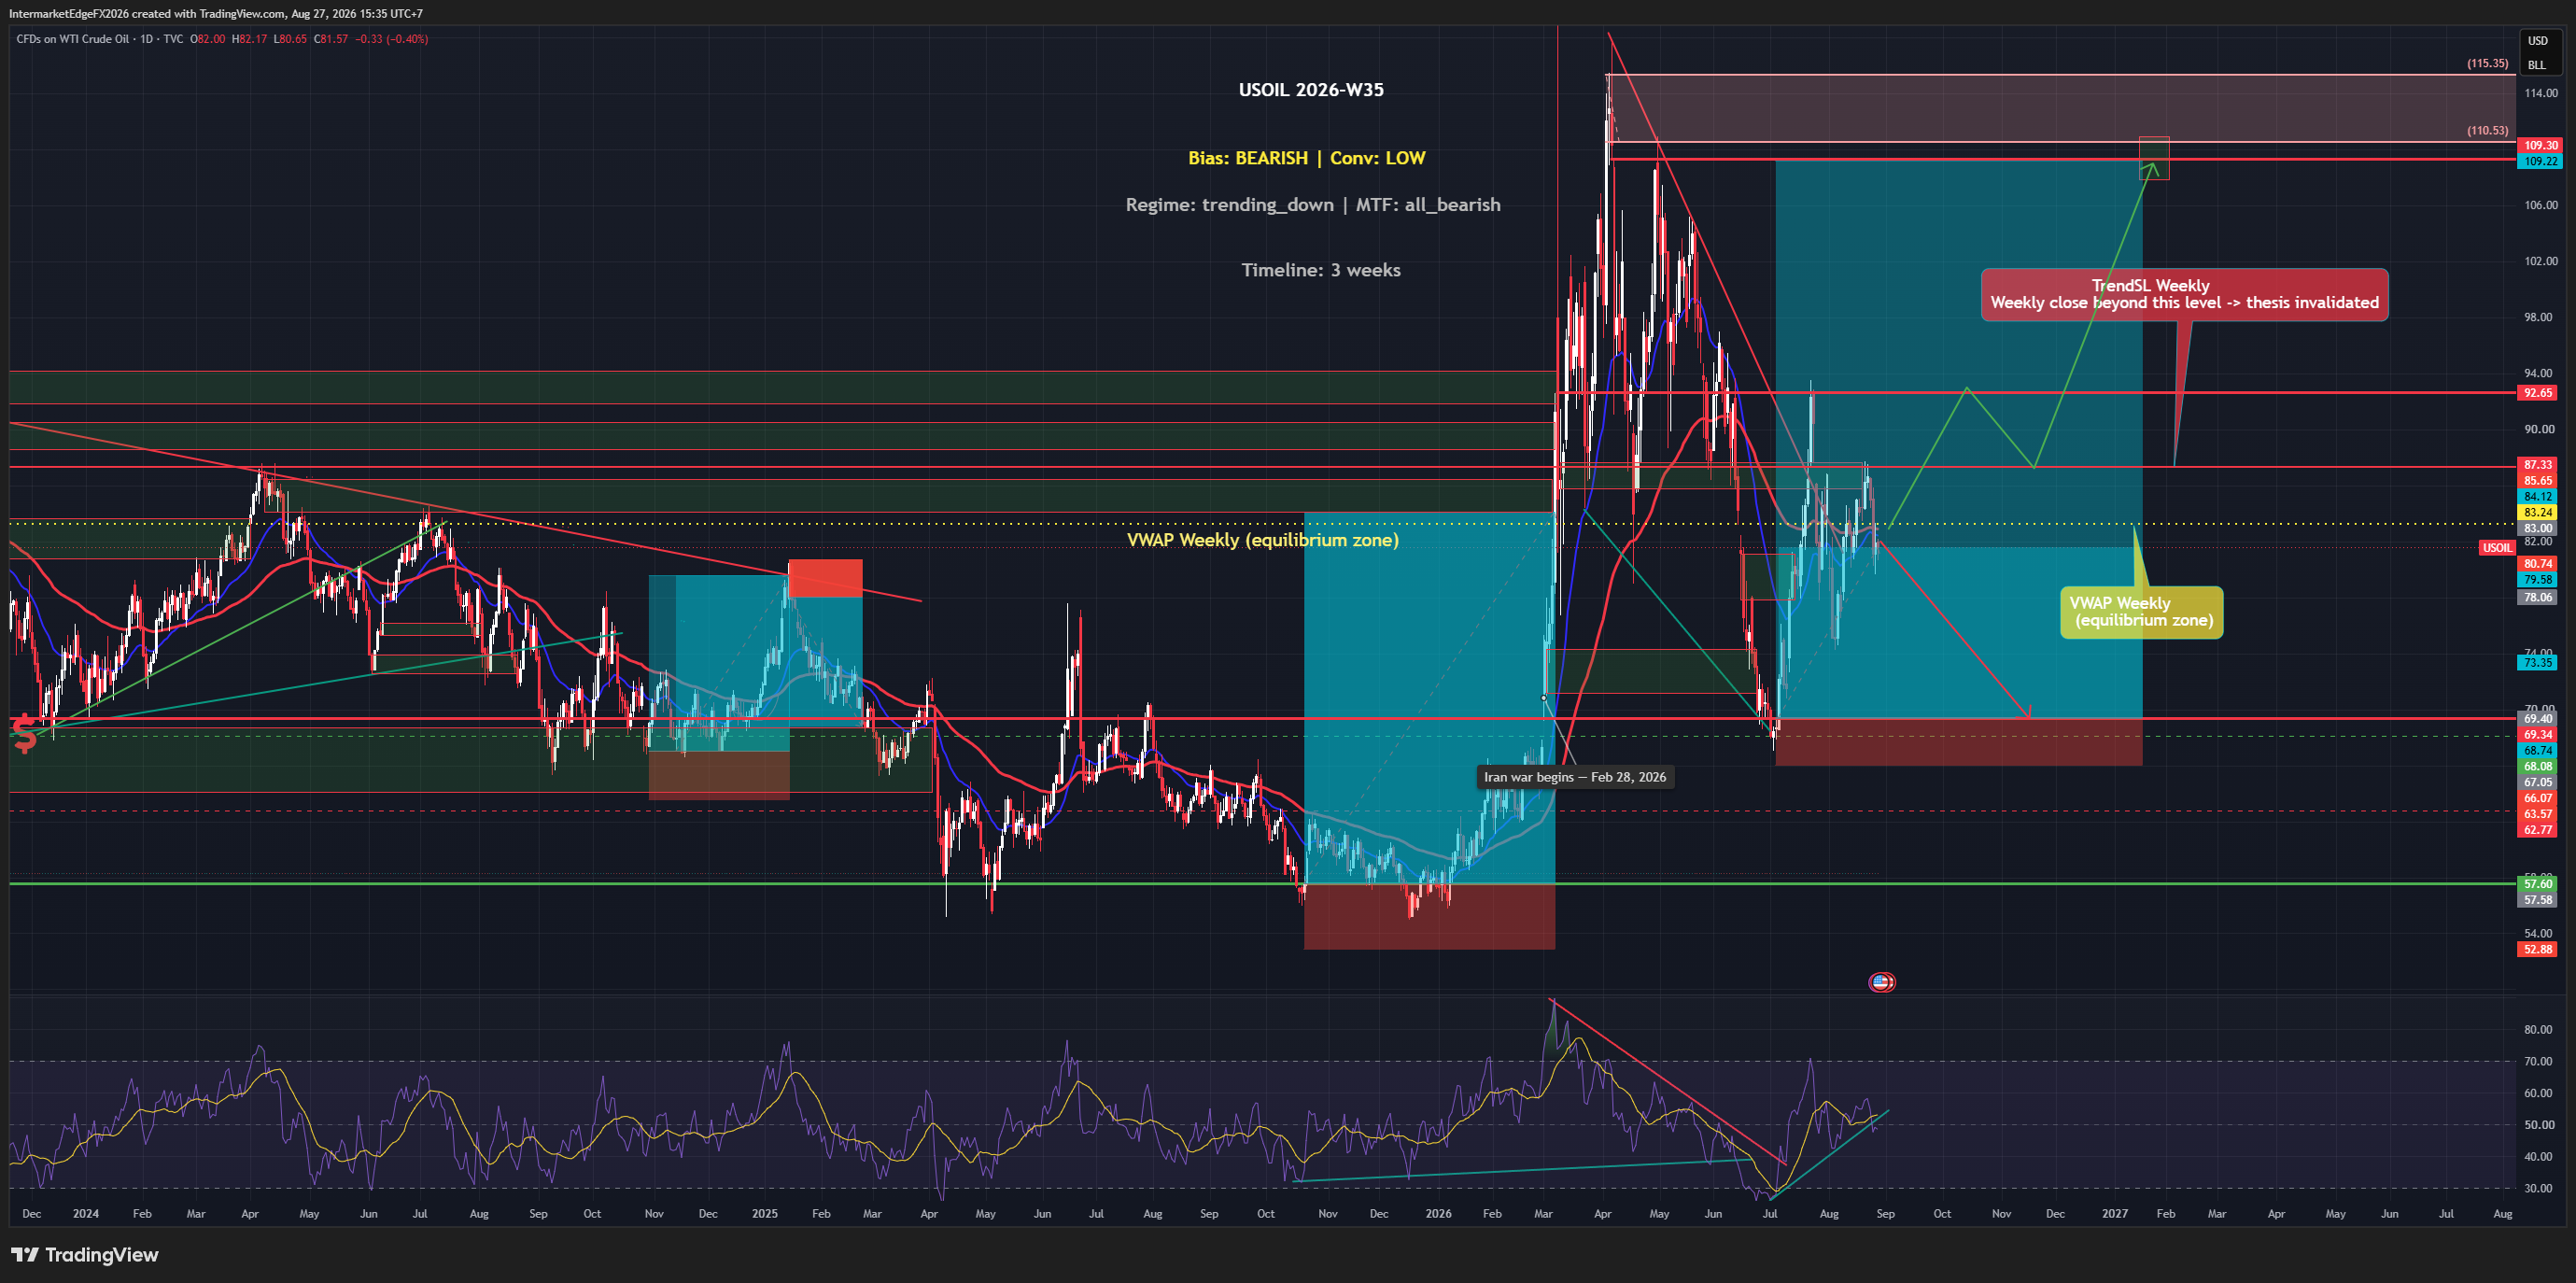
USOIL - SUMMARY 02/07/2026 Regime: High Bear Continues, Supply Narrative in Total Control. USOIL 67.85 (-0.34%), the 67 target from last week's analysis has been hit. Falling channel from the 117.50 war peak remains intact. Bias: High Bear. Core story: 5 consecutive weekly EIA draws totalling -33.3M barrels (1 July: -3.775M vs forecast -2.900M) -- the strongest destocking sequence this year -- and price still fell from 75 to 67.85. When a market ignores the most bullish data available, bulls have lost control. The strongest behavioural bearish signal that exists. Supply narrative: OPEC+ +411kbpd from June, Hormuz flows recovered (OCBC + UBS both cut forecasts), Iran-US talks progressing -- each round another leg lower. Data corrections: EIA -3.775M released (pipeline "awaiting" stale); CPI 4.2% (not 2.4%); real yield +0.28%. D1 structure: 69.34-73.35 support broken. Resistance: 69.34 / 73.35 (channel invalidation). Targets: 63.57 → 62.77 → 57.60 (major support Q4 2025 base -- where OPEC+ fiscal pressure peaks, production-cut intervention likely). Extension: 52.88. Scenarios: downtrend continues to 63.57 (50%); extends to 57.60 (25%); oversold bounce 69-73 then resumes (15%); Iran talks collapse, breakout 73-85 (10%). Event risk: NFP 3 July, EIA 8 July (sixth draw?), OPEC+ communique, Iran talks wildcard. Stops for shorts: above 69.34. For informational purposes only. Not financial advice.

EURJPY - Head & Shoulders Confirmed, DE-JP Spread Collapses to 0.25%, Neckline 181 Is the Trigger for Targets at 177 and 171

EURJPY - Head & Shoulders Confirmed, DE-JP Spread Collapses to 0.25%, Neckline 181 Is the Trigger for Targets at 177 and 171

EURJPY - SUMMARY 01/07/2026 Regime: H&S Confirmed, High Bear. EURJPY 185.058 (-0.35%), Right Shoulder 186.547 rejected, price declining toward neckline 181.018-181.047. Bias: High Bear. Most critical correction: actual DE-JP spread +0.25% (not pipeline's 1.52%). JP10Y 2.70% (not 1.47%), DE10Y 2.95% (not 2.99%). BoJ already hiked to 1.00% (not "Hold"). ECB neutral hold 2.00% (not cutting 2.50%). EUR/JPY carry trade has economically collapsed. Three high-conviction factors: carry collapsed to +0.25%, H&S complete (Head 188.012 / Right Shoulder 186.547 / Neckline 181.018), BoJ hawkish + June TANKAN support today. H&S measured target: neckline 181 → 177 (also Fib 1.618 extension -- confluence). Further support: 175.0-175.5. Invalidation: daily close above 186.547. Scenarios: neckline 181 breaks, wave (c) to 177 (55%); sideways 183-186 (25%); NFP bounce 186-187 then continues (15%); recovery above 186.547 (5%). Do not chase short before neckline 181 breaks. For informational purposes only. Not financial advice.

EURUSD - The 1.140 Zone Is the Decision Point: Rejection Confirms Wave (c) to 1.119, Breakout Challenges the Entire Bearish Structure

EURUSD - The 1.140 Zone Is the Decision Point: Rejection Confirms Wave (c) to 1.119, Breakout Challenges the Entire Bearish Structure

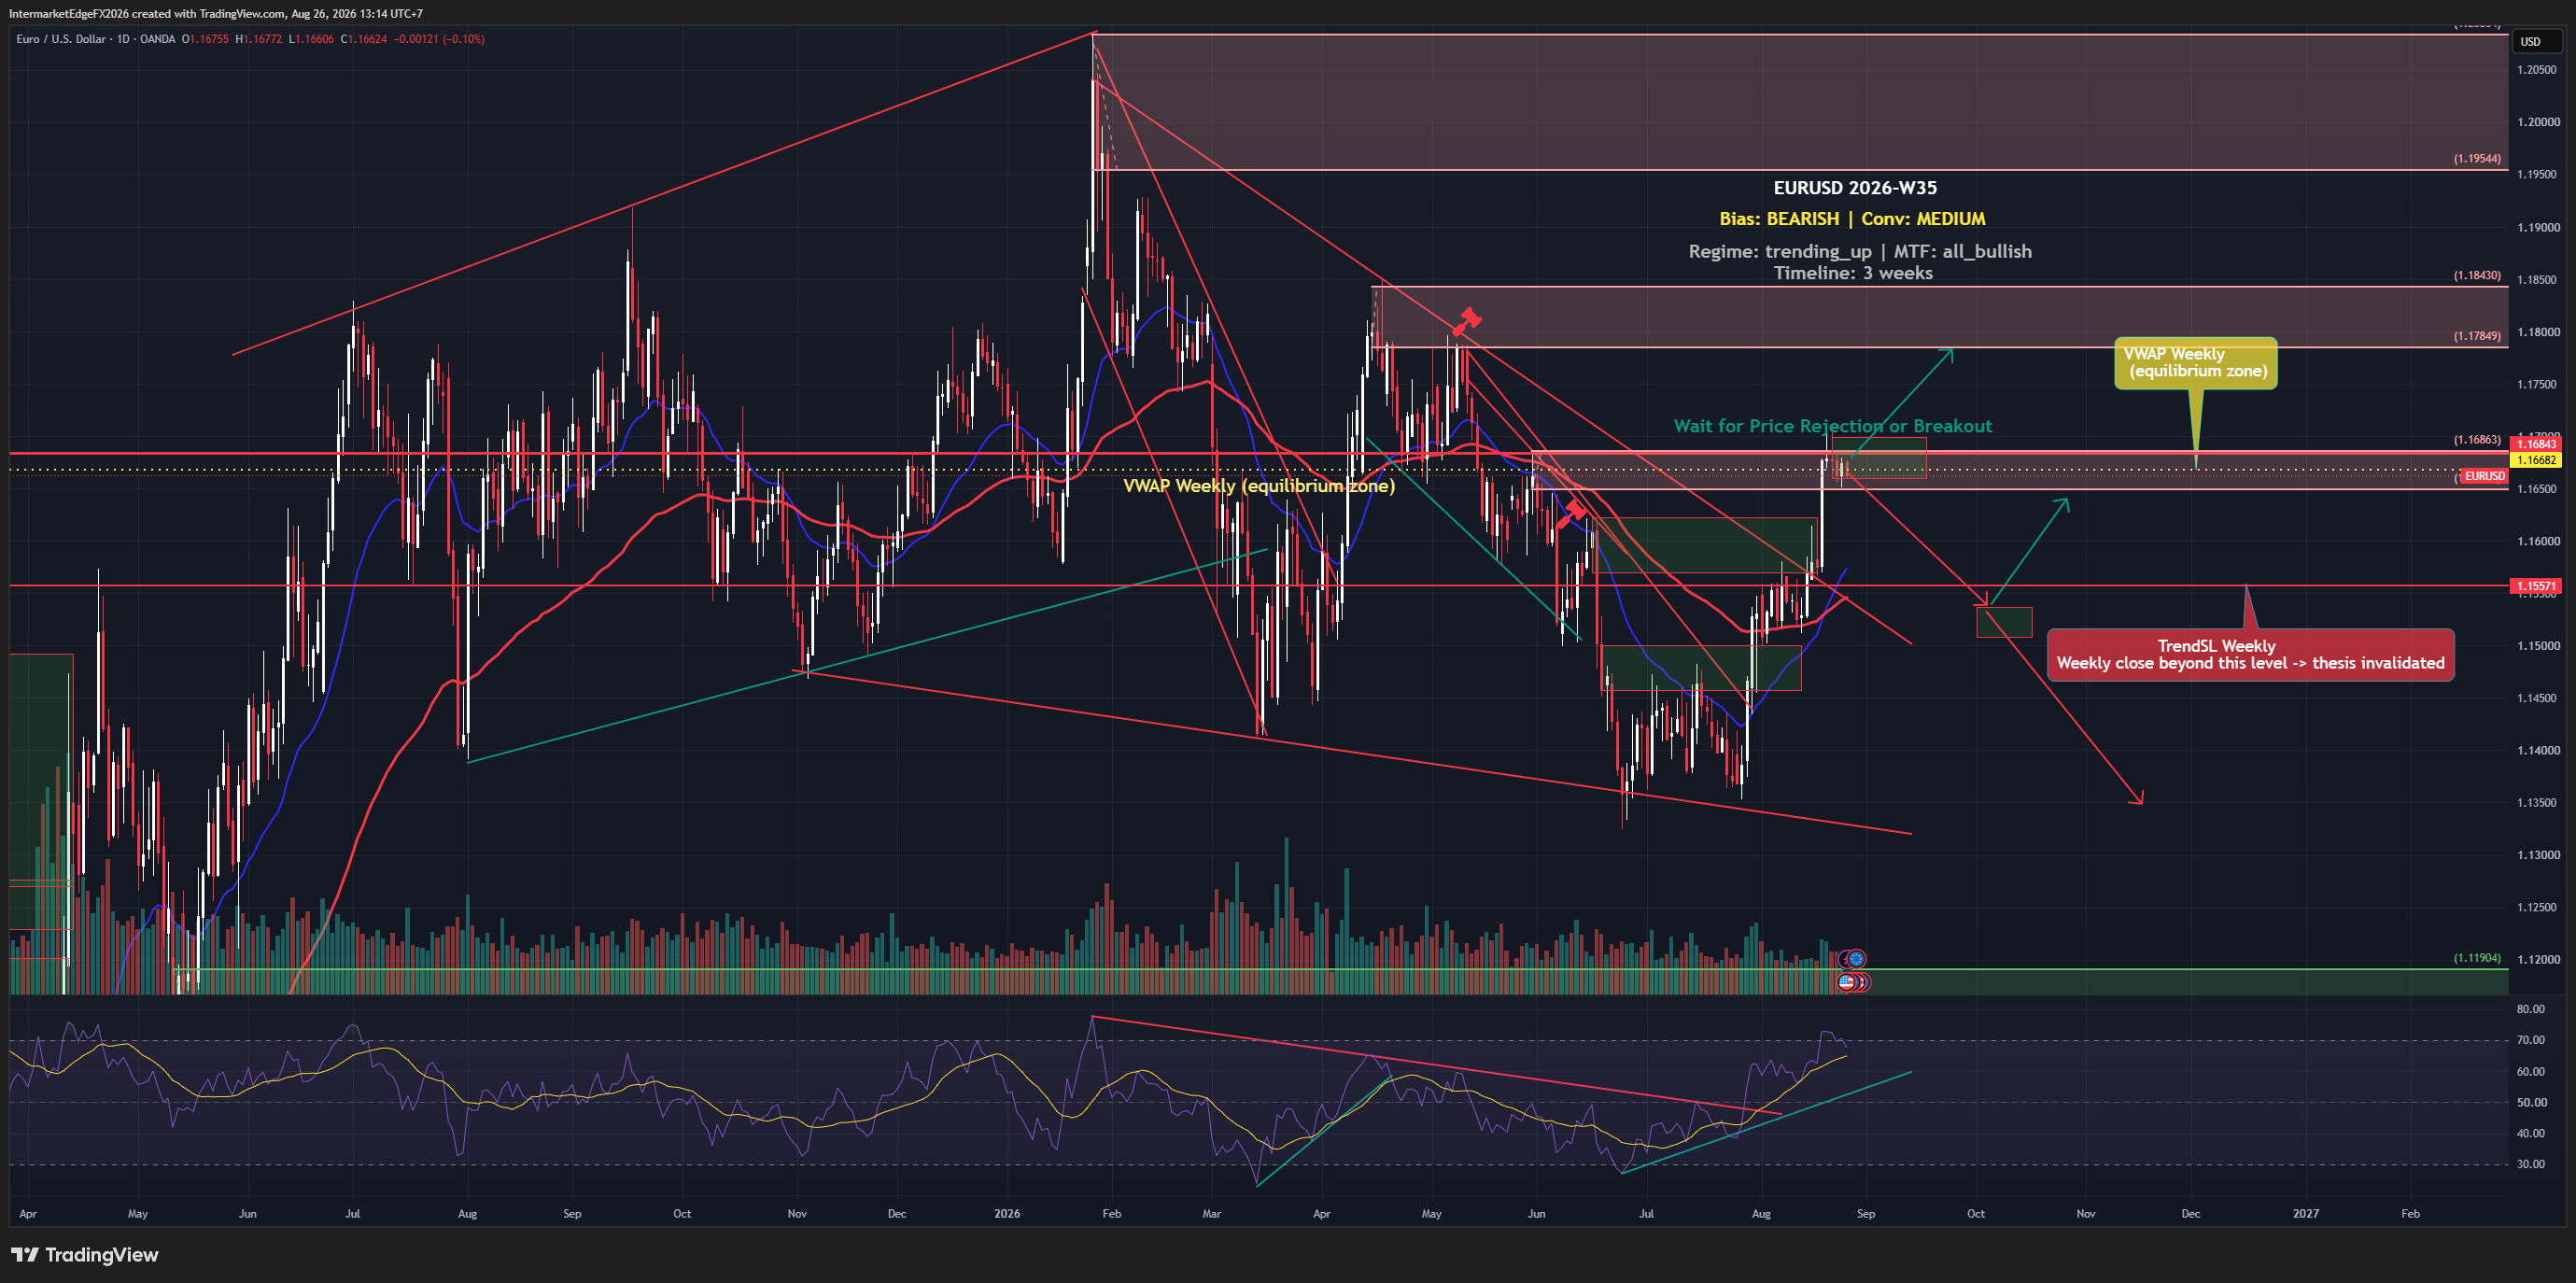
EURUSD - SUMMARY 01/07/2026 Regime: Wave (c) Running, High Bear, Awaiting Confirmation. EURUSD 1.1403 (-0.16%), testing the "Wait for Price Rejection or Breakout" decision zone at 1.138-1.155 on D1. Bias: High Bear -- highest conviction in the 9-instrument pipeline this week. Four high-conviction bearish forces: DE-US spread -1.54% (DE10Y 2.92% vs US10Y 4.46%, carry entirely against EUR), Fed Warsh hawkish + Hammack today "may need higher rates," wave (c) RSI downtrend D1, ECB neutral hold 2.00% (no further dovish room). Data corrections: US CPI 4.2% (not 2.4%); real yield +0.26% (not 2.018%); US2Y 4.17% (not 3.732%); ECB neutral 2.00% (not cutting 2.50%); DE10Y 2.92% (not 2.99%); DE-US spread -1.54% (not -1.428%). D1 structure: wave 5 peak ~1.195 → wave (a) ~1.137 → wave (b) ~1.184 → wave (c) running. Sub-wave 5/(c) inside "Battle Zone" 1.138-1.155. Target: 1.119-1.120. Scenarios: rejection confirmed, wave (c) to 1.119-1.120 (60%); sideways 1.135-1.155 ahead of NFP (20%); NFP miss, bounce 1.157-1.165 (15%); breakout above 1.165 (5%). Trigger: daily close below 1.138 = bearish confirmed. Invalidation: daily close above 1.157. NFP 3 July is the dominant catalyst. For informational purposes only. Not financial advice.

EURGBP - Negative 1.84% Carry Weighs as Wave (c) Targets 0.844, but UK Political Instability Is Testing the Entire Thesis

EURGBP - Negative 1.84% Carry Weighs as Wave (c) Targets 0.844, but UK Political Instability Is Testing the Entire Thesis

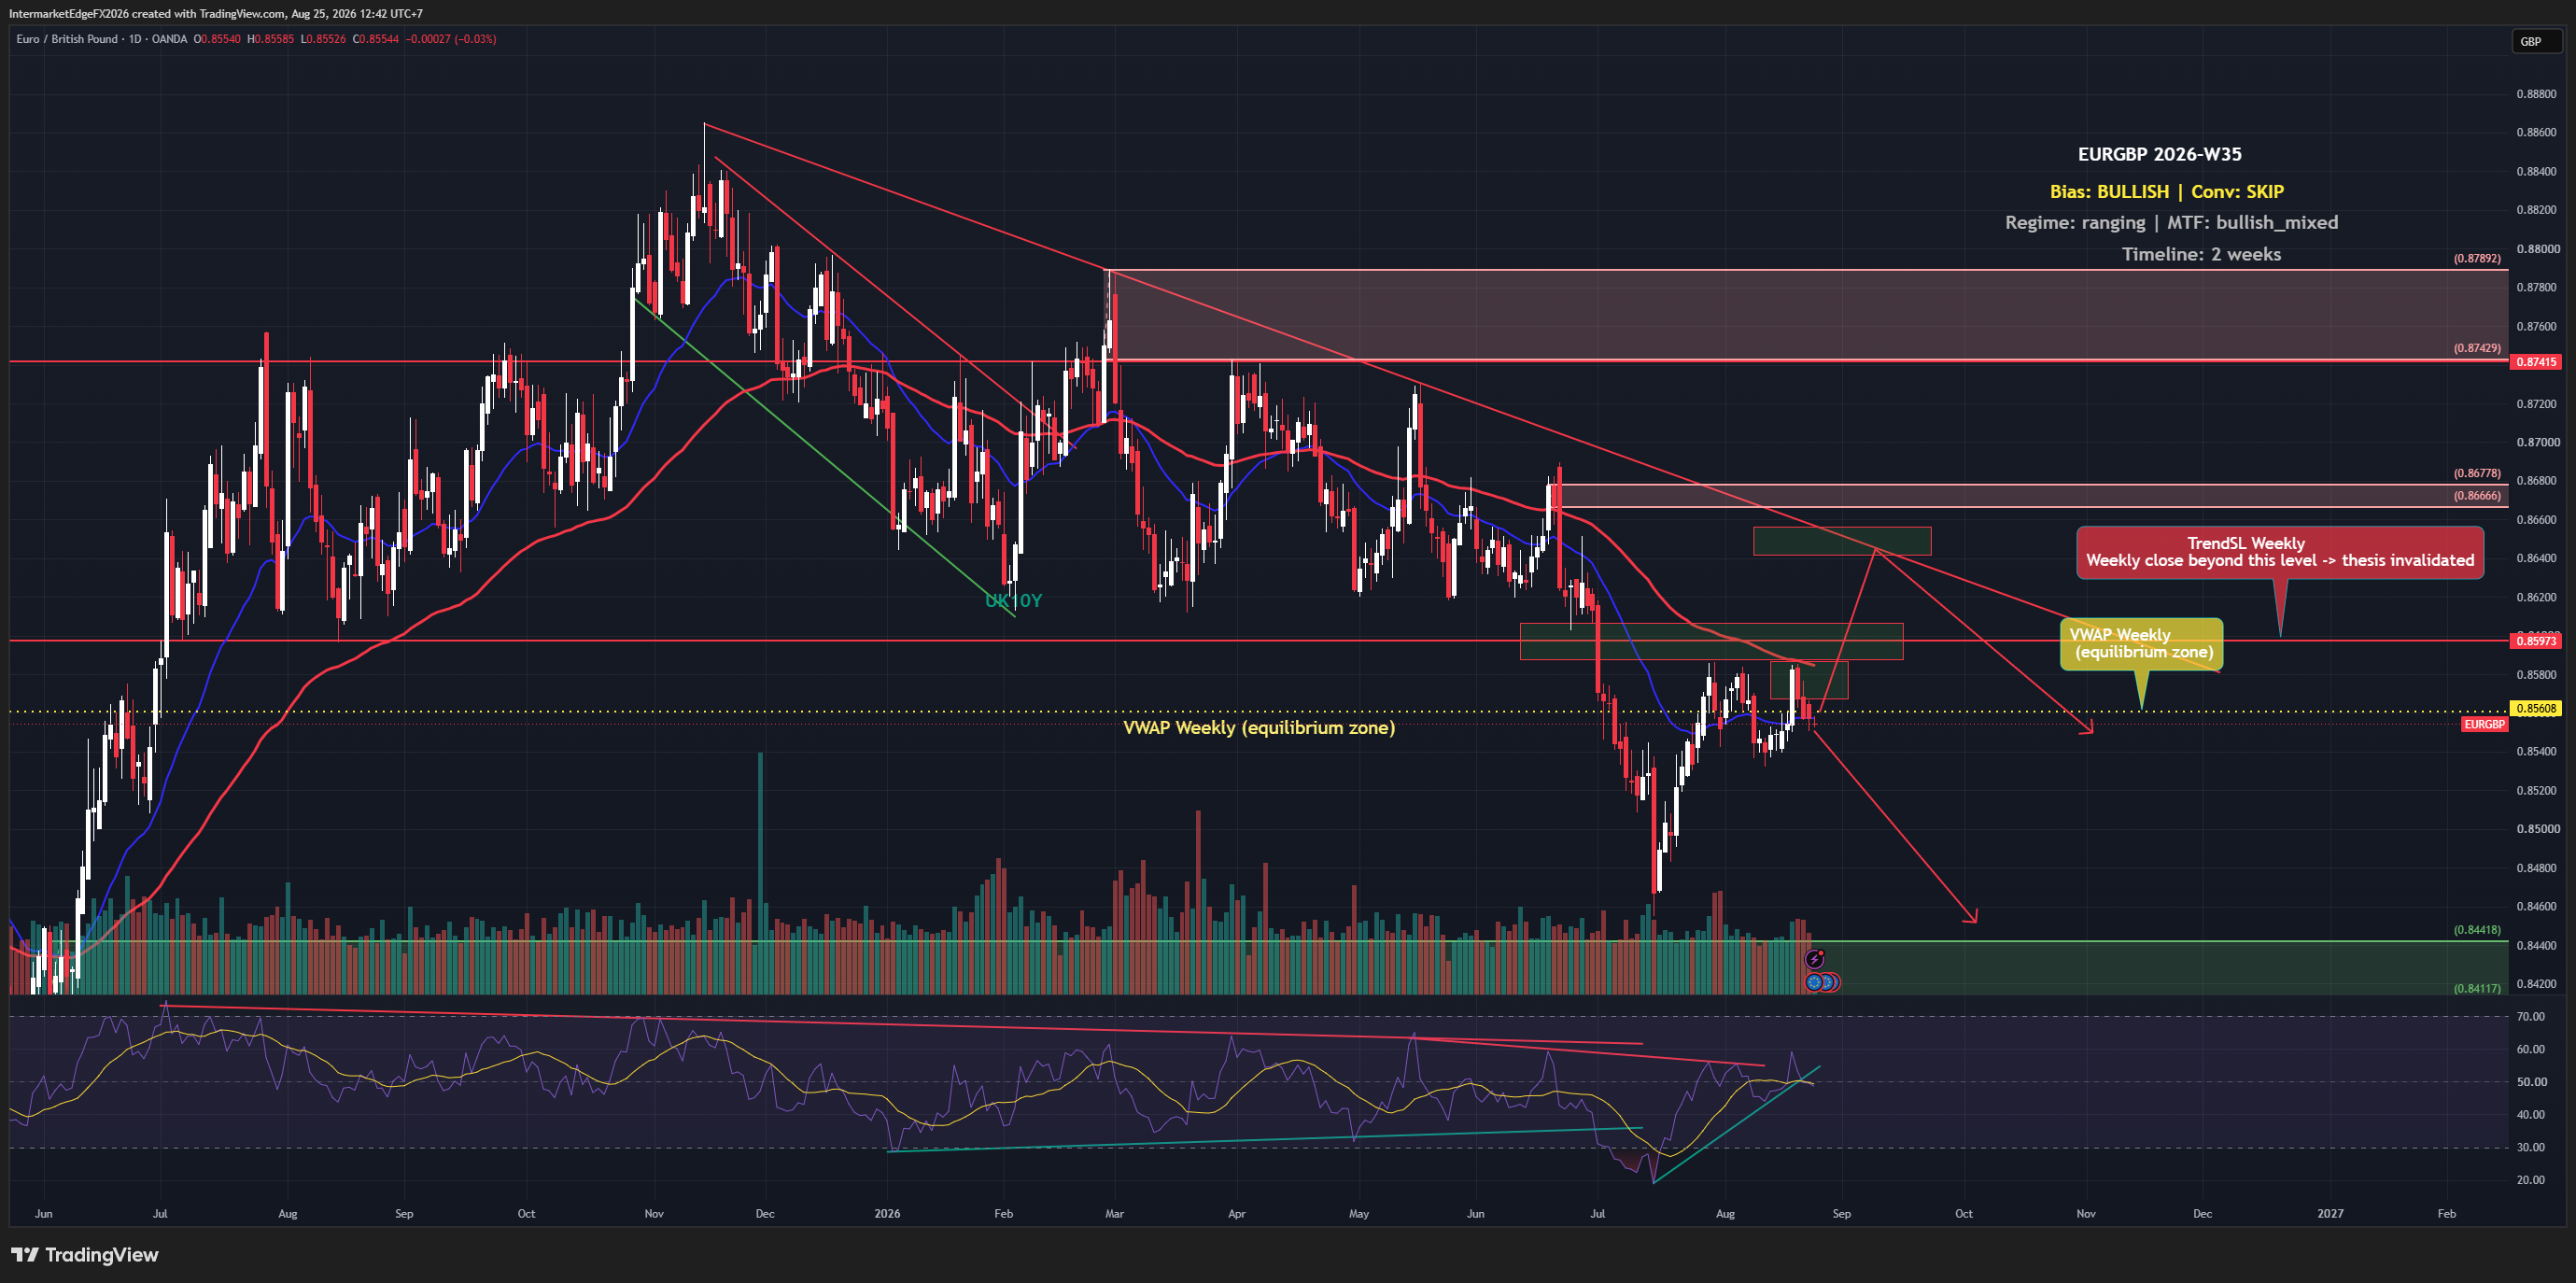
EURGBP - SUMMARY 30/06/2026 Regime: Wave (c) Running Within Downtrend Channel, Medium Bear. EURGBP 0.8622 (+0.08%), within a downtrend channel after wave (b) completed at the ~0.876 peak (coinciding with Lagarde's hawkish Sintra remarks). Wave (c) projects toward 0.844-0.846. Bias: Medium Bear medium term (not High) given UK political risk is a wildcard. Primary driver: DE-GB 10Y carry spread of -1.84% (GB10Y 4.74% vs DE10Y 2.90%) -- one of the clearest differentials in G7, entirely tilted toward GBP. ECB has reached neutral hold at 2.00% (pipeline wrongly reports "cutting 2.50%") -- the most important correction this week, removing a dovish EUR catalyst. But unresolved UK political instability post-Starmer resignation 22 June is an asymmetric risk that could reverse the thesis. Data corrections: ECB neutral 2.00% (not cutting 2.50%); UK10Y 4.74% (not 4.50%); DE10Y 2.90% (not 2.99%). D1 structure: downtrend channel from (b) peak ~0.876. Channel resistance: 0.868-0.870. Support: 0.8611. Wave (c) target: 0.844-0.846. Scenarios: wave (c) continues to 0.844-0.846 (45%); bounce within channel 0.860-0.870 (30%); UK political escalation, channel breaks higher (20%); ECB more hawkish, accelerates (5%). Do not blindly chase shorts on carry alone. Closely monitor UK political news before committing to large positions. For informational purposes only. Not financial advice.

GBPUSD - Technical Bounce After a Sharp Sell-off, but Structure Still Tilts Lower as UK Political Instability Meets Fed Hawkishness

GBPUSD - Technical Bounce After a Sharp Sell-off, but Structure Still Tilts Lower as UK Political Instability Meets Fed Hawkishness

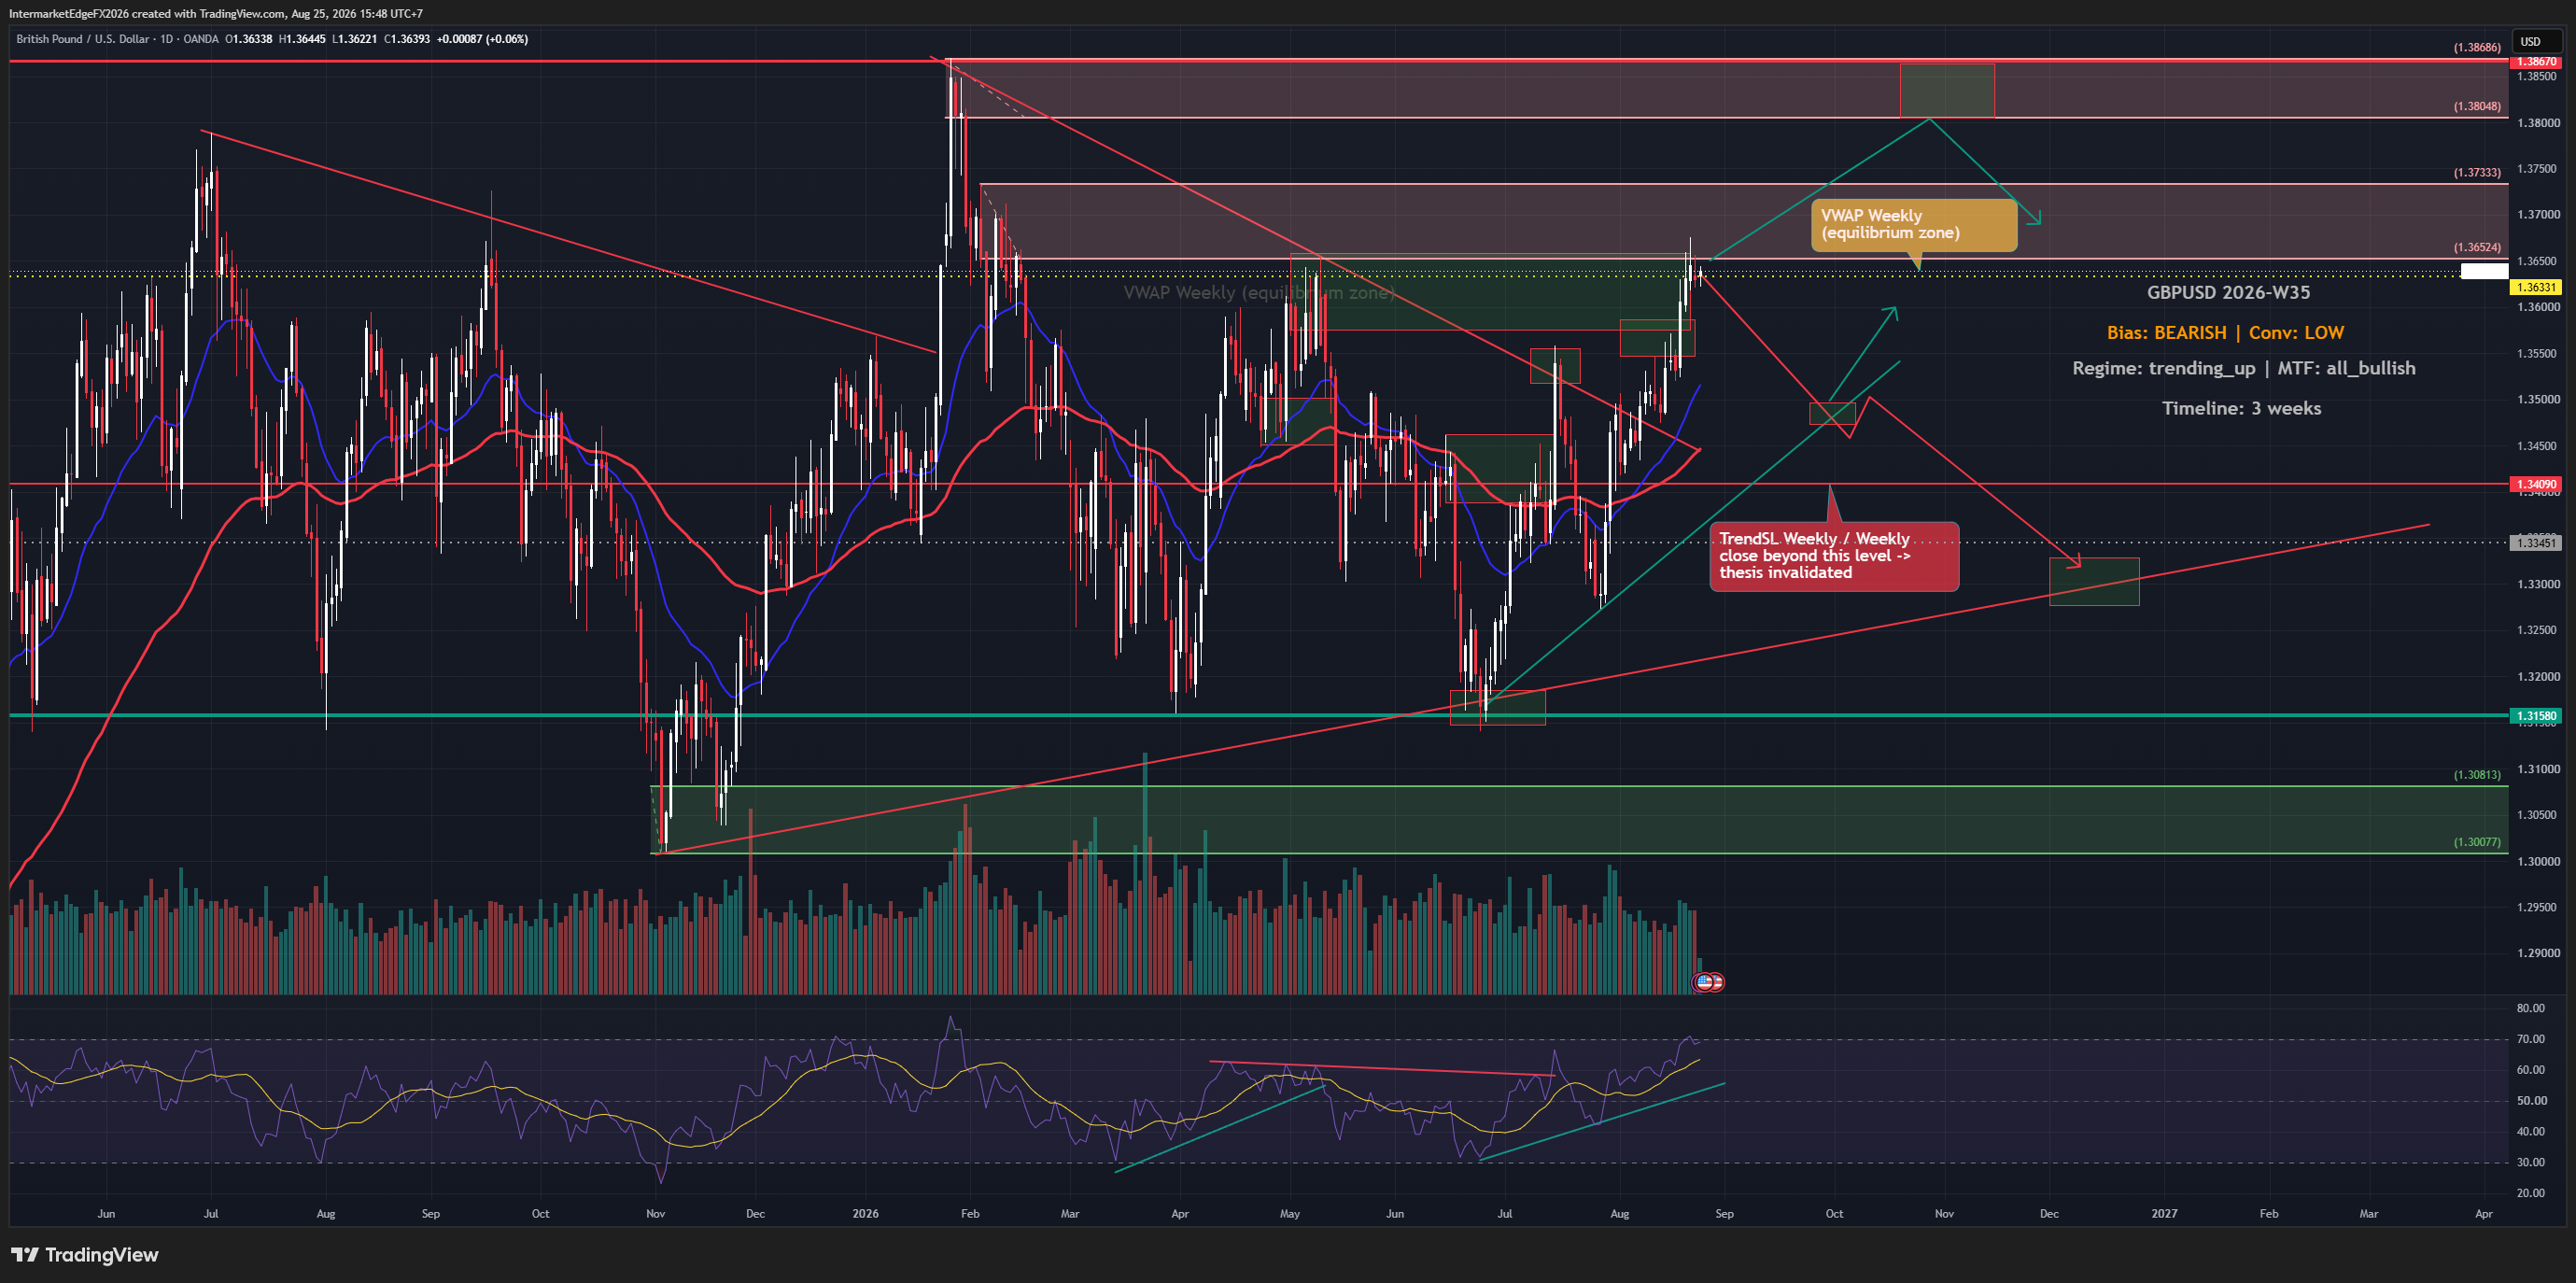
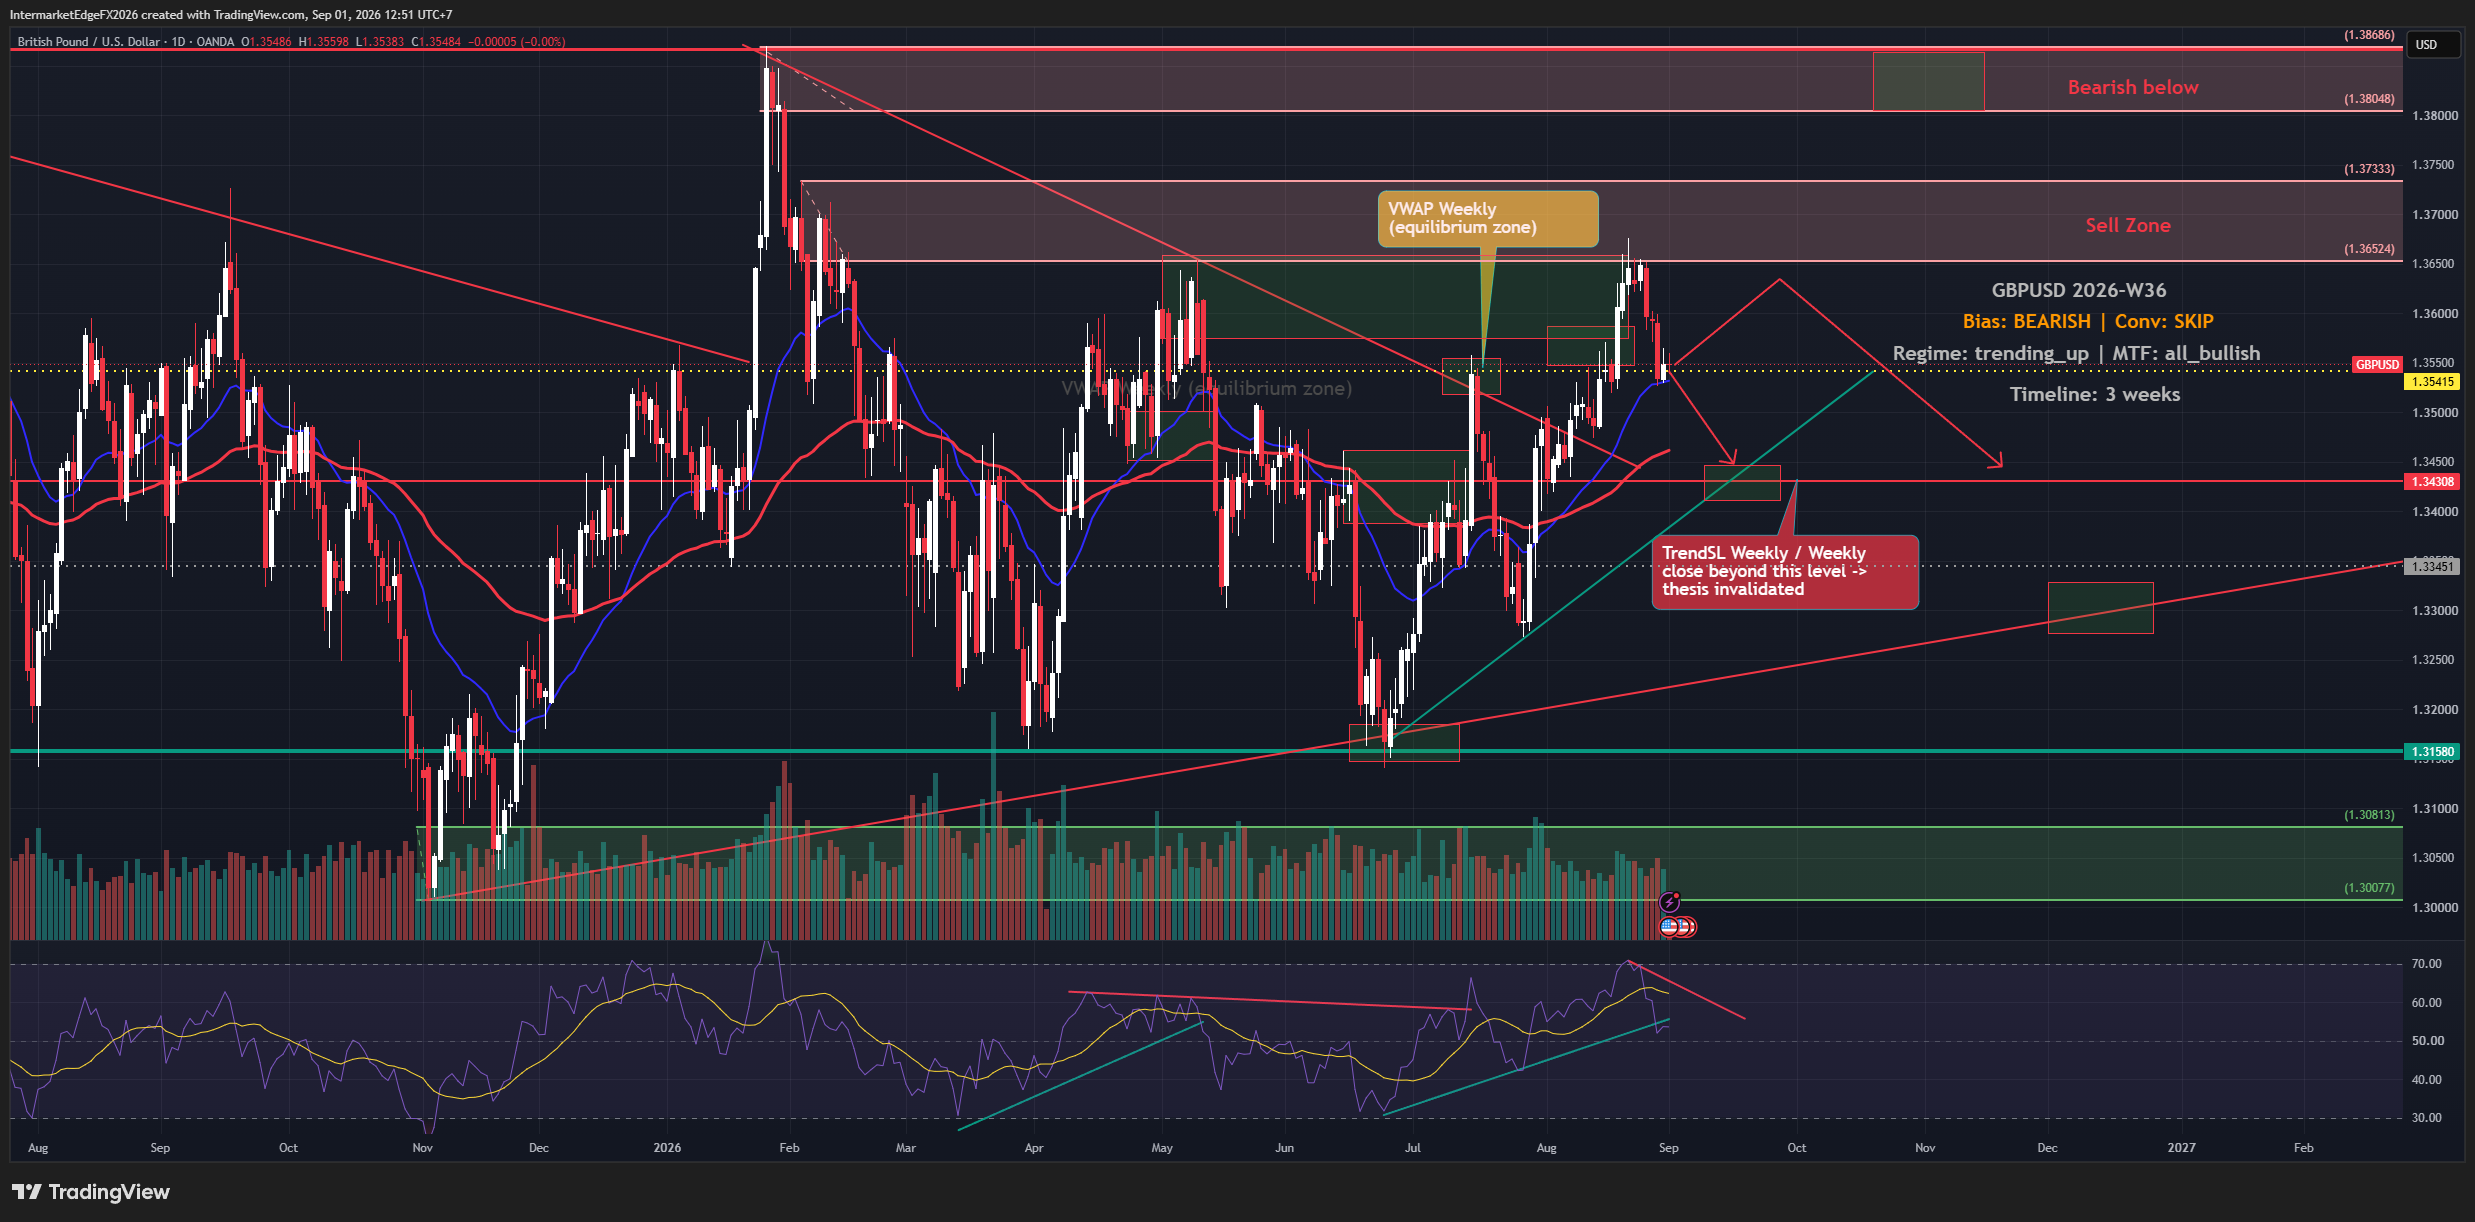
GBPUSD - SUMMARY 30/06/2026 Regime: Technical Bounce, Medium-High Bear Medium Term. GBPUSD 1.3229 (+0.34%), bouncing from the 1.3150-1.3208 support zone after a sharp decline from the wave 3/(b) peak near 1.370. This is a technical reaction at support, not yet a reversal. Bias: Medium-High Bear medium term, neutral within near-term bounce. Two dominant forces: UK political instability post-Starmer resignation 22 June (unresolved), Fed Warsh hawkishness strengthening USD broadly (CPI 4.2%, real yield +0.174%). Actual GB-US 10Y spread of +0.346% (pipeline wrongly reports 0.126%) gives GBP a larger carry advantage than reported, but entirely overwhelmed by political risk premium. Data corrections: US CPI 4.2% (not 2.4%); UK10Y 4.72% (not 4.50%); GB-US spread +0.346% (not 0.126%). D1 structure: converging pattern following the decline from 1.370. Resistance: 1.335-1.340. Support: 1.3150-1.3208 (already bounced). Two-way breakout: above 1.345 or below 1.310-1.315. Scenarios: bounce fails, resumes to 1.300-1.310 (50%); sideways awaiting catalyst (30%); breakout above 1.345 (15%); sharp breakdown below 1.300 (5%). Event risk: UK GDP + Chicago PMI today, NFP 3 July is the dominant weekly catalyst. Do not chase the bounce before the converging pattern breaks clearly. For informational purposes only. Not financial advice.

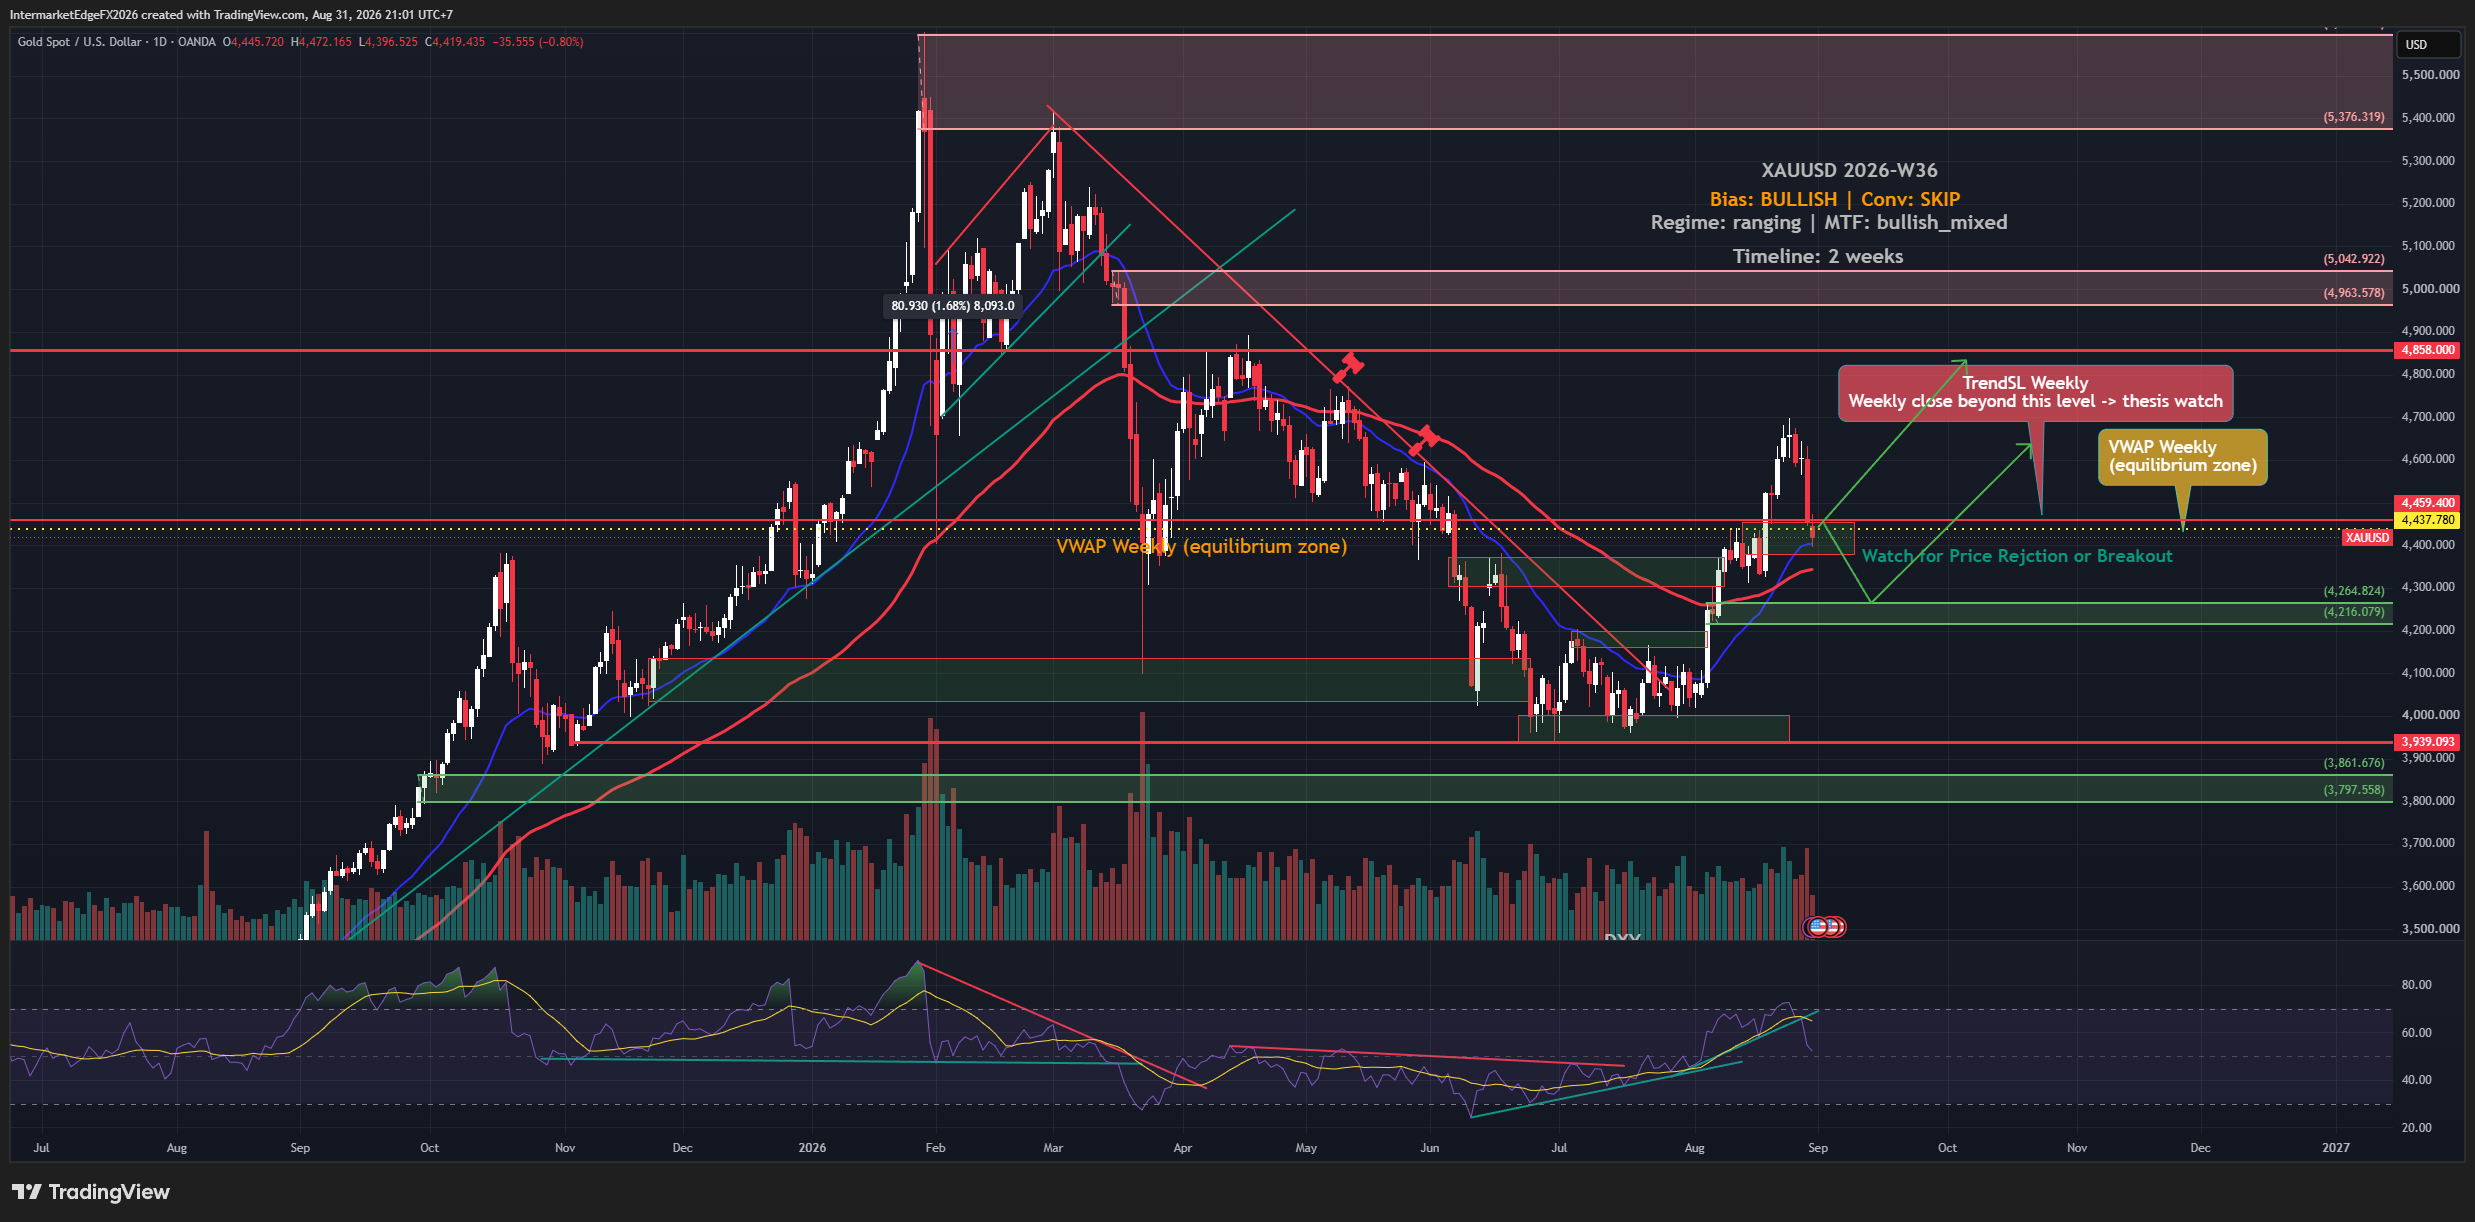
XAUUSD - Wave (4) Running After the 5,100 Peak Confirmed, 4,296 Broken and Price Seeking Its Floor at 3,797-3,881

XAUUSD - Wave (4) Running After the 5,100 Peak Confirmed, 4,296 Broken and Price Seeking Its Floor at 3,797-3,881

XAUUSD - SUMMARY 29/06/2026 Regime: Wave (4) In Progress, Medium Bear. XAUUSD 4,023.995 (-1.57%), the 4,296-4,381 support zone broke this week. Following wave 3 completion at the ~5,100 peak (April 2026), gold is executing a wave (4) structural correction with four forces aligned bearish. Bias: Medium Bear, wave (4) in progress. Four bearish drivers: actual real yield +0.172% (pipeline 1.972% wrong -- uses stale CPI 2.4%; actual 4.2%), Fed Warsh hawkish hold (H2 2026 hike not excluded), DXY structurally bullish (wave (5) targeting 103-104, inverse relationship with gold active), risk-on SPX +0.68% VIX 18.7 (reduced safe-haven demand). XAGUSD -1.68% declining faster than gold confirms structural bearish trend. Data corrections: CPI 4.2% (not 2.4%); real yield +0.172% (not 1.972%); JP10Y 2.63% (not 1.47%); ECB neutral 2.00% (not cutting 2.50%). D1 structure: 4,296-4,381 broken, flipped to resistance. Wave (4) target: 3,881 (Fib 0.382) then 3,797. RSI ~34 near oversold may generate technical bounce toward 4,100-4,200 without altering structure. Extended wave (4): 3,500-3,600. Invalidation: daily close above 4,296. Hard invalidation: below 2,997. Scenarios: wave (4) continues to 3,797-3,881 (55%); bounce to 4,100-4,200 then resumes (25%); NFP miss + geopolitical spike reclaims 4,296 (15%); extended to 3,500-3,600 (5%). Do not buy the dip before NFP 3 July. Wait for reversal signals at 3,797-3,881. For informational purposes only. Not financial advice.

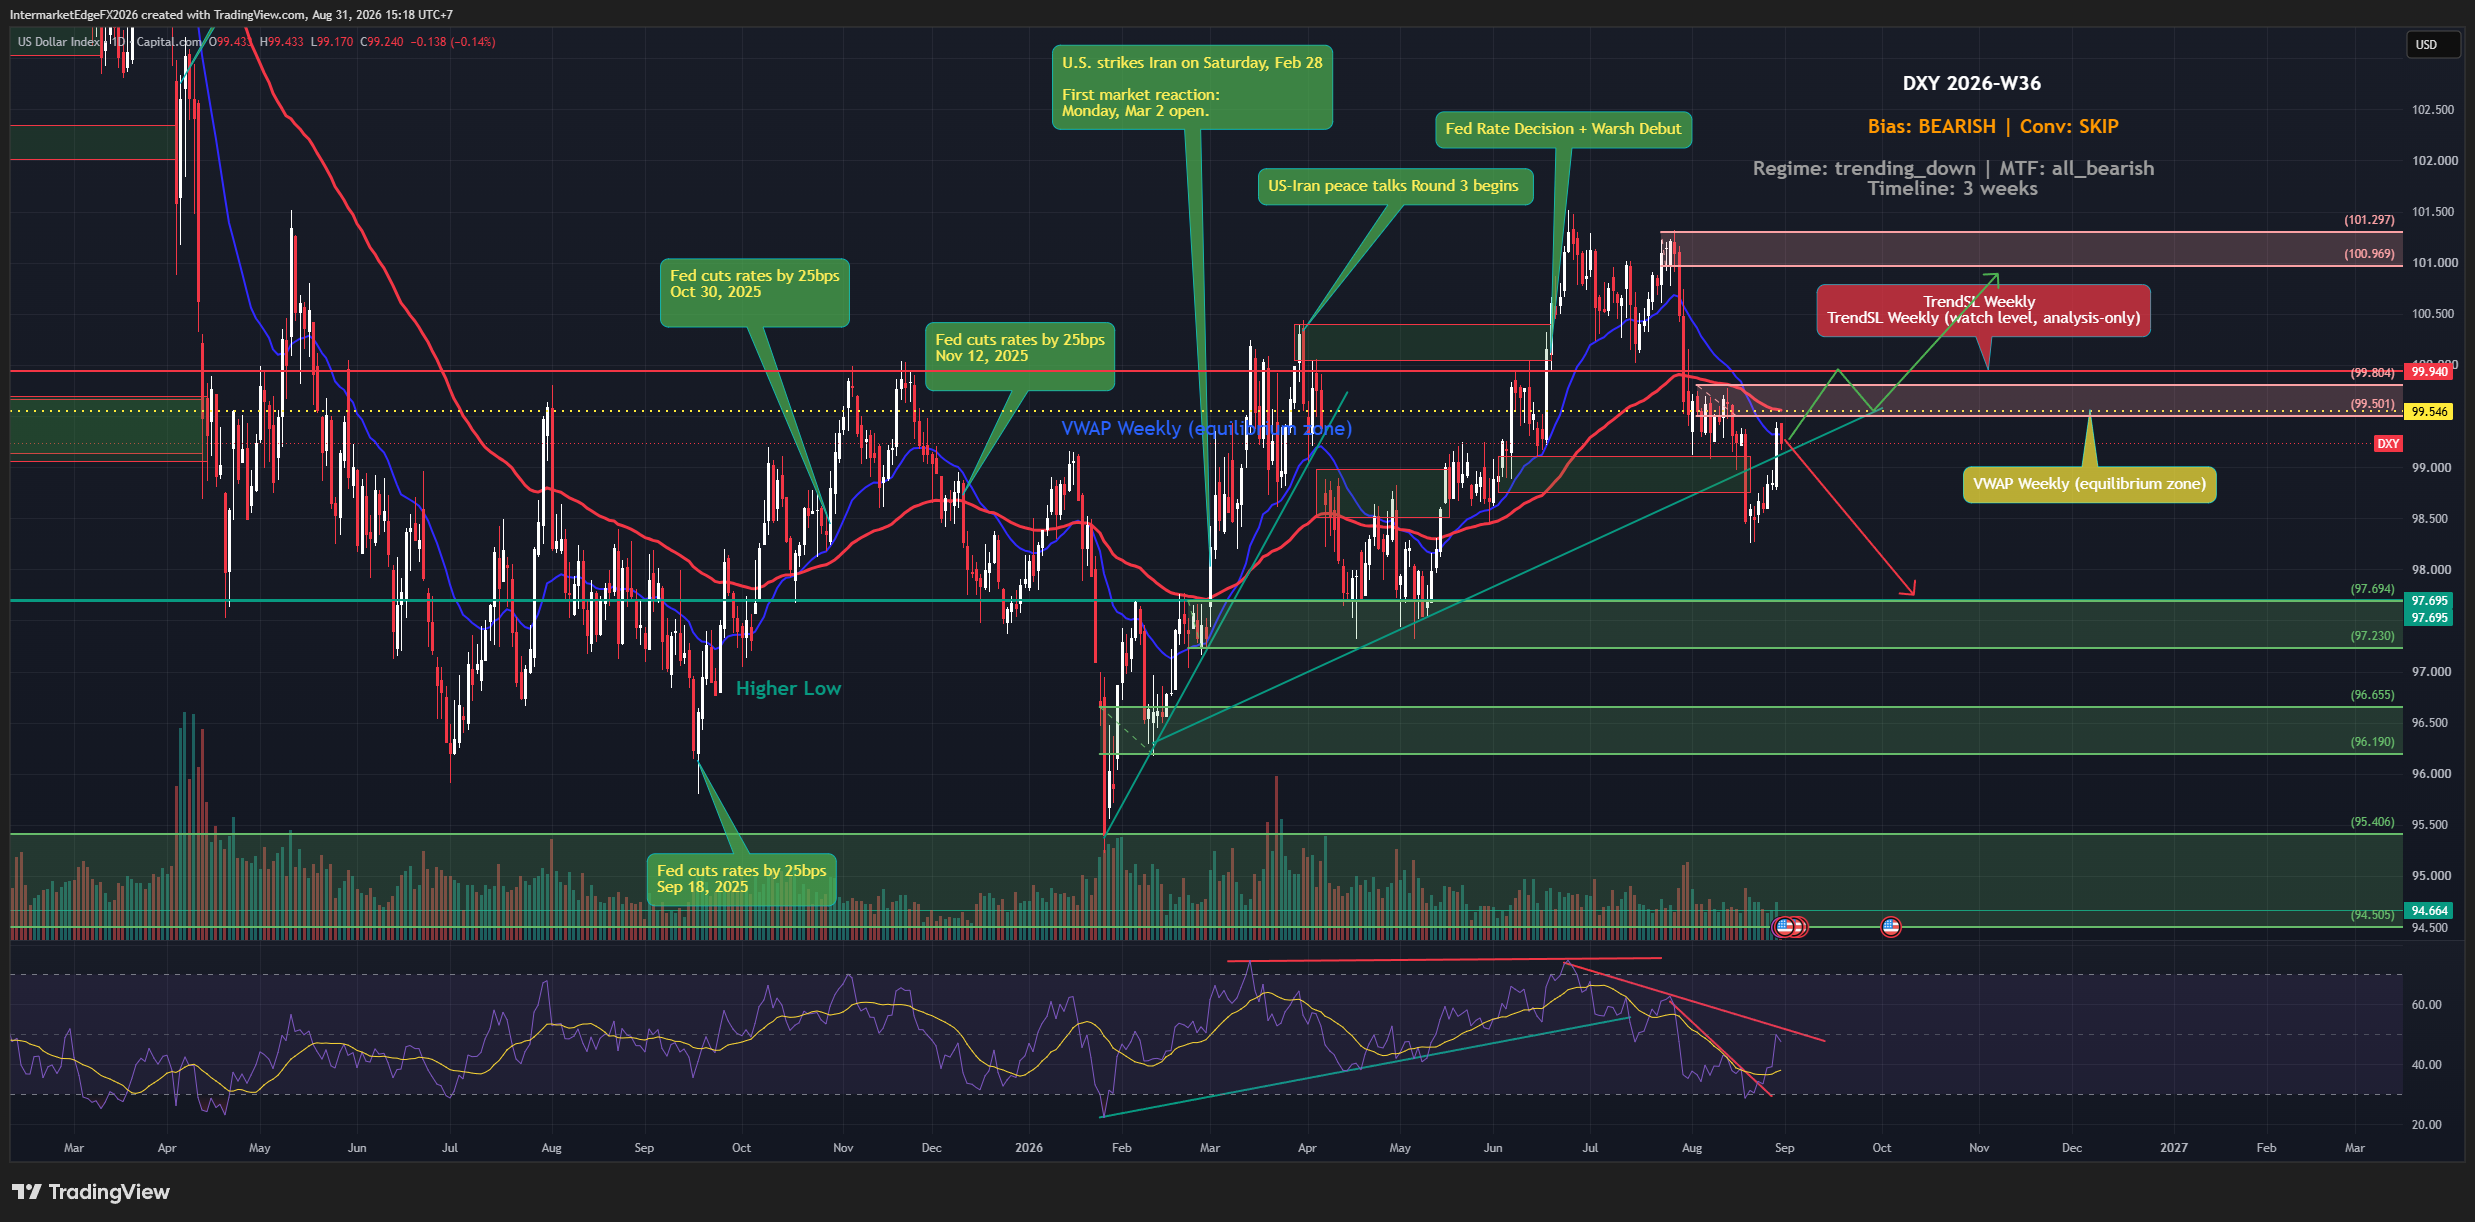
DXY - Wave (4) Absorbing After Completing a 13-Month High, NFP on 3 July Is the Decisive Catalyst for Wave (5)

DXY - Wave (4) Absorbing After Completing a 13-Month High, NFP on 3 July Is the Decisive Catalyst for Wave (5)

DXY - SUMMARY 29/06/2026 Regime: Wave (4) Absorbing, Neutral Near Term, Bullish Medium Term. DXY 101.019, pulled back from wave (3) high at 104.2 -- a 13-month high -- to 100.6 last week then bounced modestly to 101.0. Elliott five-wave structure intact. Declining volume in the pullback confirms correction, not reversal. Bias: Medium-High Bull medium term. Neutral within current wave (4). Macro foundation: US CPI actual 4.2% (pipeline 2.4% stale), Fed Warsh hawkish hold, rate differential +225bps vs EUR (ECB 2.00% neutral hold), +325bps vs JPY (BoJ 1.00%). US10Y 4.372%, yield curve steepening +27bps, real yield +0.172%. Data corrections: JP10Y 2.63% (not 1.47%); US-JP spread 1.742% (not 2.924%); DE10Y 2.85% (not 2.99%); ECB neutral 2.00% (not cutting 2.50%). D1 structure: wave (4) absorption zone 99.6 (Fib 0.382) to 99.1 (Fib 0.5). Resistance: 101.5 / 102.0 / 102.5. Support: 100.48 (Higher Low) / 99.6 / 99.1 / 98.0. Wave (5) target 103-104.5. Extended: 106. Invalidation: 97.695. Scenarios: test 99.6-99.1 then wave (5) 103-104.5 (60%); low already printed at 100.6, break of 102.0 = early wave (5) (30%); NFP miss, below 98 (10%). Event risk: Chicago PMI 30 June, ADP 1 July, NFP 3 July -- decisive catalyst. Above 220K = early wave (5) trigger. Do not chase before NFP. For informational purposes only. Not financial advice.

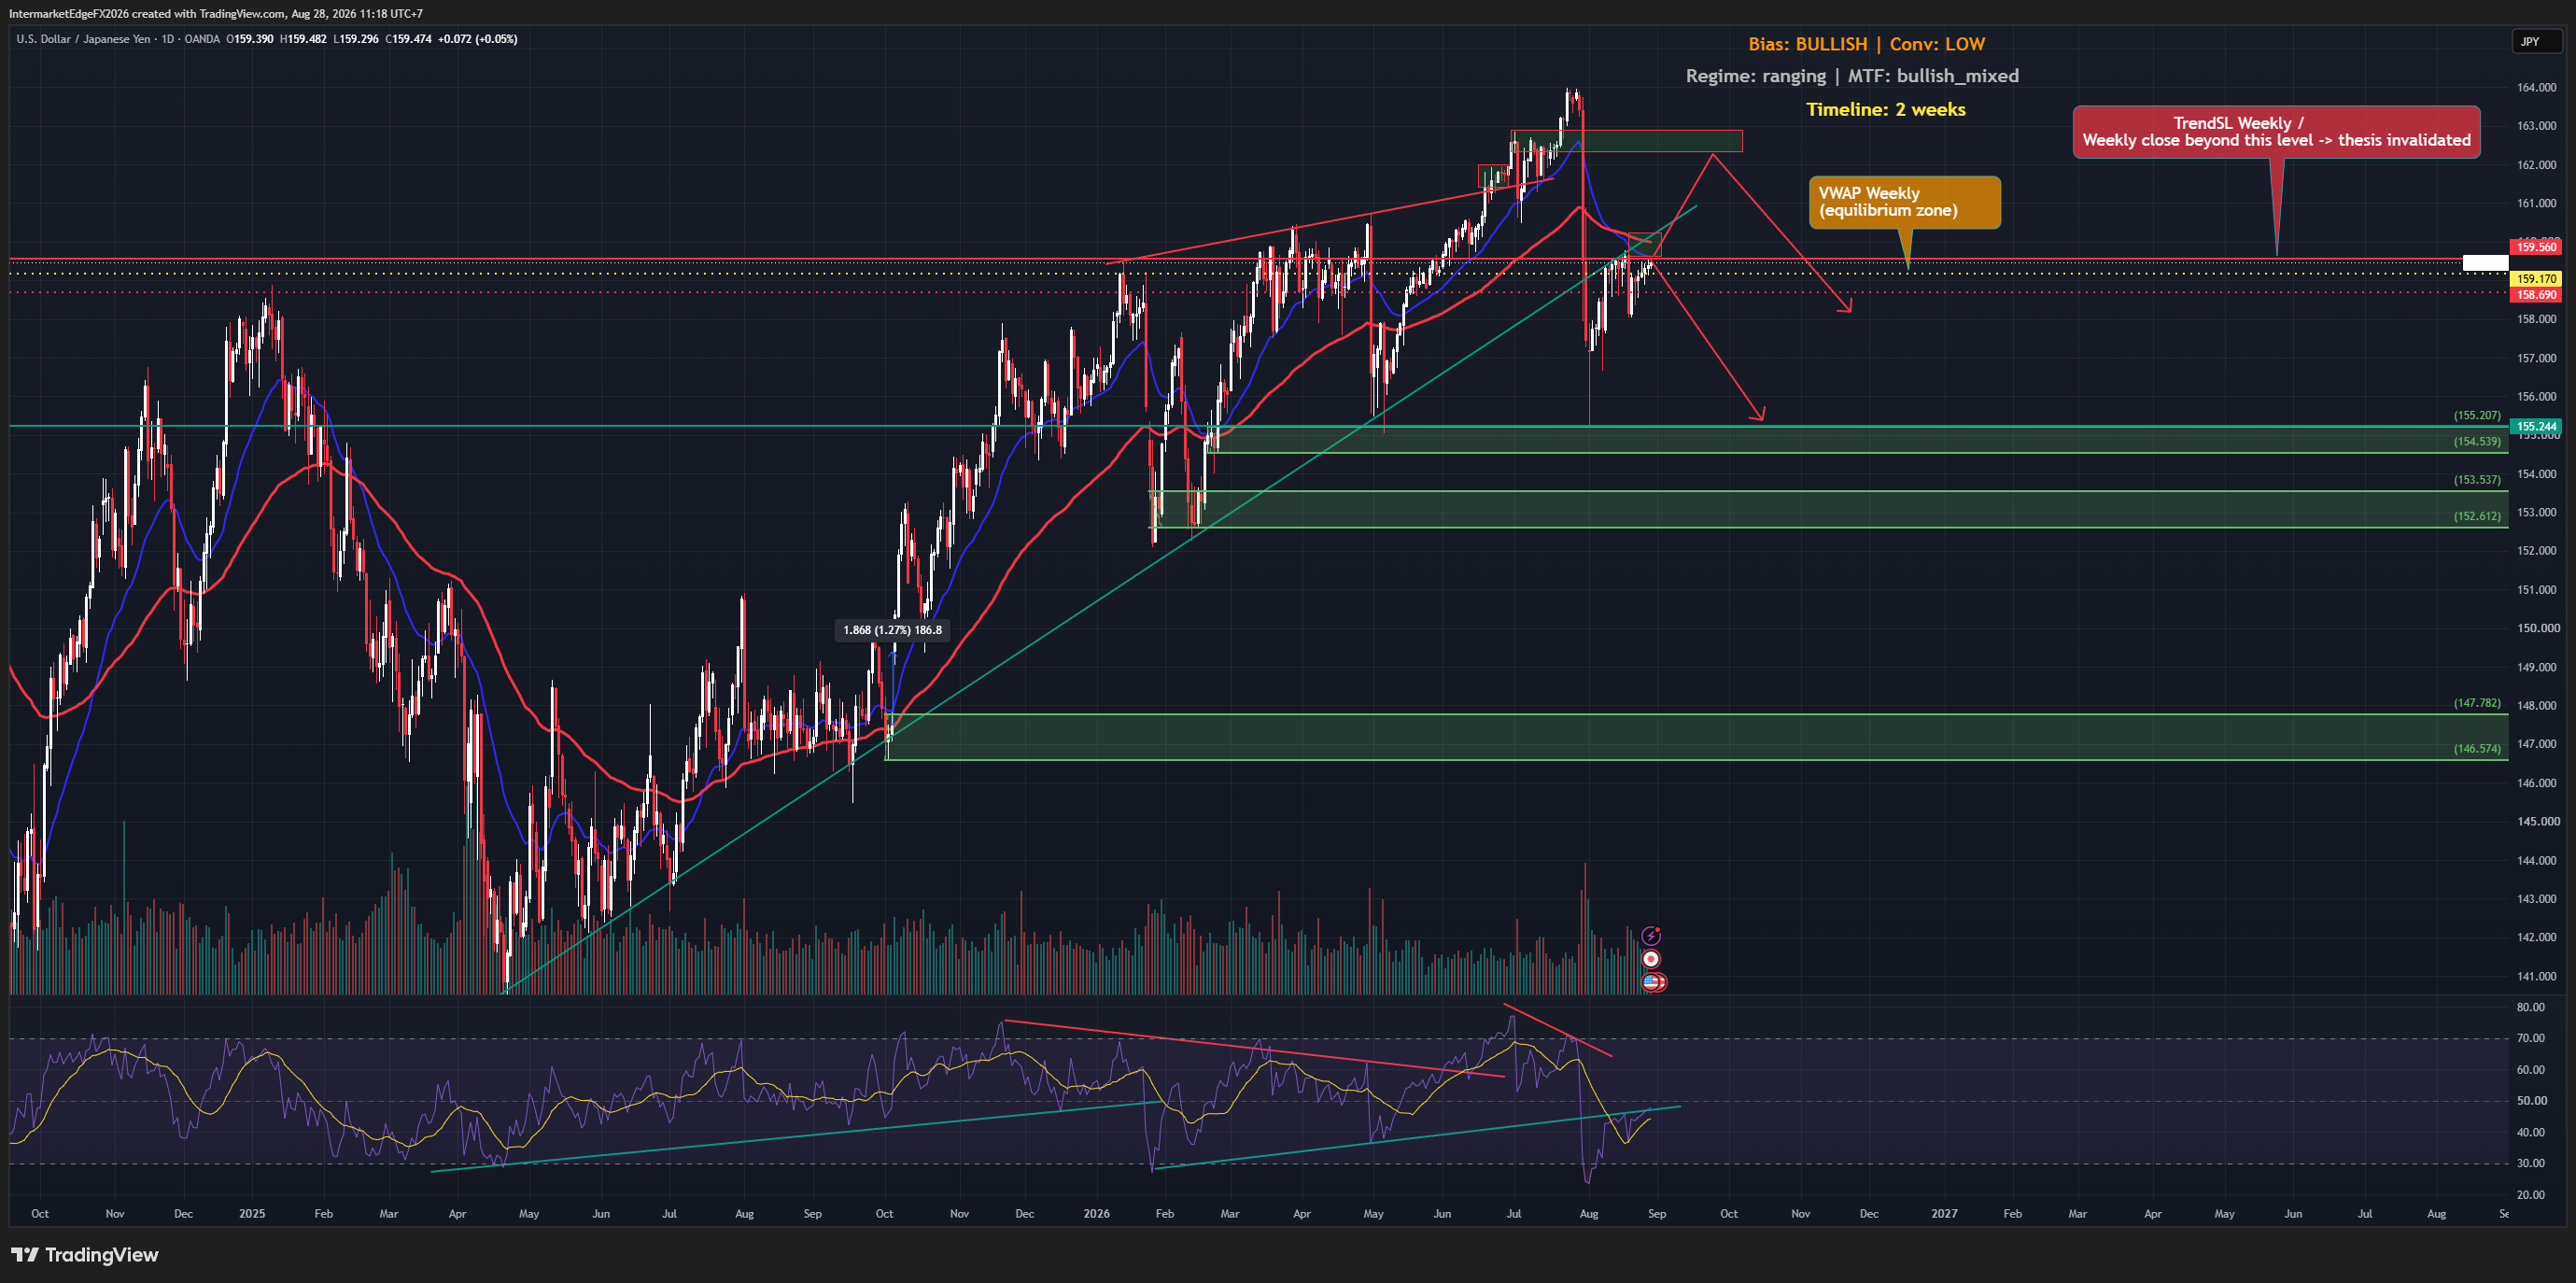
USDJPY - Wave (5) Exhaustion Confirmed as Price Failed to Break 161.94 for an Entire Week, Tokyo CPI Beat Gives the BoJ More Ammunition

USDJPY - Wave (5) Exhaustion Confirmed as Price Failed to Break 161.94 for an Entire Week, Tokyo CPI Beat Gives the BoJ More Ammunition

USDJPY 161.651 | Wave (5) exhaustion confirmed, Tokyo CPI beats | 26 June 2026 Last week: "Wave (5) exhaustion at the intervention ceiling, expect correction to 155-157." One week later: price stood at 161.6, unable to break 161.94 despite DXY at a 13-month high. Exhaustion is no longer speculation. Then Tokyo CPI June released today. Core-core 1.9% y/y, beat 1.8% forecast, up from 1.6%. The BoJ has fresh ammunition to hike again. Yen-supportive. DXY pulled back from 101.5 to 100.6. VIX jumped to 20.20 (+7.1%). Risk-off intensifying, carry-unwind pressure. Pipeline showed wrong numbers. JP10Y: 1.47% (actual 2.600%). US-JP spread: 2.924% (actual 1.790%). BoJ: "Hold" (actual: hiked to 1.00%). D1 structure: wave (5) at the 161.94 ceiling, failed to break after one full week. Correction targets: 158.953 (0.382), 155.244 (0.5), 153.5 (0.618). Extension if breaks 161.94: 164. Invalidation: below 152. Three scenarios: → Correction (a)(b)(c) to 155-157. Probability: 40% → MOF intervention, sharp drop to 155 then 152. Probability: 25% → DXY bounces, breaks 161.94, extension to 164. Probability: 20% The tell: one week at the ceiling, it didn't break. Then the BoJ's data came in hot. Exhaustion confirmed. Conviction: Medium Bear near-term (shifted from Med Bull correction lean). --- Intermarket Edge | Institutional Macro & Intermarket Analysis For informational purposes only. Not financial advice.

InterMarketEdge

© 2026 InterMarketEdge. Financial intelligence for inter-market traders.