Geopolitical Watch SLUG — InterMarketEdge

Geopolitical Watch SLUG

Geopolitical events driving markets — Iran war, tariff developments, and supply chain disruptions

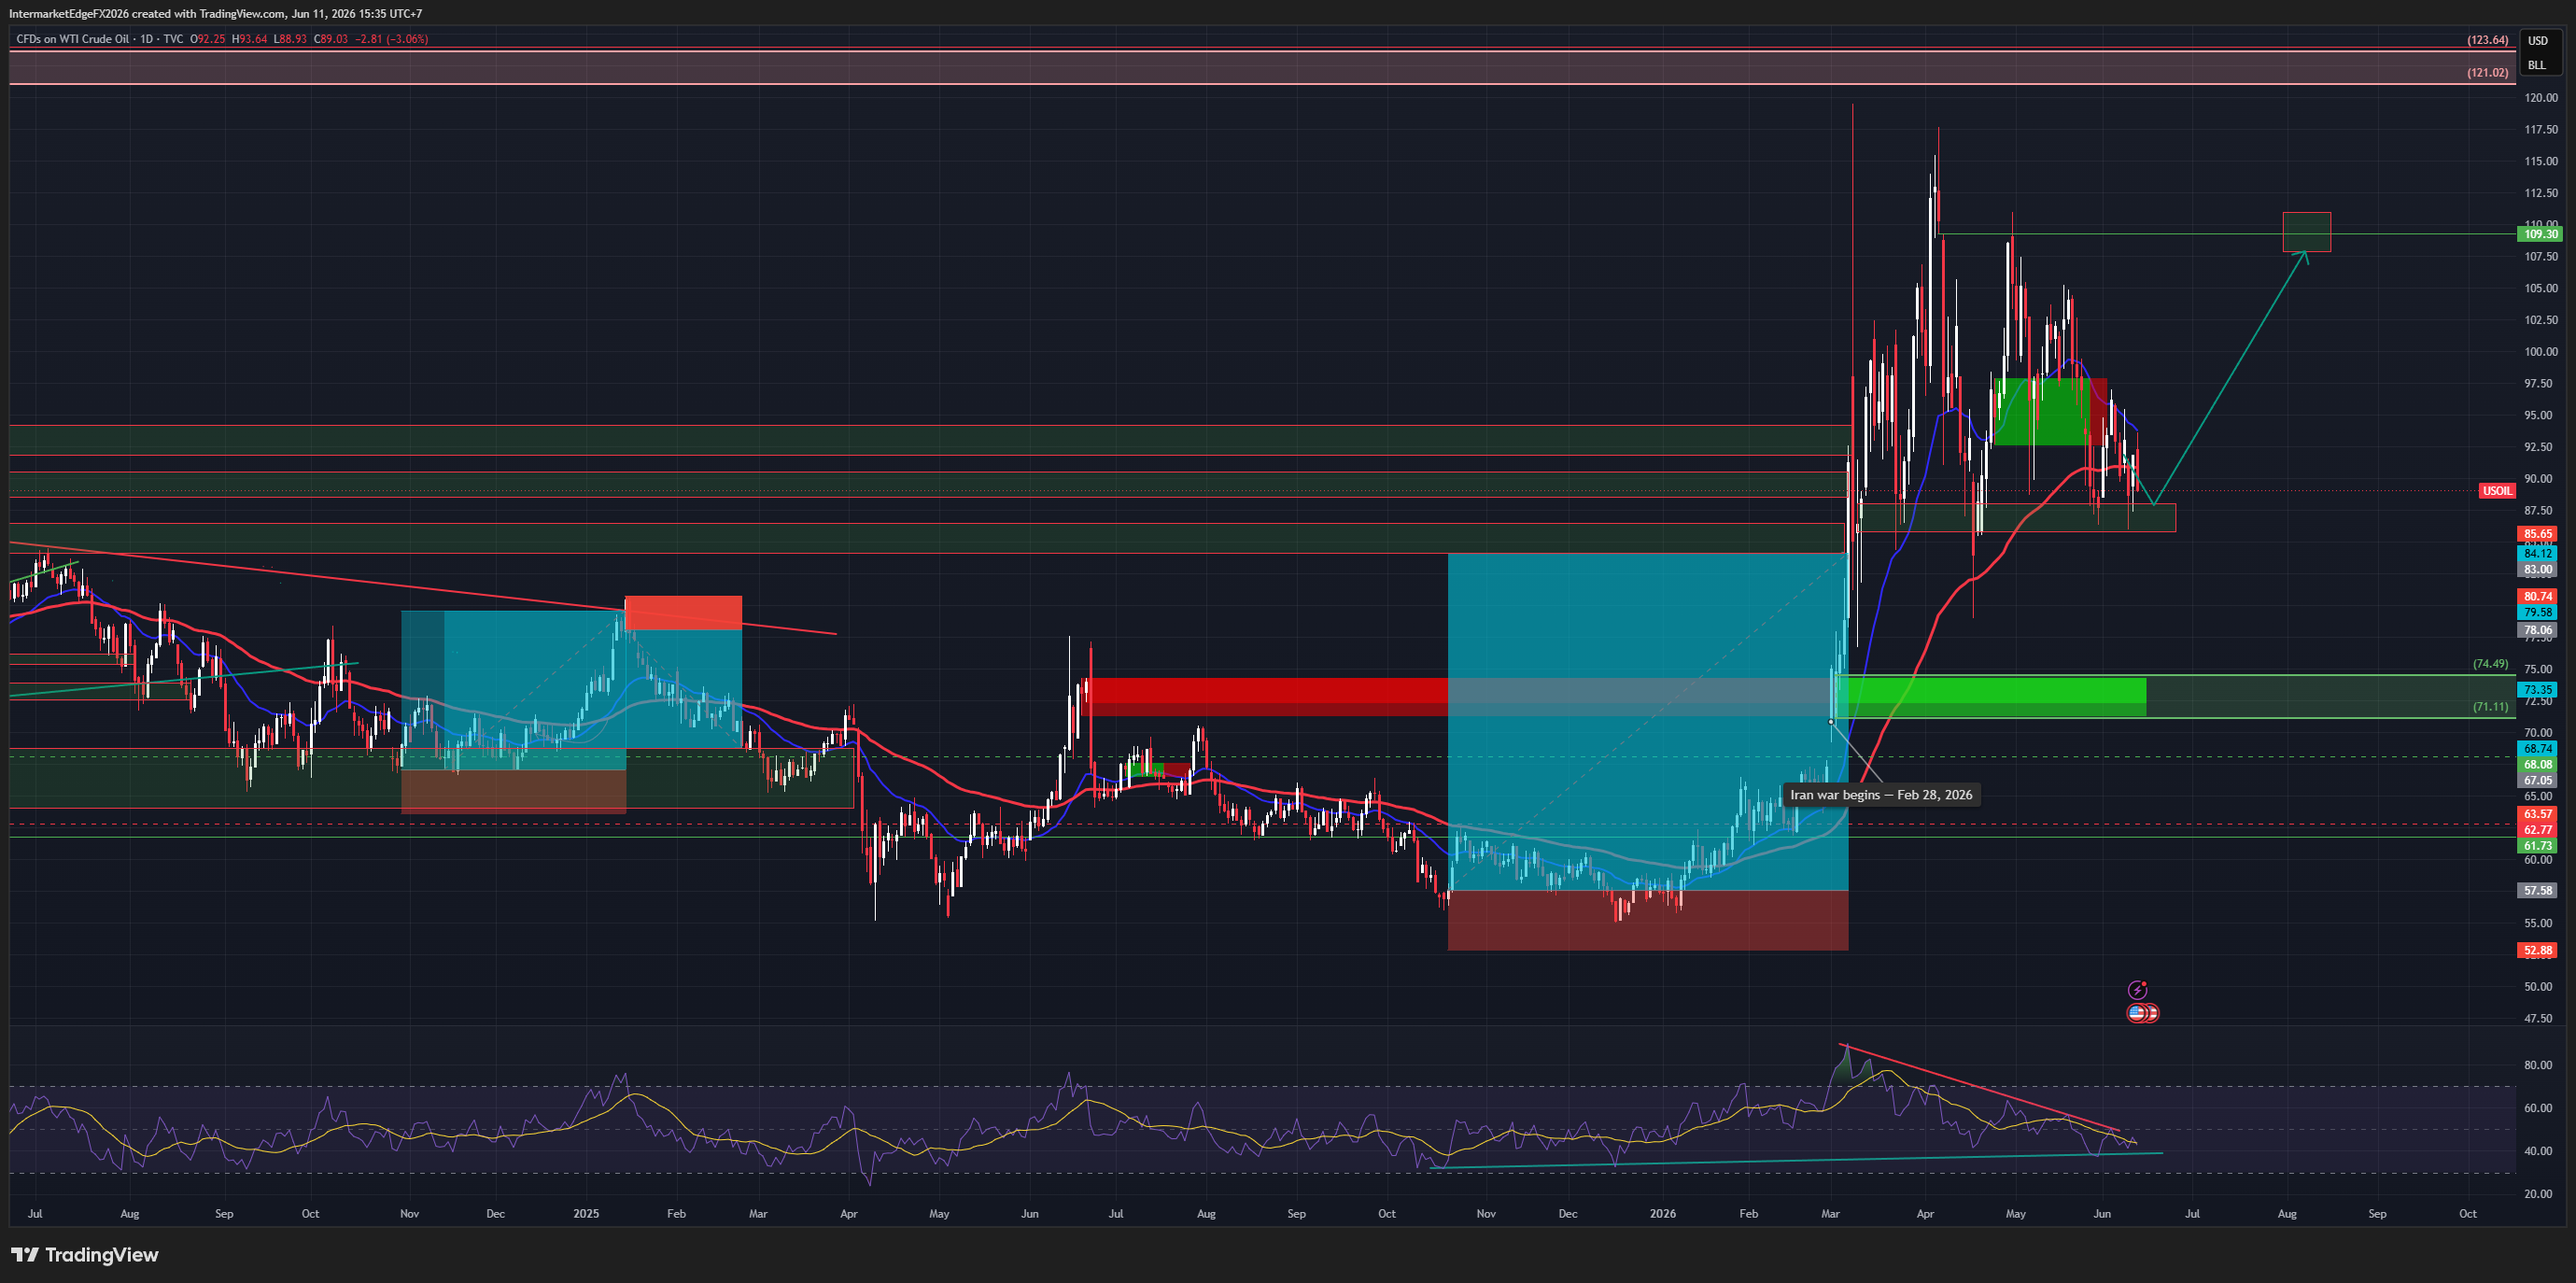
USOIL — Iran Declares Hormuz Closed, US Strikes Continue, Seventh Consecutive Draw at -7.227M, and Rystad Warns $150 if Open Conflict

USOIL — Iran Declares Hormuz Closed, US Strikes Continue, Seventh Consecutive Draw at -7.227M, and Rystad Warns $150 if Open Conflict

USOIL $89-92 | Iran declares Hormuz closed | 11 June 2026 Three military exchanges between the US and Iran in one week. Iran announced Hormuz closed. Rystad: oil could surge to $150 if open conflict. EIA printed the seventh consecutive weekly draw at -7.227 million barrels — 2.4x the forecast. The current oil price is the probability-weighted average of two scenarios approximately 30 points apart. Trump approves the 60-day MOU negotiators already drafted — strikes halt, Hormuz reopens, Brent retreats to $85-88. MOU is rejected, operational Hormuz closure confirmed — Brent toward $110-150. The EIA seventh draw is the structural floor. US inventories approaching the five-year minimum means oil does not fall below $88-90 without a deal regardless of sentiment. The Brent-WTI spread at $2.84 is the real-time Hormuz pricing mechanism. Watch for spread above $4 as confirmation of operational closure pricing — that is when oil moves toward $100-110. Risk assets recovering (S&P +0.92%, Gold +1.66%) while Iran declares Hormuz closed is not contradictory. It is the market pricing Trump's "strikes will stop shortly" as evidence that escalation is forcing the MOU approval. The single variable: Trump's MOU decision. Do not trade with normal position sizing. This is a political binary. Conviction: High Volatility, Asymmetric Bull Tail.
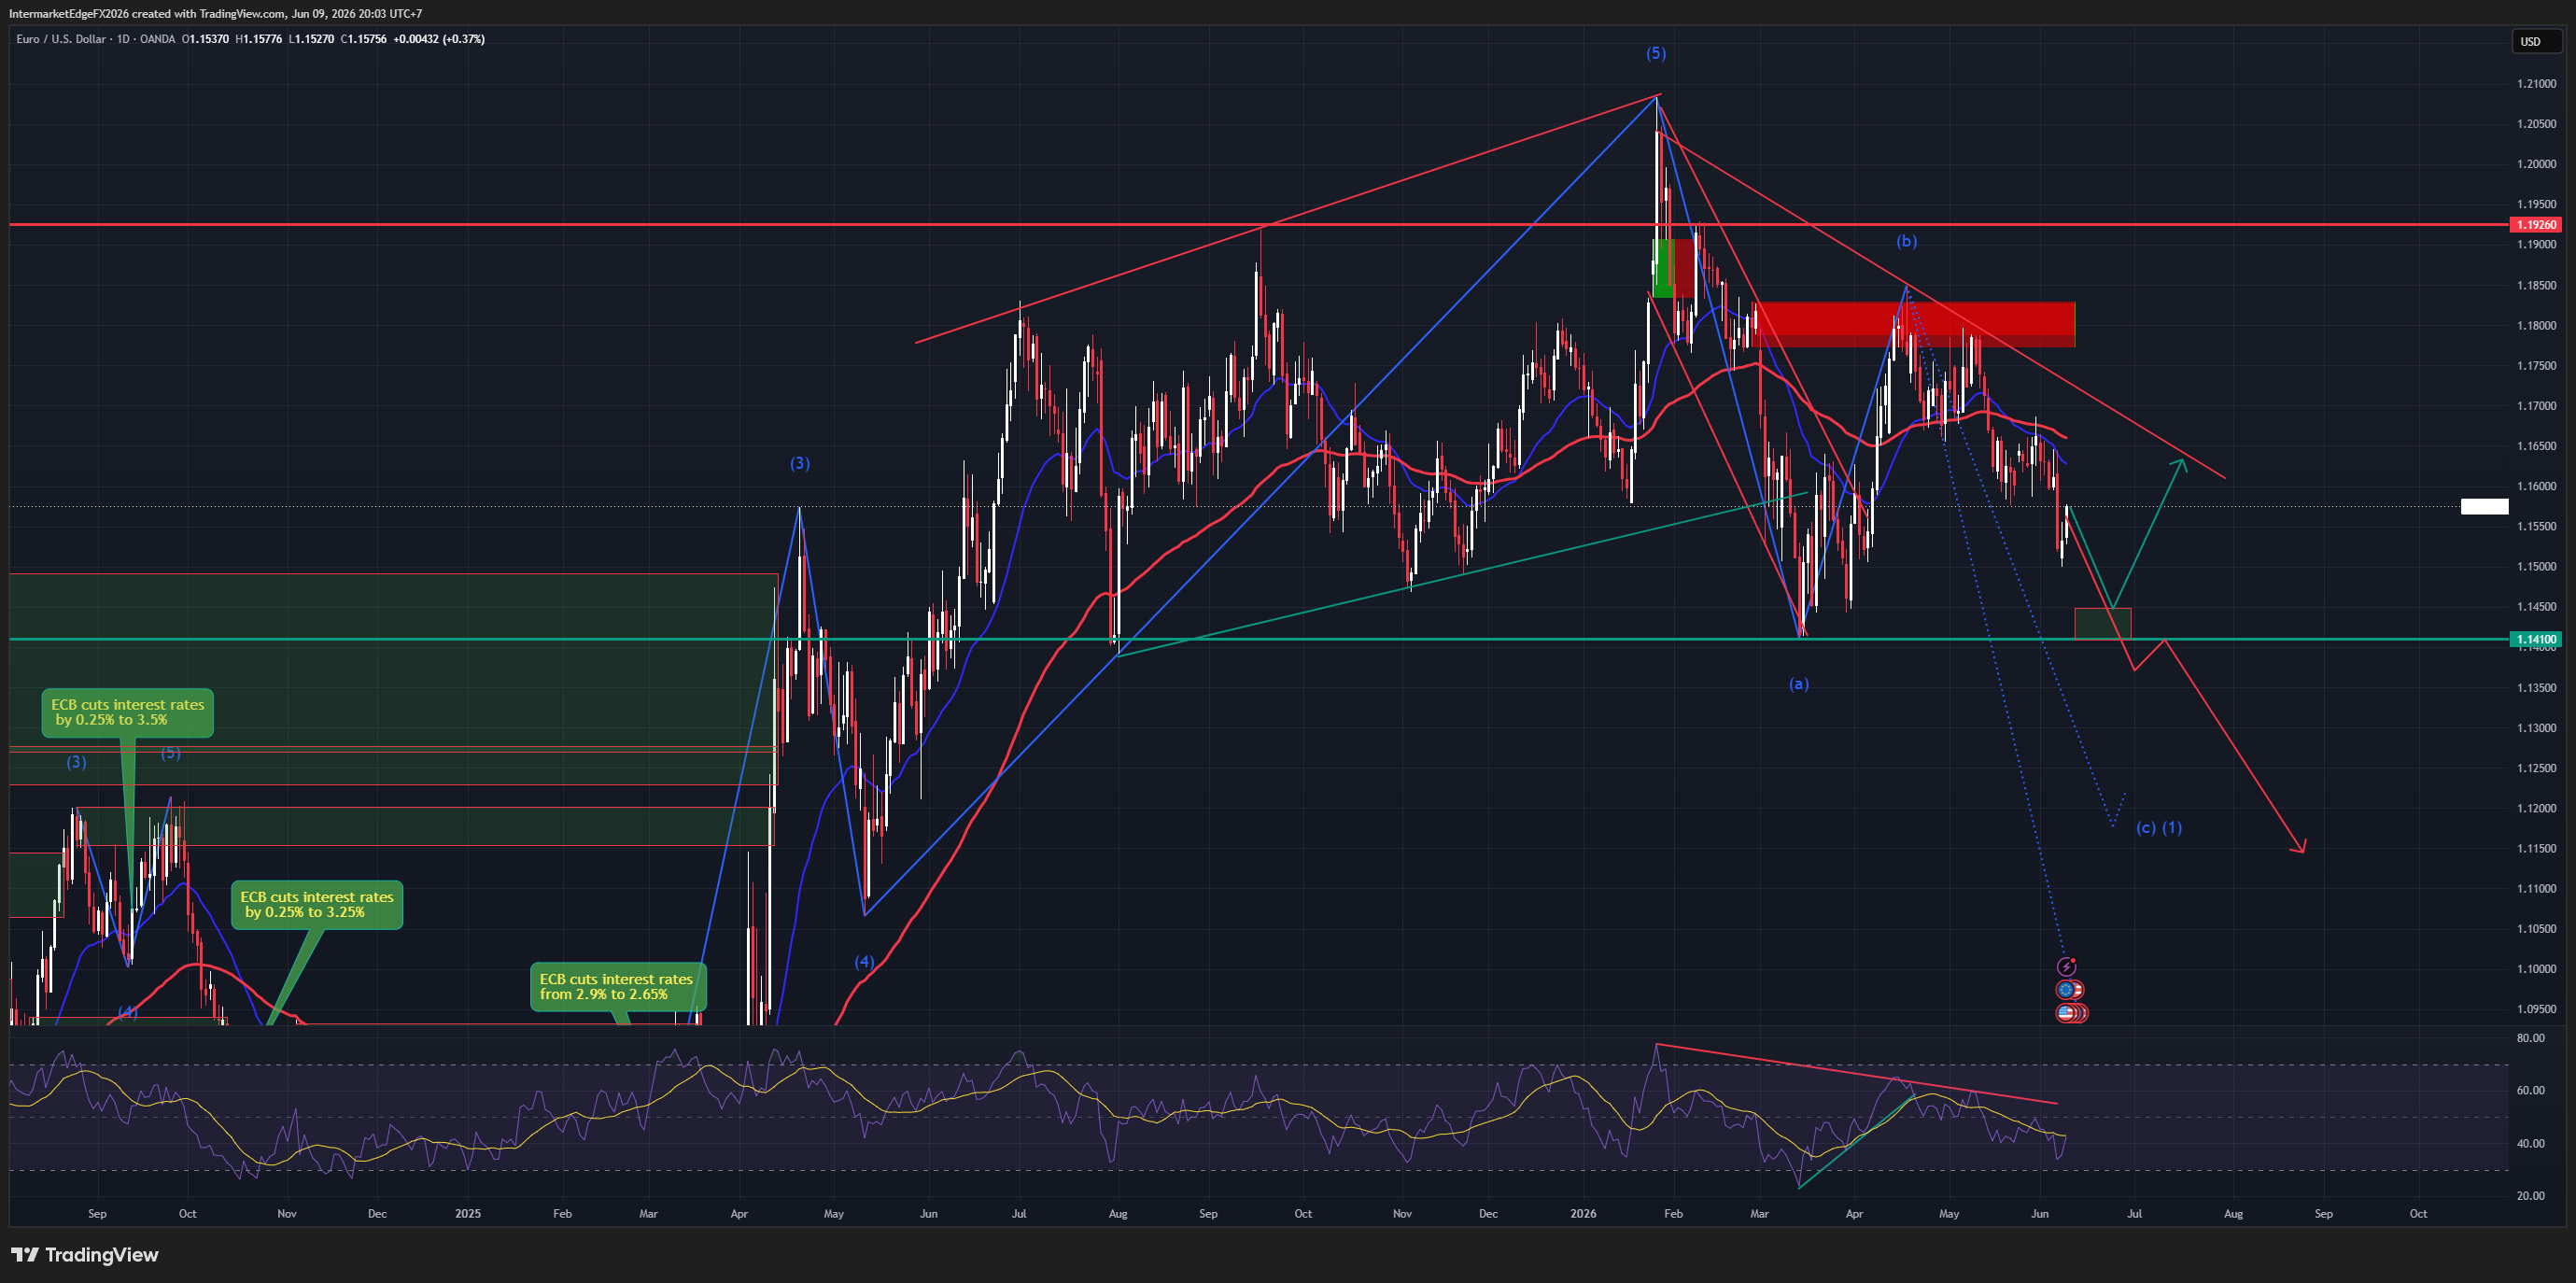
EURUSD — Iran and Israel Halt Attacks, Dollar Retreats from Two-Month High, and Wave (c) Is Still in Progress

EURUSD — Iran and Israel Halt Attacks, Dollar Retreats from Two-Month High, and Wave (c) Is Still in Progress

EURUSD 1.1578 | Iran-Israel halt | 09 June 2026 Iran and Israel announced a halt to attacks following a Trump appeal. Dollar retreated from its two-month high. EURUSD bounced 43 pips from 1.1535 to 1.1578. Brent fell from $98 to $92.86. VIX declined from 21.57 to 18.06. The question is whether this is a structural reversal or a tactical relief rally. The answer is in what has — and has not — changed. What has changed: the safe-haven dollar premium from Iran-Israel escalation is partially unwinding. Germany's Industrial Production grew +0.4% MoM in April — the first positive reading since the Iran war began. What has NOT changed: NFP 172K, Fed hike probability at 74.8%, corrected real yield at 0.740% and rising toward 1%, the ECB-Fed differential of 1.25-1.50 percentage points in the dollar's favor, and the wave (c) corrective structure targeting 1.1200. The clearest structural tell: USDJPY at 160.189 is not declining despite the broad dollar retreat. In a pure geopolitical unwind, the yen would be surging. The fact that it is holding above 160 confirms the structural rate differential dollar bid is intact — today's EURUSD bounce is tactical, not structural. SocGen Juckes: "The big event this week is the US CPI data. A big upside surprise and the dollar gets a bid. A benign print and that is a different story." Invalidation: daily close above 1.1920. Wave (c) targets: 1.1200 → 1.0950. Do not add directional exposure before CPI Wednesday June 11. Conviction: Medium, Neutral-to-Mild Bear.

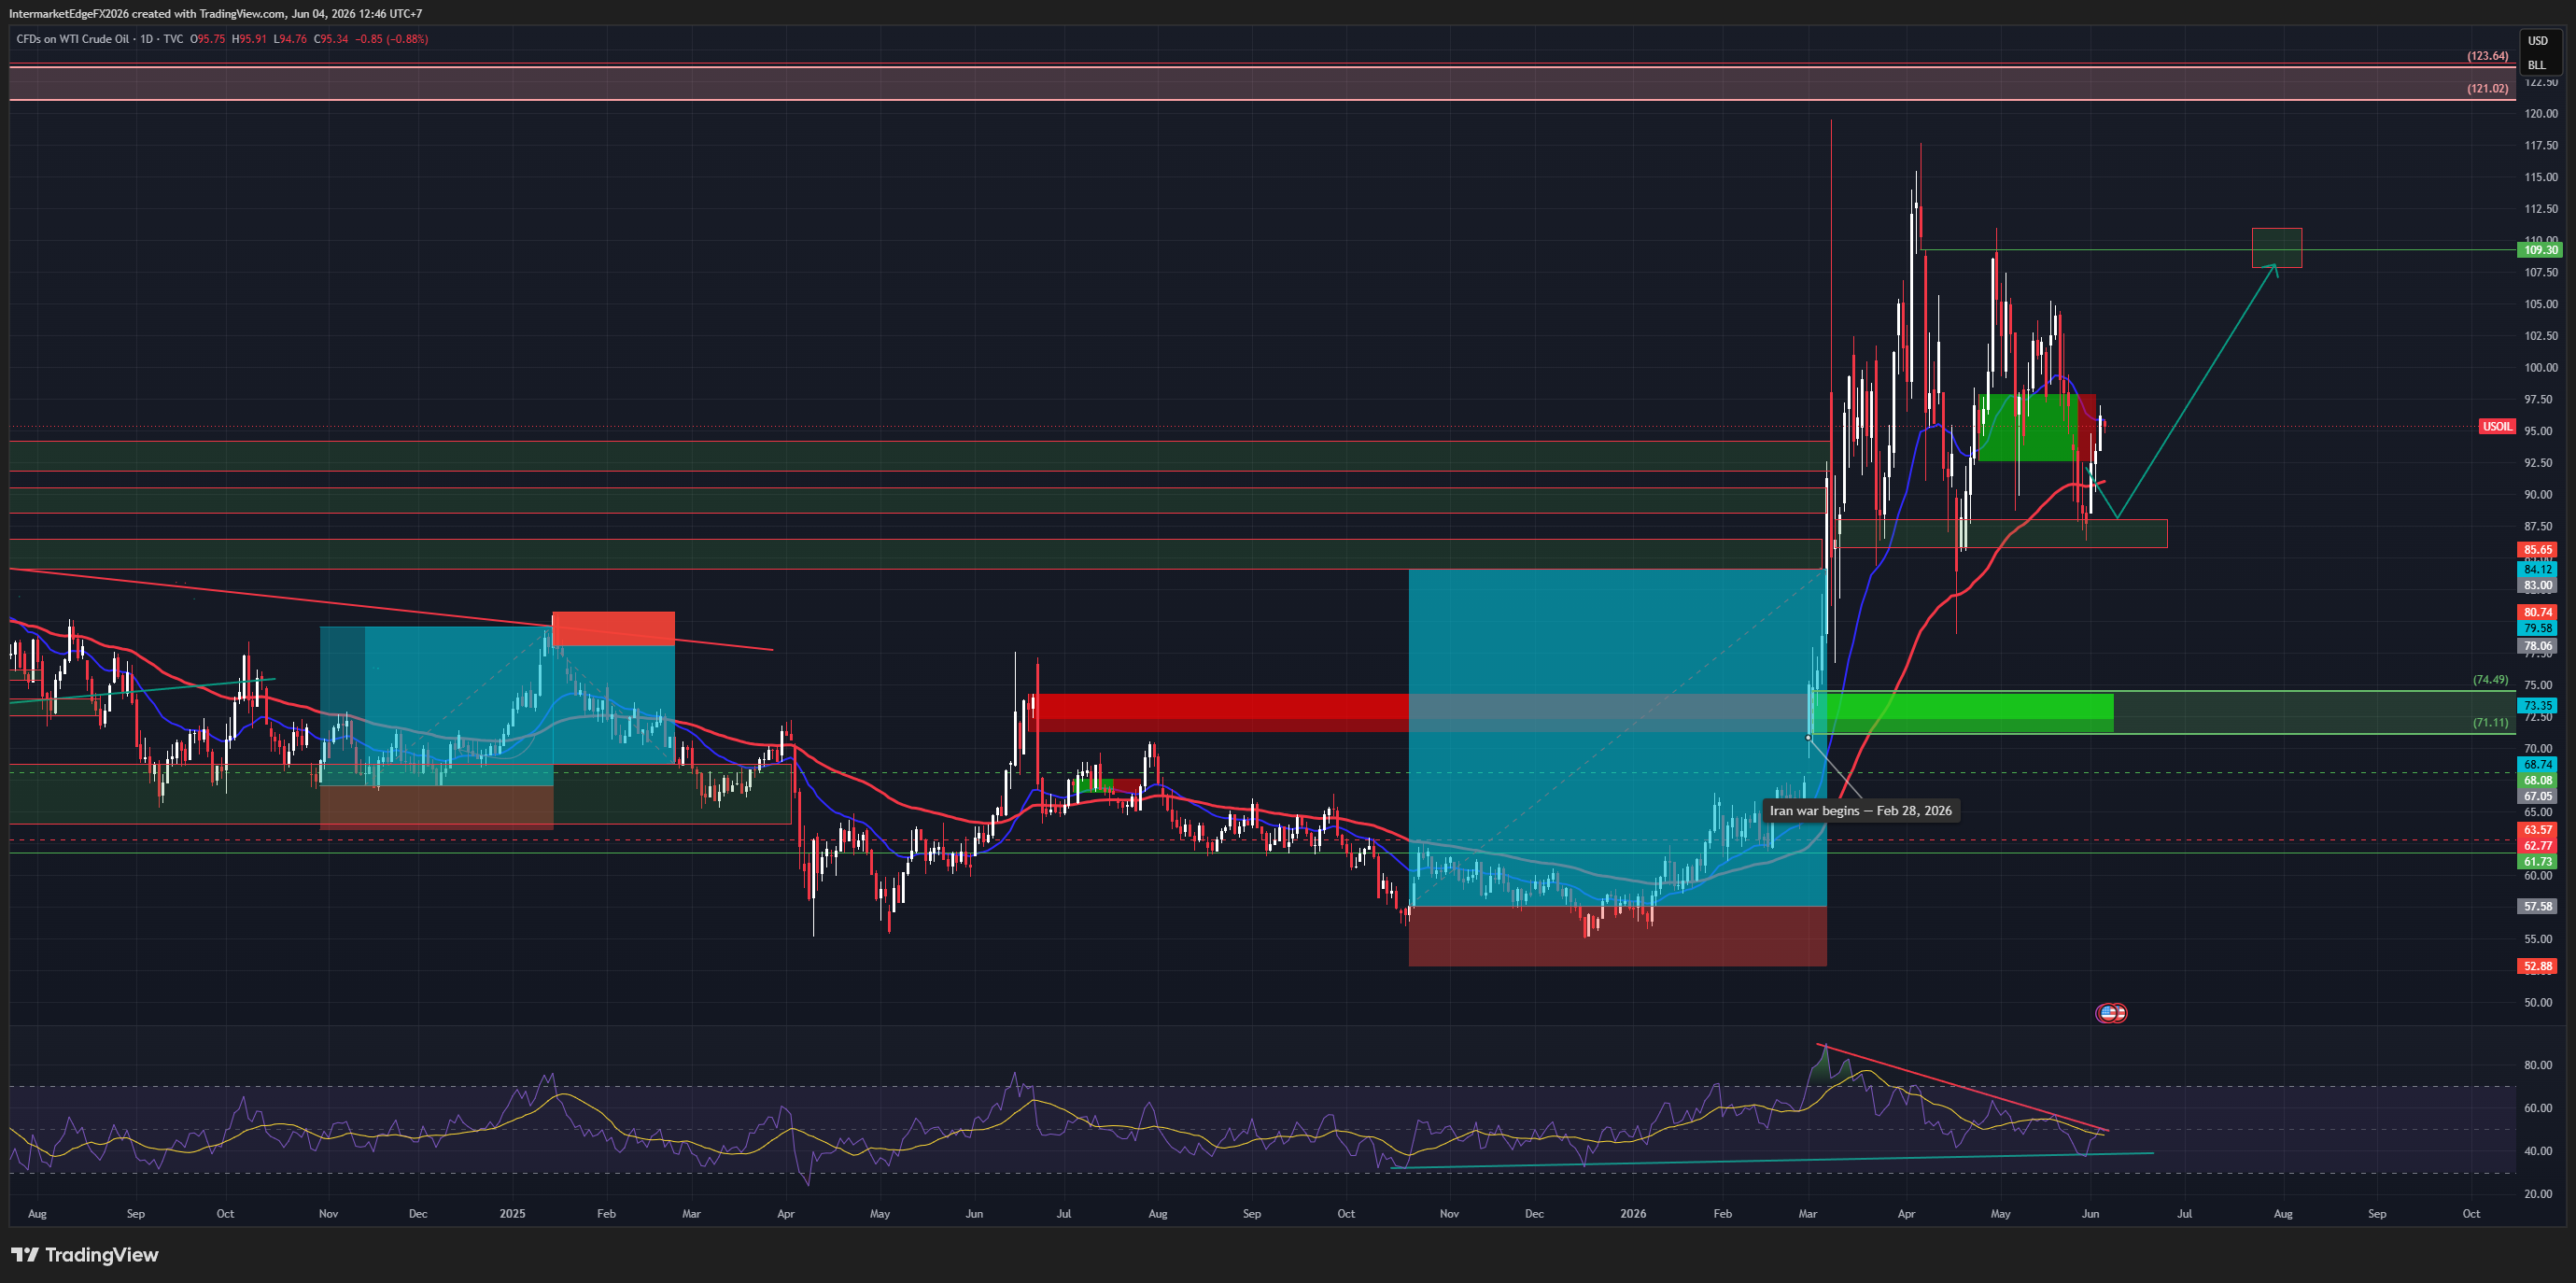
USOIL — Sixth Consecutive Draw, Iran Fires Missiles, Lebanon Complicates the Deal, and $92 Is the Floor That Matters

USOIL — Sixth Consecutive Draw, Iran Fires Missiles, Lebanon Complicates the Deal, and $92 Is the Floor That Matters

USOIL $95.33 | EIA -7.974M bbl | 04 June 2026 The most bullish EIA print of the current cycle just dropped. Six consecutive weekly draws. Distillates at a 23-year low. The supply picture is unambiguously tightening. And WTI is falling anyway. That is the paradox defining the oil market today — and understanding it is the key to positioning correctly. The EIA draw of -7.974 million barrels for the week ending May 30 was nearly three times the forecast of -2.900M. At current draw rates, US crude stockpiles approach the five-year minimum range within four to six weeks. This is the fundamental floor argument for WTI holding $90-92: the supply picture does not support a rapid decline to the bear targets of $74-71 without either a demand collapse or a full Hormuz reopening. The reason prices are falling despite this data is the Iran-Lebanon nexus. Tehran has conditioned any deal progress on a halt to Israeli operations in Lebanon. Israel has continued strikes despite Trump personally asking Netanyahu to hold back. Iran launched ballistic missiles. US forces struck Qeshm Island in retaliation. Iranian state media says message exchanges with Washington have been suspended. The deal is not dead — Trump insists talks are active — but it is in its most fragile phase since the April 8 ceasefire. The $100-102 resistance has failed twice this week. The $92-97 consolidation zone is the current equilibrium. The $88-92 floor is where supply fundamentals provide genuine structural support. Bear targets if deal completes and Hormuz reopens: $74.49 → $71.11. Invalidation: daily close above $102. Conviction: Medium, Neutral-to-Mild Bear. Timeline extended 2-4 weeks by Lebanon complication.

Gold at the Decision Point — Iran Stalemate, Real Yield Inversion, and the $4,296 Support That Cannot Break

Gold at the Decision Point — Iran Stalemate, Real Yield Inversion, and the $4,296 Support That Cannot Break

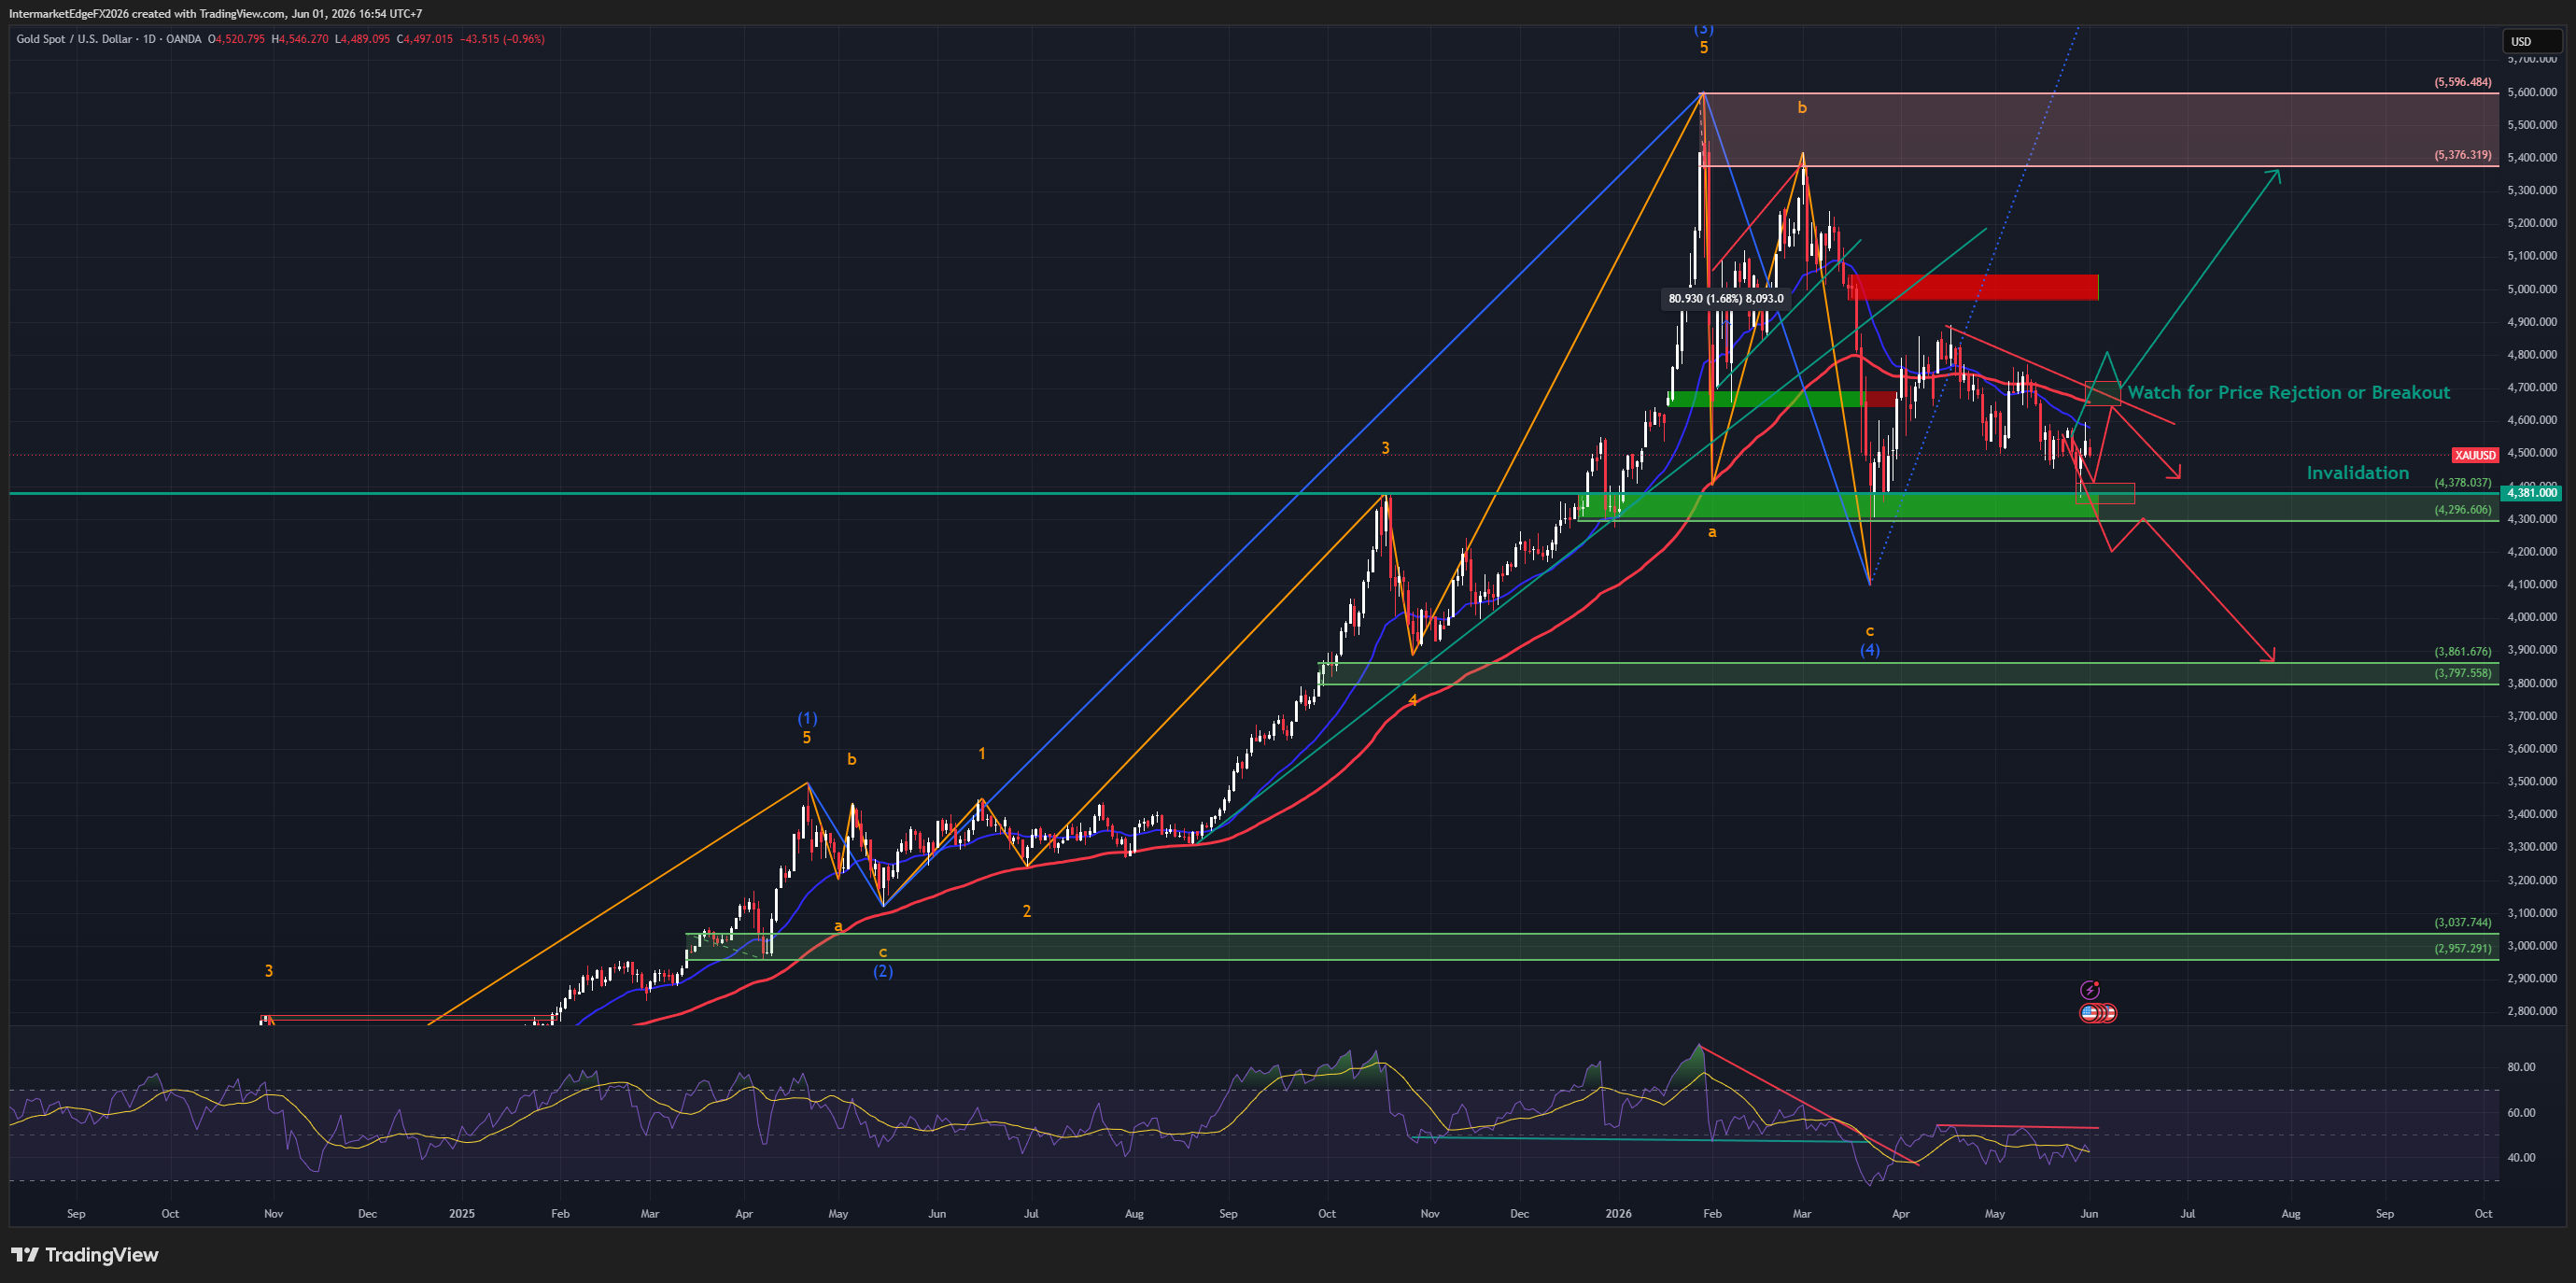
XAUUSD $4,534 | 02 June 2026 Gold is sitting directly on its most important support zone of the year — $4,296 to $4,381 — and the next $200 move in either direction will be decided by a single binary: whether Trump signs the Iran ceasefire deal or walks away. The macro case for gold recovery is structurally sound and does not require geopolitical optimism to hold. With April CPI confirmed at 3.8%, the corrected US real yield is 0.653% — not the 2.05% the stale data pipeline implies. Real yields below 1% historically support gold outperformance on a 3-6 month horizon. The oil decompression cascade has already delivered: Brent fell $17.95 from its $111.27 peak on May 18. Lower oil compresses inflation expectations, reduces Fed hike probability, and begins unwinding the real yield headwind that drove gold from $5,078 to $4,290. The critical regime nuance: in this cycle, an Iran deal is bullish gold — not bearish. Geopolitical de-escalation lowers oil, which lowers inflation, which lowers real yields. The classical safe-haven logic runs backward here. On the chart, RSI has not made a lower low despite price testing the support zone — a momentum divergence consistent with exhaustion of downside pressure. Invalidation is a daily close below $4,178. Bull confirmation sequence: $4,600 → $4,750 → $5,000 weekly close. Key catalysts this week: Iran headline (highest impact, unscheduled), EIA inventory Wednesday, ECB Thursday June 5. Conviction: Conditionally Bullish. The support must hold.

DXY | 25/05/2026 Dollar Drifts Lower on Hormuz Deal Optimism - But the Technical Structure Tells a More Complex Story

DXY | 25/05/2026 Dollar Drifts Lower on Hormuz Deal Optimism - But the Technical Structure Tells a More Complex Story

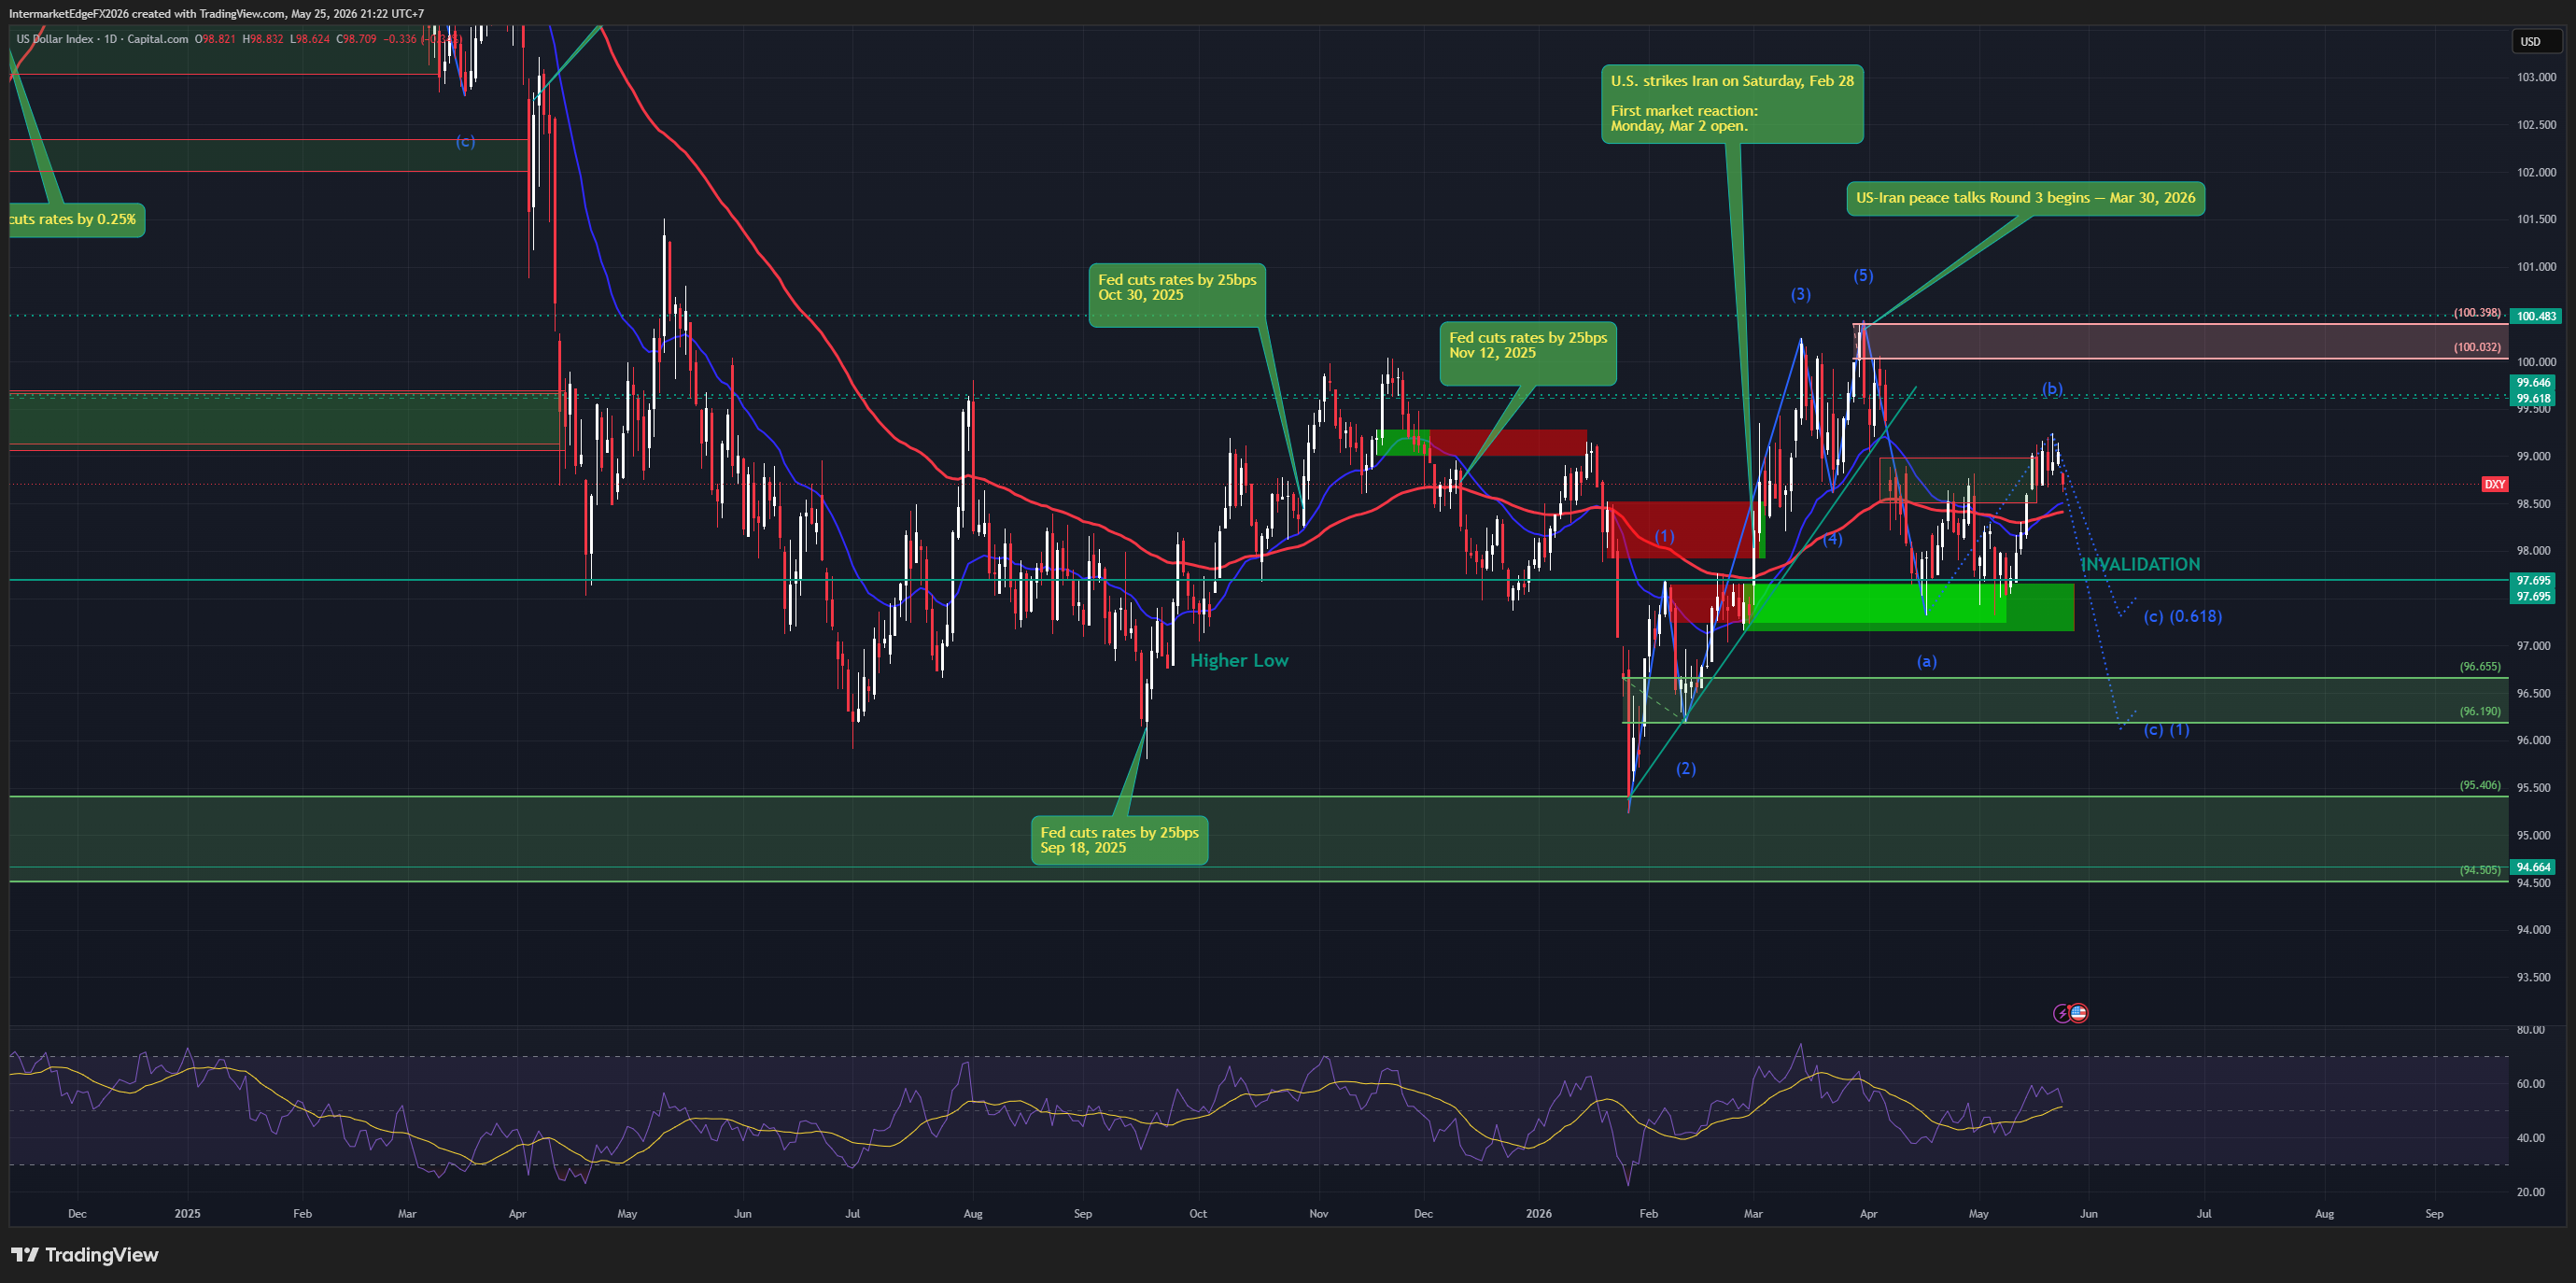
The dollar is not in a simple downtrend. It is in a corrective structure — and Iran deal optimism is the force testing its floor. DXY at 98.71 today. Down 0.34%. Headlines say "dollar drifts lower on Hormuz deal optimism." That is true but incomplete. Here is the full picture: Iran deal progress pulls Brent lower ($111 to $103 in 7 days) Lower oil compresses inflation expectations Compressed inflation reduces Fed hike odds (currently ~55% before Q4) Lower hike odds weaken the dollar mechanically But rate differential (Fed hold vs ECB cutting at 2.50%) remains a structural floor The chart tells you exactly where this ends up. D1 DXY shows a clear ABC corrective wave structure after the war spike from 97.6 to 102.5. Wave (c) Fibonacci 0.618 target: 96.65. That is the measured destination if Iran deal materializes and Logan on Wednesday does not push back. The "Higher Low" at 97.69 is the invalidation floor. Red resistance at 100.03-100.40 has been rejected twice. EURUSD at 1.1646 — with 57.6% weight in the DXY basket — is the ceiling that makes any sustained DXY recovery structurally difficult. The tell is EURUSD 1.17. If EUR breaks that level, de-dollarization is accelerating and 96.65 is in play. If EURUSD rejects at 1.17 after Logan Wednesday, expect a corrective bounce back toward 100. Two events decide DXY's direction this week. Iran deal signing (no schedule, 30% probability in 24-48h). Logan speech Wednesday — hawkish confirmation of Waller's stance would suspend the entire bear thesis near-term regardless of Iran. Conviction: Medium-Bear. Conditional on Logan neutral and deal progress. 98.71 is the price of a market waiting for Wednesday.

XAUUSD | 25/05/2026 Gold Rises on Iran Deal "Largely Negotiated" - But What Is the Market Really Signaling?

XAUUSD | 25/05/2026 Gold Rises on Iran Deal "Largely Negotiated" - But What Is the Market Really Signaling?

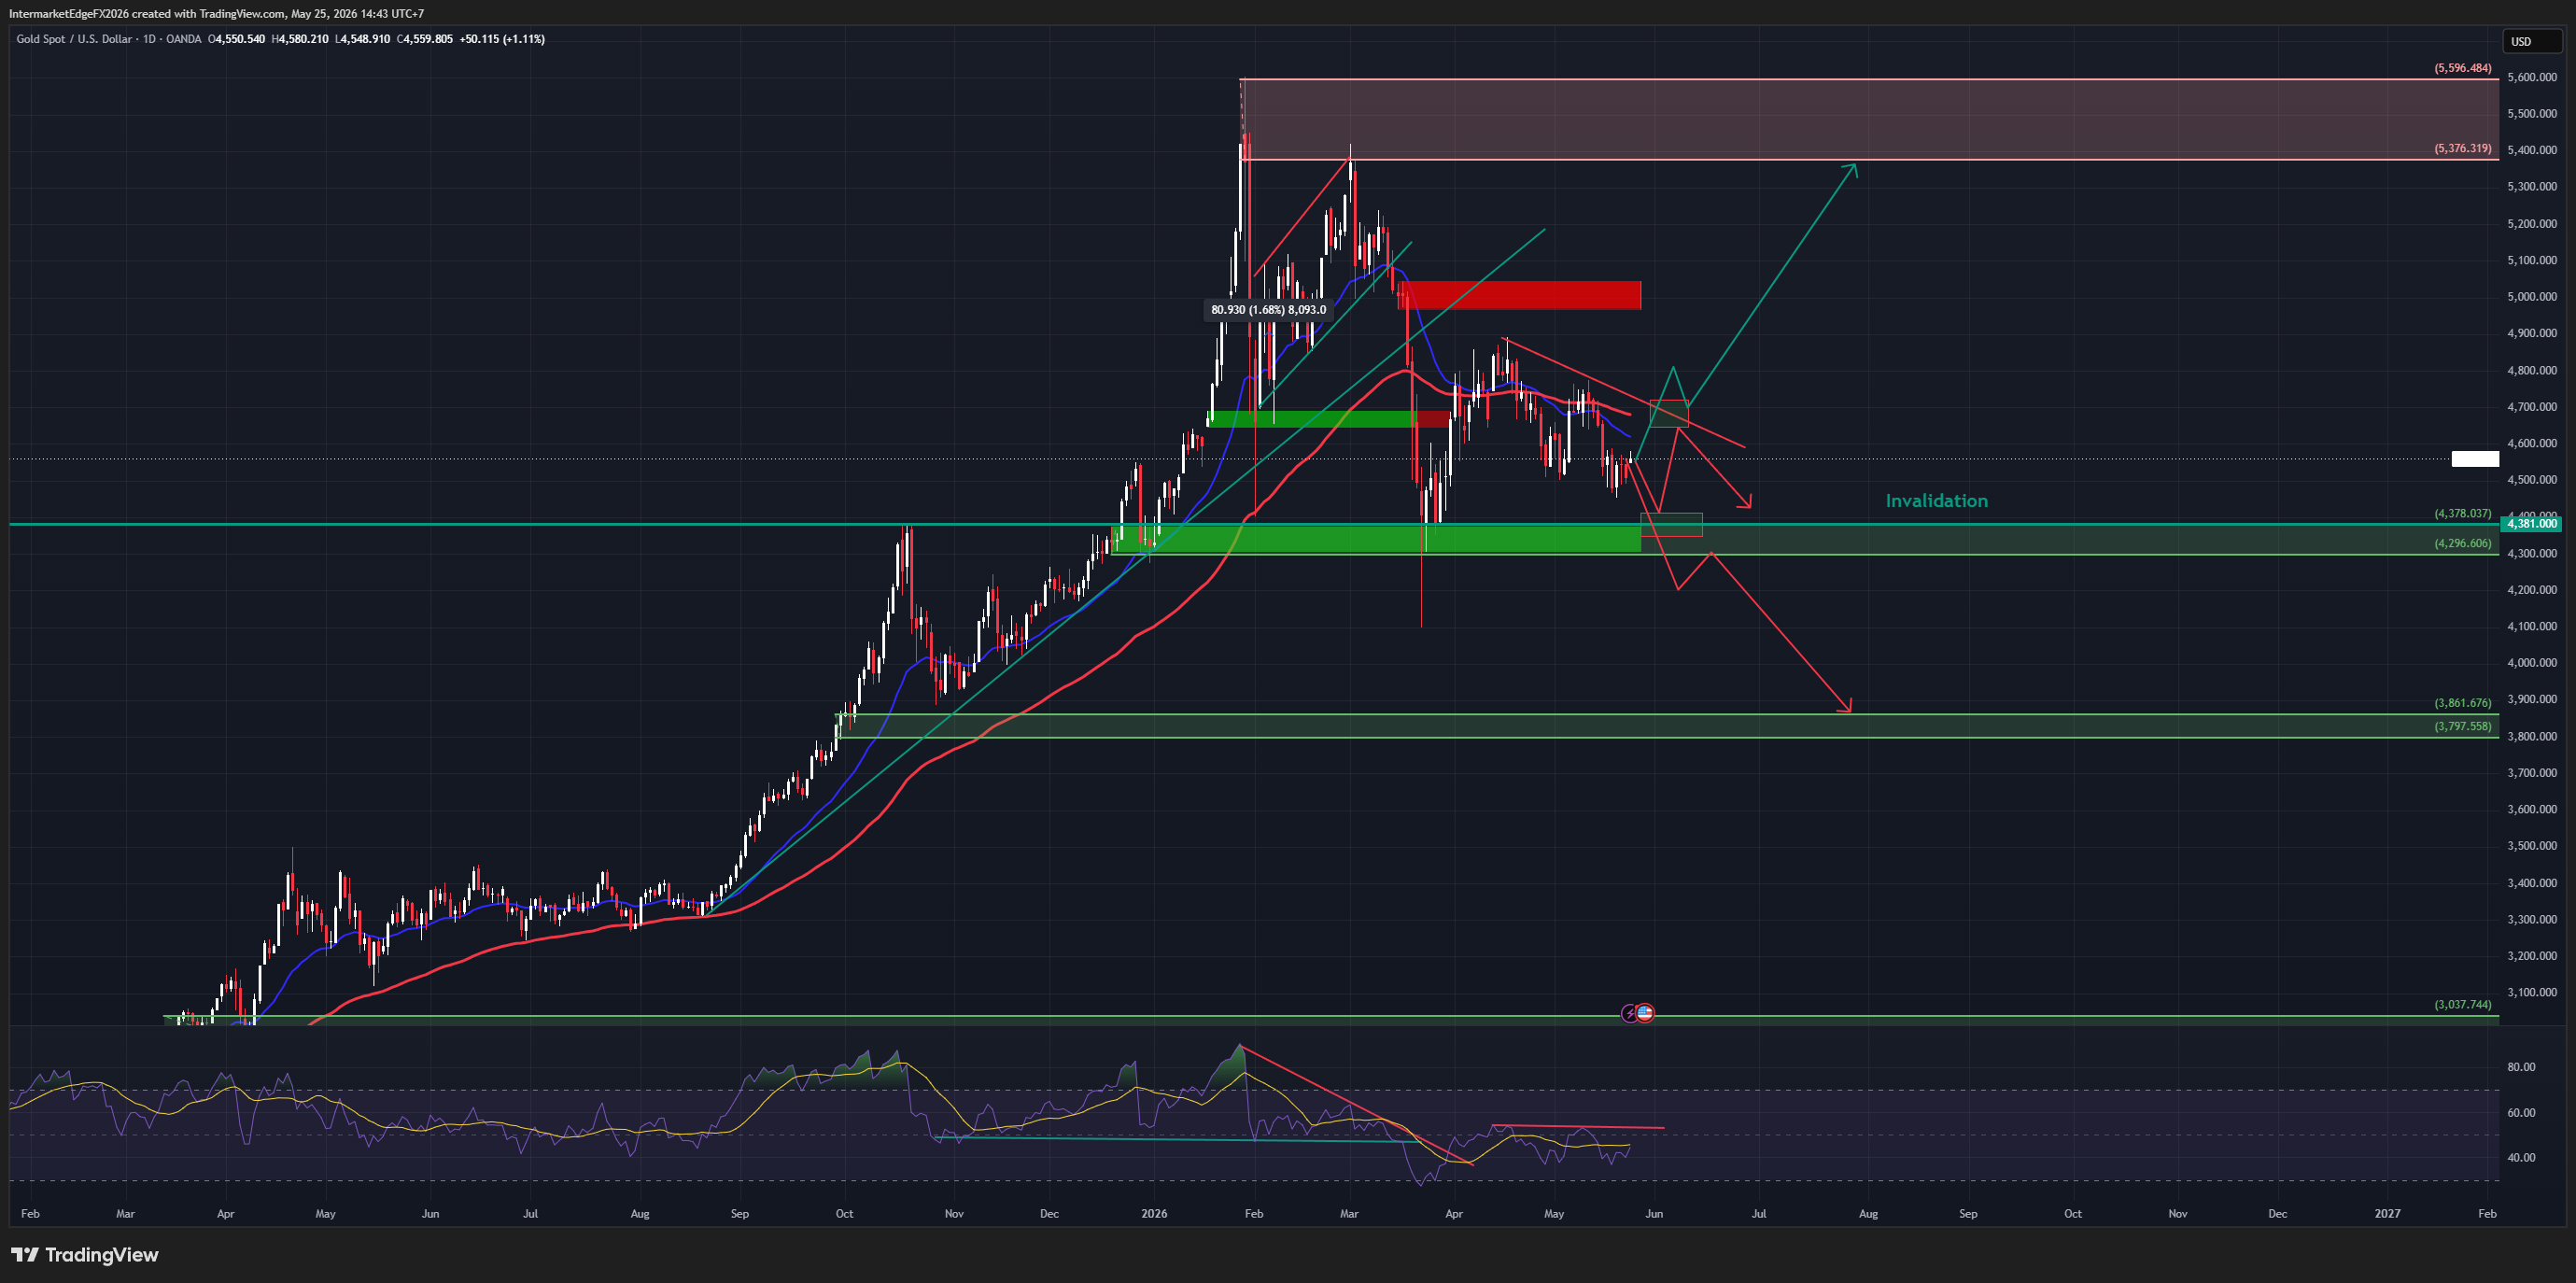
Gold at $4,564 on 25 May 2026 is not a simple safe-haven rally. It is the price of a market repricing an inverted causation chain: the Iran deal optimism is bullish for gold not because war is ending, but because a deal means lower oil, lower inflation, lower Fed hike expectations, and compressed real yields. The classic "geopolitical risk drives safe-haven bid" framework has been replaced by its mirror image - which also explains why gold is still 14% below pre-conflict levels despite an active war. Oil-driven stagflation overrode the geopolitical bid from day one. Trump's "largely negotiated" declaration on 23 May was immediately walked back the following day with "not rush" and blockade remains. This is a familiar pattern. In April, gold surged 2% to $4,803 on a brief ceasefire announcement, then plunged to $4,643 when Islamabad talks collapsed after 21 hours. Markets are learning to price probability, not headlines. The data supports cautious optimism. Brent has fallen $7.73 in seven days to $103.54, the clearest market signal that Hormuz reopening probability is rising. DXY holds below 100. Real yield is approximately 0.76% (not the 2.158% the pipeline reports - April CPI actual is 3.8%, not the stale 2.4%). At 0.76%, real yield is mildly restrictive but insufficient to break the structural de-dollarization bid beneath gold. Conviction sits at Medium. Three signals to watch: Brent continuing lower, DXY holding below 100, and EURUSD holding above 1.15. If Brent breaks below $100 this week, markets are fully pricing the deal and real yields will compress regardless of Fed rhetoric. The critical scheduled risk is FOMC Member Logan speaking Wednesday 27 May - a hawkish confirmation of Waller's stance would pressure gold near-term regardless of Iran progress. Bias: conditionally bullish, dependent on deal finalization and Logan.

USOIL | May 21, 2026 The Oil Market's Most Important Week - What the $5 Swing Tells You About Hormuz

USOIL | May 21, 2026 The Oil Market's Most Important Week - What the $5 Swing Tells You About Hormuz

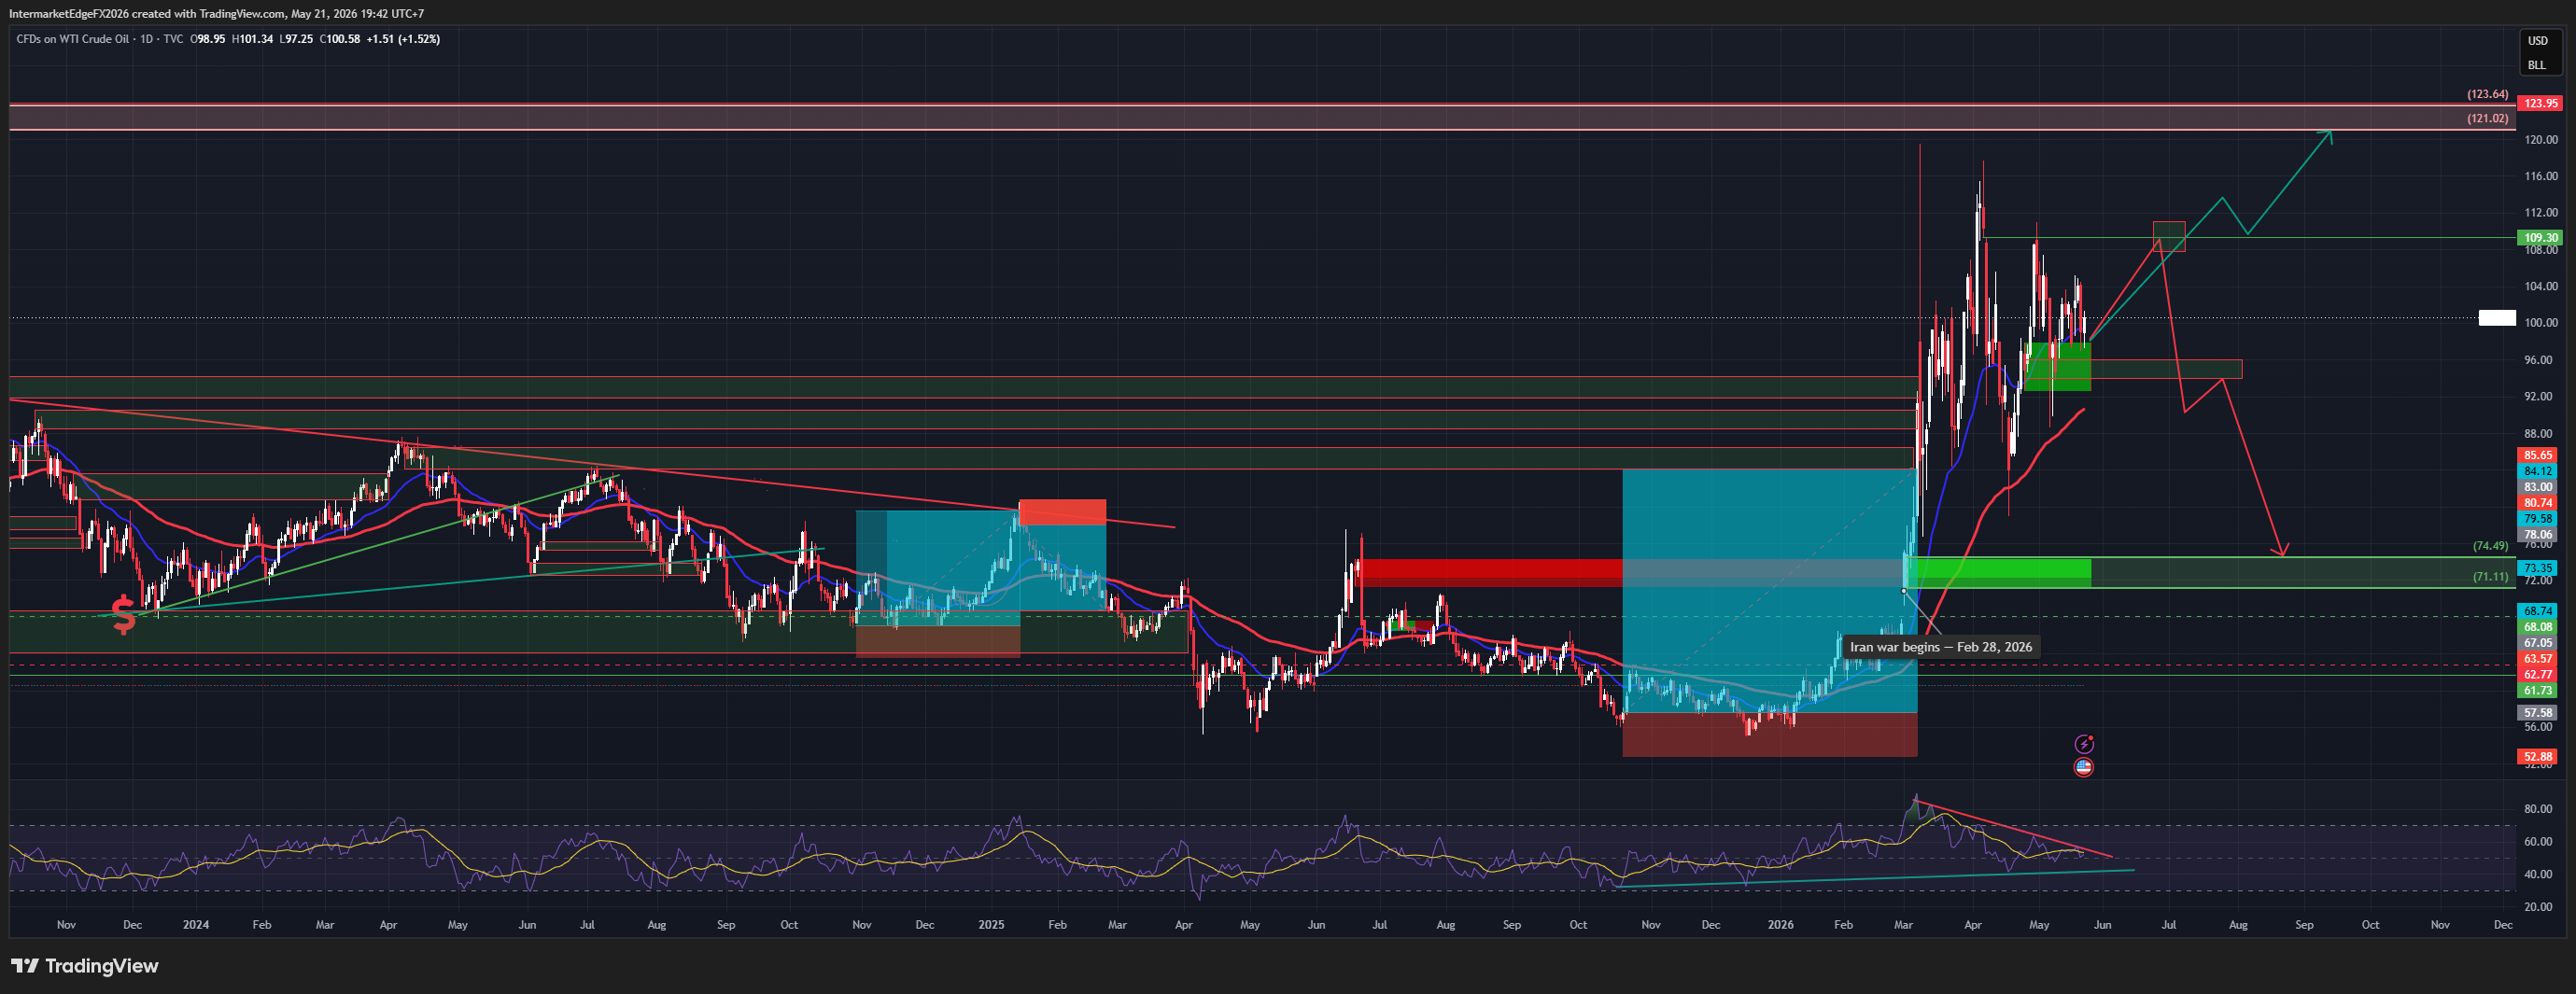
**USOIL | May 21, 2026** WTI at $101.13. Brent at $107.40. This is the instrument that drove every other analysis published this week. The Brent sequence from May 18 to May 21 is the story of the week in a single column of numbers. From $111.27 on Monday to $106.09 Thursday morning, then bouncing to $107.40 by evening. A $5 decline and partial recovery across four trading days - not noise, but the market pricing and partially repricing Hormuz reopening probability in real time. The structural picture is unambiguous. This is still the largest oil supply shock in market history by some measures. Hormuz remains largely restricted. Three supertankers transited the Strait on Wednesday - in a market accustomed to hundreds per week. That is not normalization. US crude inventories fell for a fourth consecutive week, confirming demand is holding and the supply shortage is genuine. OPEC+ adding +411kbpd from June is a gesture in a market facing a daily shortfall estimated at 14+ million barrels. But the Iran deal probability introduces a binary outcome that overrides the structural argument in the short term. A deal confirmed sends WTI toward $74-82 as the war premium exits - gradually, not instantly, because physical infrastructure takes months to normalize. A deal collapse sends WTI back toward $109-115. Wednesday's EIA data is the supporting variable. The Iran headline is the primary driver. The intermarket confirmation is clear. Gold at $4,515 recovered alongside oil today. EURUSD held above 1.15. USDJPY stayed below 160. Every currency pair analyzed this week - USDCAD, EURUSD, DXY, GBPUSD, EURGBP, EURJPY, USDJPY - moved because of this number. The structural tell is not a diplomatic announcement. It is tanker tracking data. Watch three supertankers become thirty. When that happens, Brent flips from backwardation to contango - and the war premium exits. Conviction: Medium. Structurally bullish. Directionally binary on Iran.

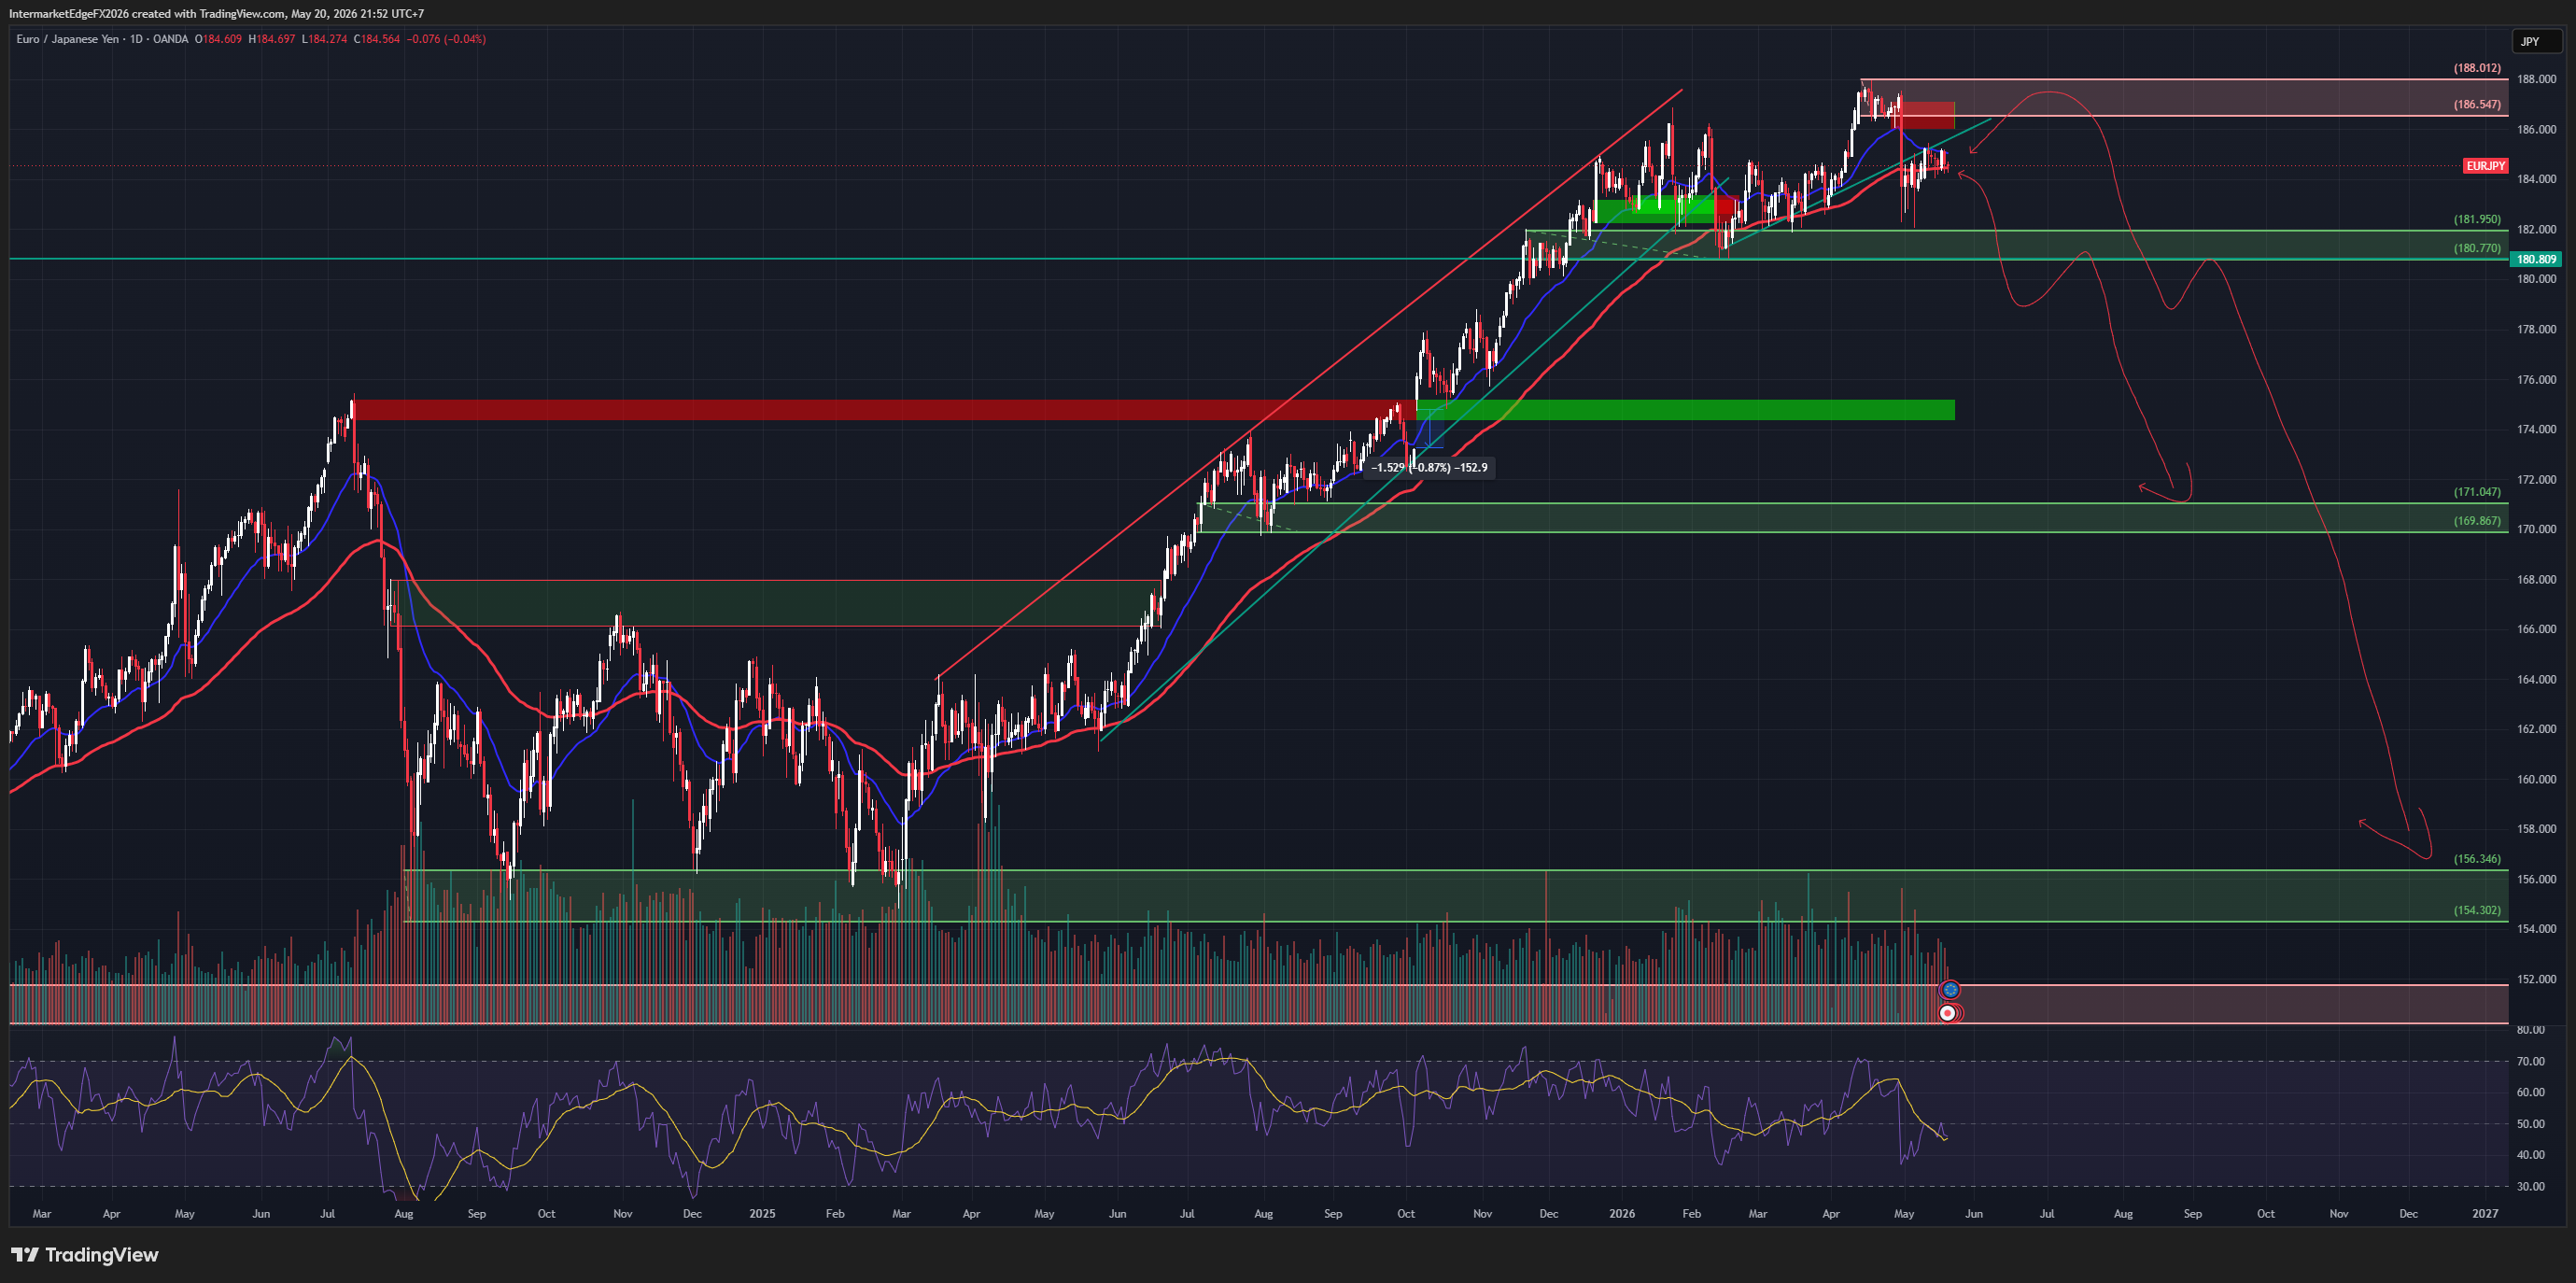
EURJPY | Update - May 20, 2026 | 21:24 GMT+7 Carry Cross Bounces - But the Iran De-escalation Signal Is the Real Story

EURJPY | Update - May 20, 2026 | 21:24 GMT+7 Carry Cross Bounces - But the Iran De-escalation Signal Is the Real Story

**EURJPY | Real-Time Update - May 20, 2026** EURJPY is at 184.59. The 24 basis point bounce from the session low is not the story tonight. What is happening behind that number is. Iran has sent an updated peace proposal to Pakistan mediators. Brent has dropped to $108.26 - the lowest level of the week. WTI is at $101.58. Oil has fallen nearly $3 in 48 hours. This is the market beginning to price the probability of Hormuz reopening, and it changes the entire analytical framework for EURJPY. The context matters. On May 6, when Trump paused Project Freedom citing "great progress," WTI plunged 15% intraday to $88. The market already showed how violently it reprices when a deal gets close. Tonight is a smaller version of that signal - Iran has sent a proposal, but Trump says he is "not satisfied." The market is pricing probability, not outcome. For EURJPY specifically, this creates a direct conflict. The EUR structural bid - the de-dollarization flow that has been supporting EURUSD above 1.15 despite the ECB cutting cycle - is built on Hormuz urgency. If that urgency compresses, the EUR loses a structural support layer. At the same time, equities are rising (S&P 500 +0.43% to 7,392), which means the carry trade is not being unwound. VIX at 17.91, DE-JP yield spread still +152bps - the carry math is intact. The result: Brent falling while equities rising. EURJPY downside is gradual, not a crash. Carry is not broken. EUR foundation is weakening. Three scenarios this week: Iran deal materializes in 48-72 hours - EURJPY drops toward 180-182 fast (25%). Talks continue without resolution - EURJPY consolidates 182-186, base case (55%). Talks collapse and Iran escalates - oil spikes, EURJPY volatile both ways (20%). The tell: watch Brent and EURUSD simultaneously. If Brent falls but EURUSD holds above 1.15, the structural bid is still absorbing the pressure. If both break together, 180 gets tested quickly. Do not chase tonight. Watch Brent. Watch the next Iran headline.

InterMarketEdge

© 2026 InterMarketEdge. Financial intelligence for inter-market traders.