Intermarket Analysis SLUG — InterMarketEdge

Intermarket Analysis SLUG

Cross-asset correlation studies — how oil, yields, equities, and FX interact and what divergences signal

USDCAD - CAD Hits a 14-Month Low as Oil Breaks Below $70 and DXY Holds a 13-Month High, a Double Squeeze Drives Wave (3) Toward 1.4447

USDCAD - CAD Hits a 14-Month Low as Oil Breaks Below $70 and DXY Holds a 13-Month High, a Double Squeeze Drives Wave (3) Toward 1.4447

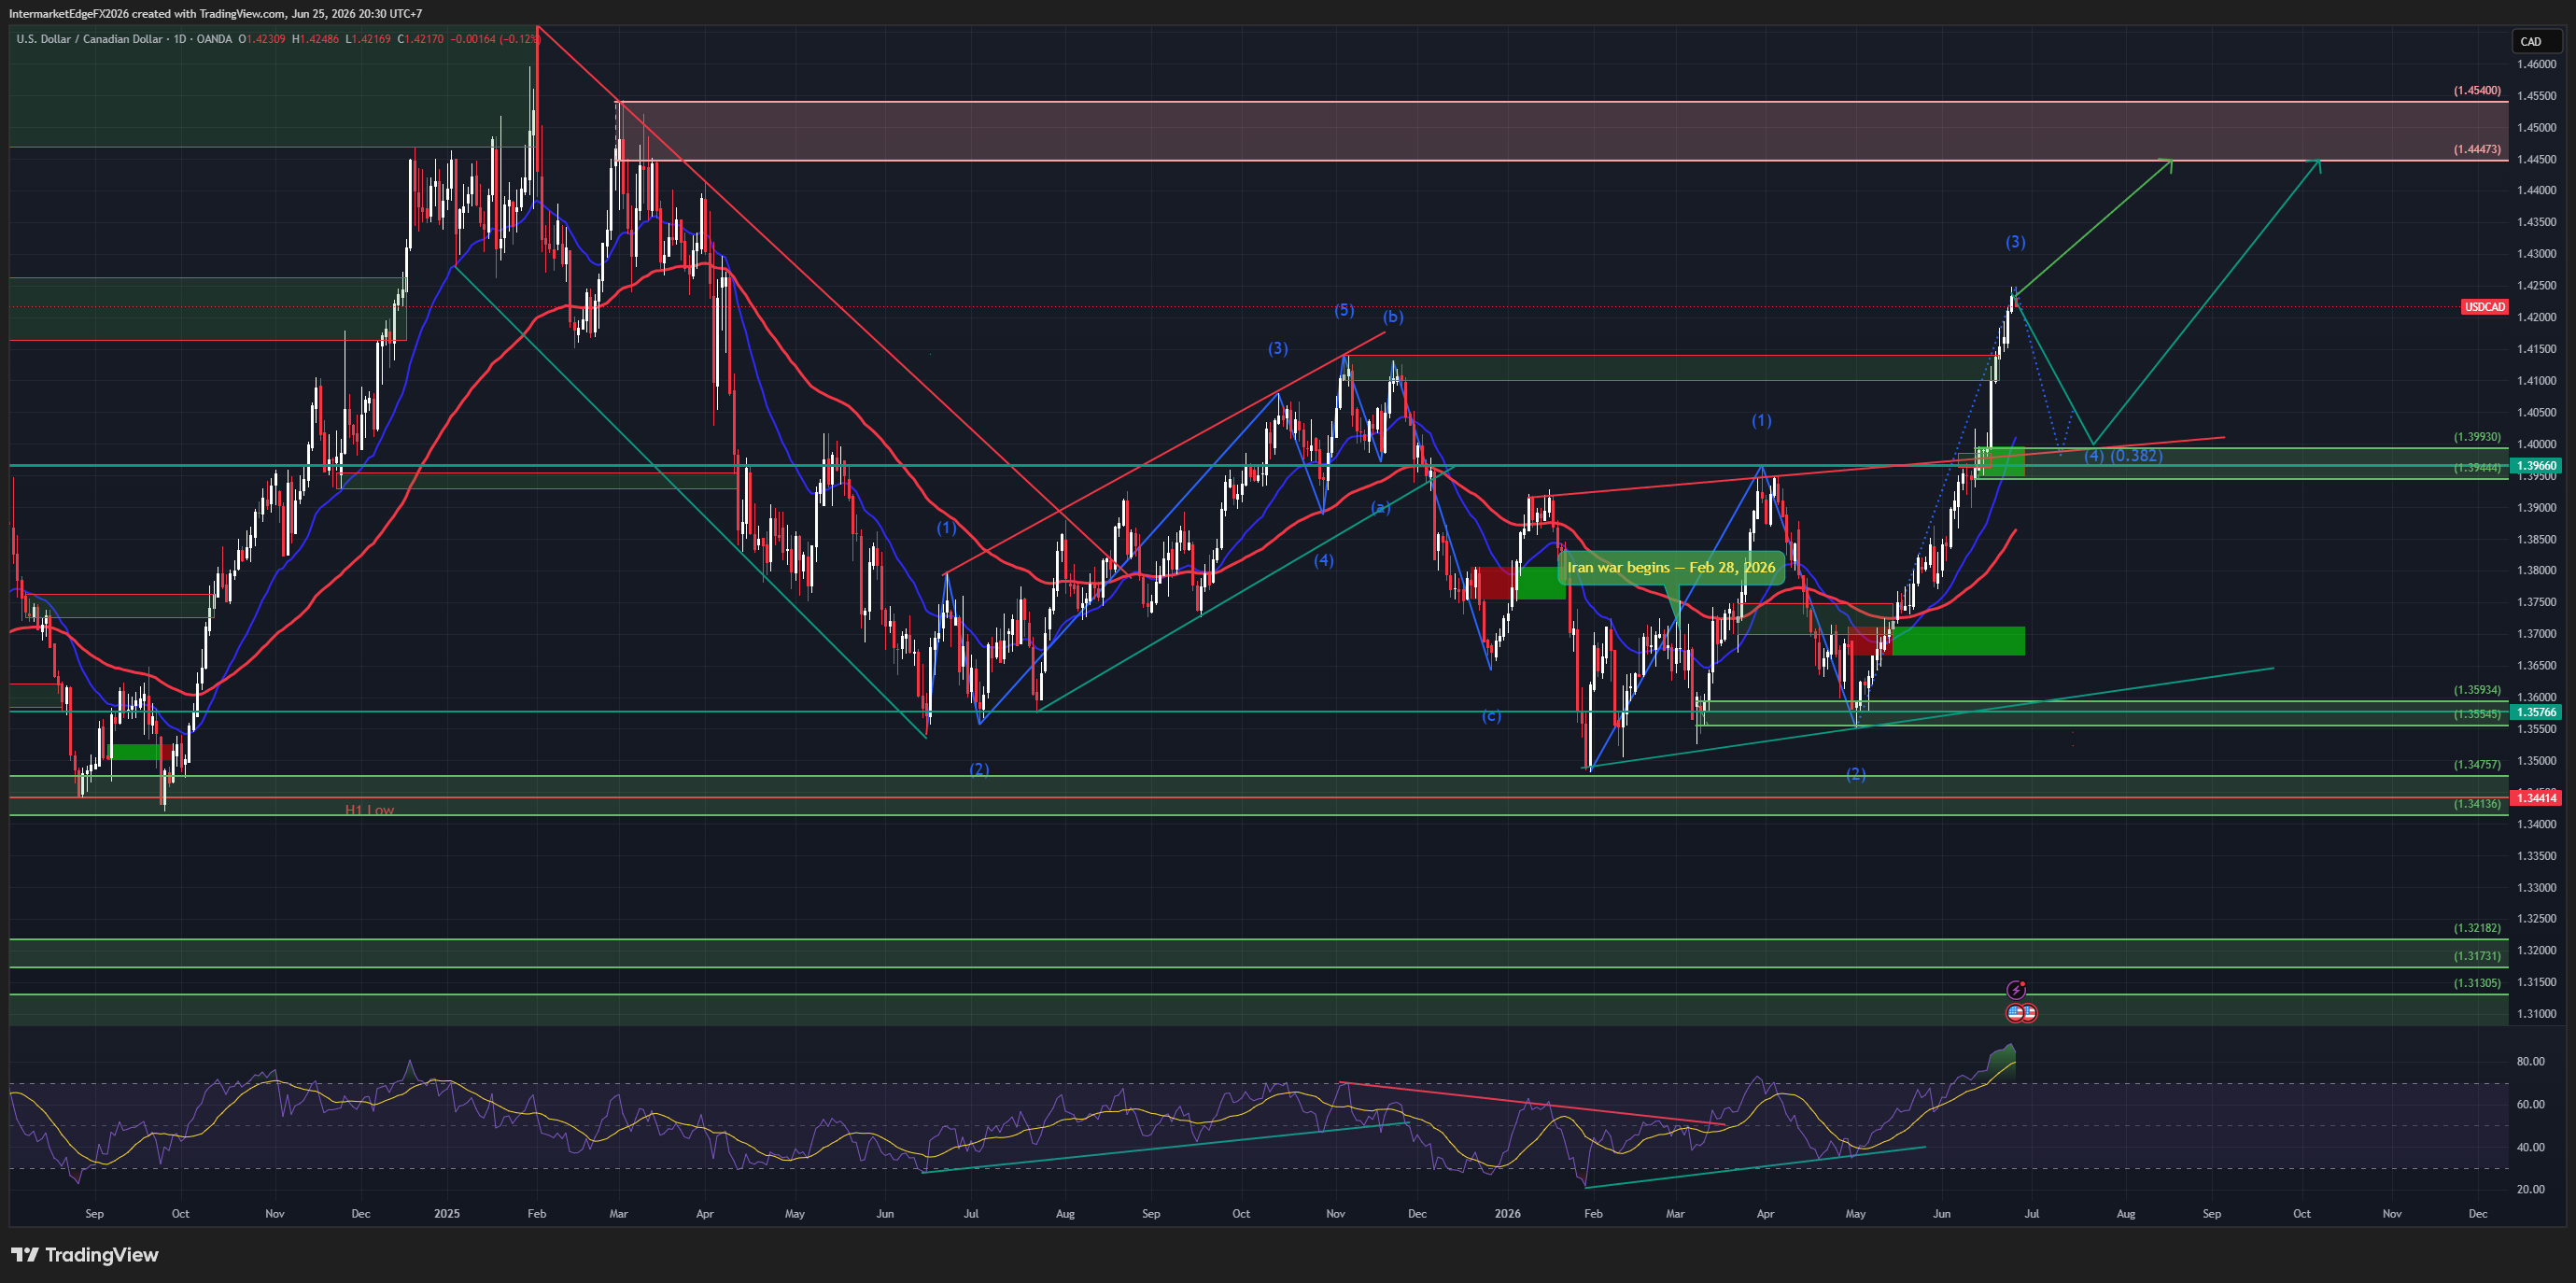
USDCAD 1.4232 | Double squeeze: 13-month DXY high + oil below $70 | 25 June 2026 CAD hits a 14-month low, pressured from both sides simultaneously. USD leg: 13-month high post-hawkish FOMC. CAD leg: oil broke below $70 and the pre-war 71.11 support. When both legs tilt the same way, this is the strongest bullish configuration. BoC Macklem today: not seeing spillovers from higher oil prices into CPI. Implicitly dovish, BoC in no hurry to hike. Canada benchmark yields slipping. CAD at a 14-month low as tech selloff drives safe-haven into USD. AUDUSD at 0.691, broad commodity FX weakness. CAD weakness is not idiosyncratic. D1 structure: wave (3) impulse running. Target 1.4447 then 1.4540. Support 1.4100 then 1.3993. Invalidation: below 1.3476. Three scenarios: → Wave (3) continues to 1.4447 then 1.4540. Probability: 45% → Sub-wave 4 correction to 1.40 then resumes. Probability: 25% → Oil bounces + dovish Fed, drops to 1.39. Probability: 15% The tell: both legs tilting simultaneously. DXY strongest in 13 months, CAD weakest in 14. Not a coincidence. A double squeeze. Conviction: High Bull (upgraded from Med-High). --- Intermarket Edge | Institutional Macro & Intermarket Analysis For informational purposes only. Not financial advice.
EURJPY - Head and Shoulders Confirmed, the DE-JP Carry Collapses to 0.21% as Hawkish BoJ Meets Neutral ECB, Target Neckline 181 Then 171

EURJPY - Head and Shoulders Confirmed, the DE-JP Carry Collapses to 0.21% as Hawkish BoJ Meets Neutral ECB, Target Neckline 181 Then 171

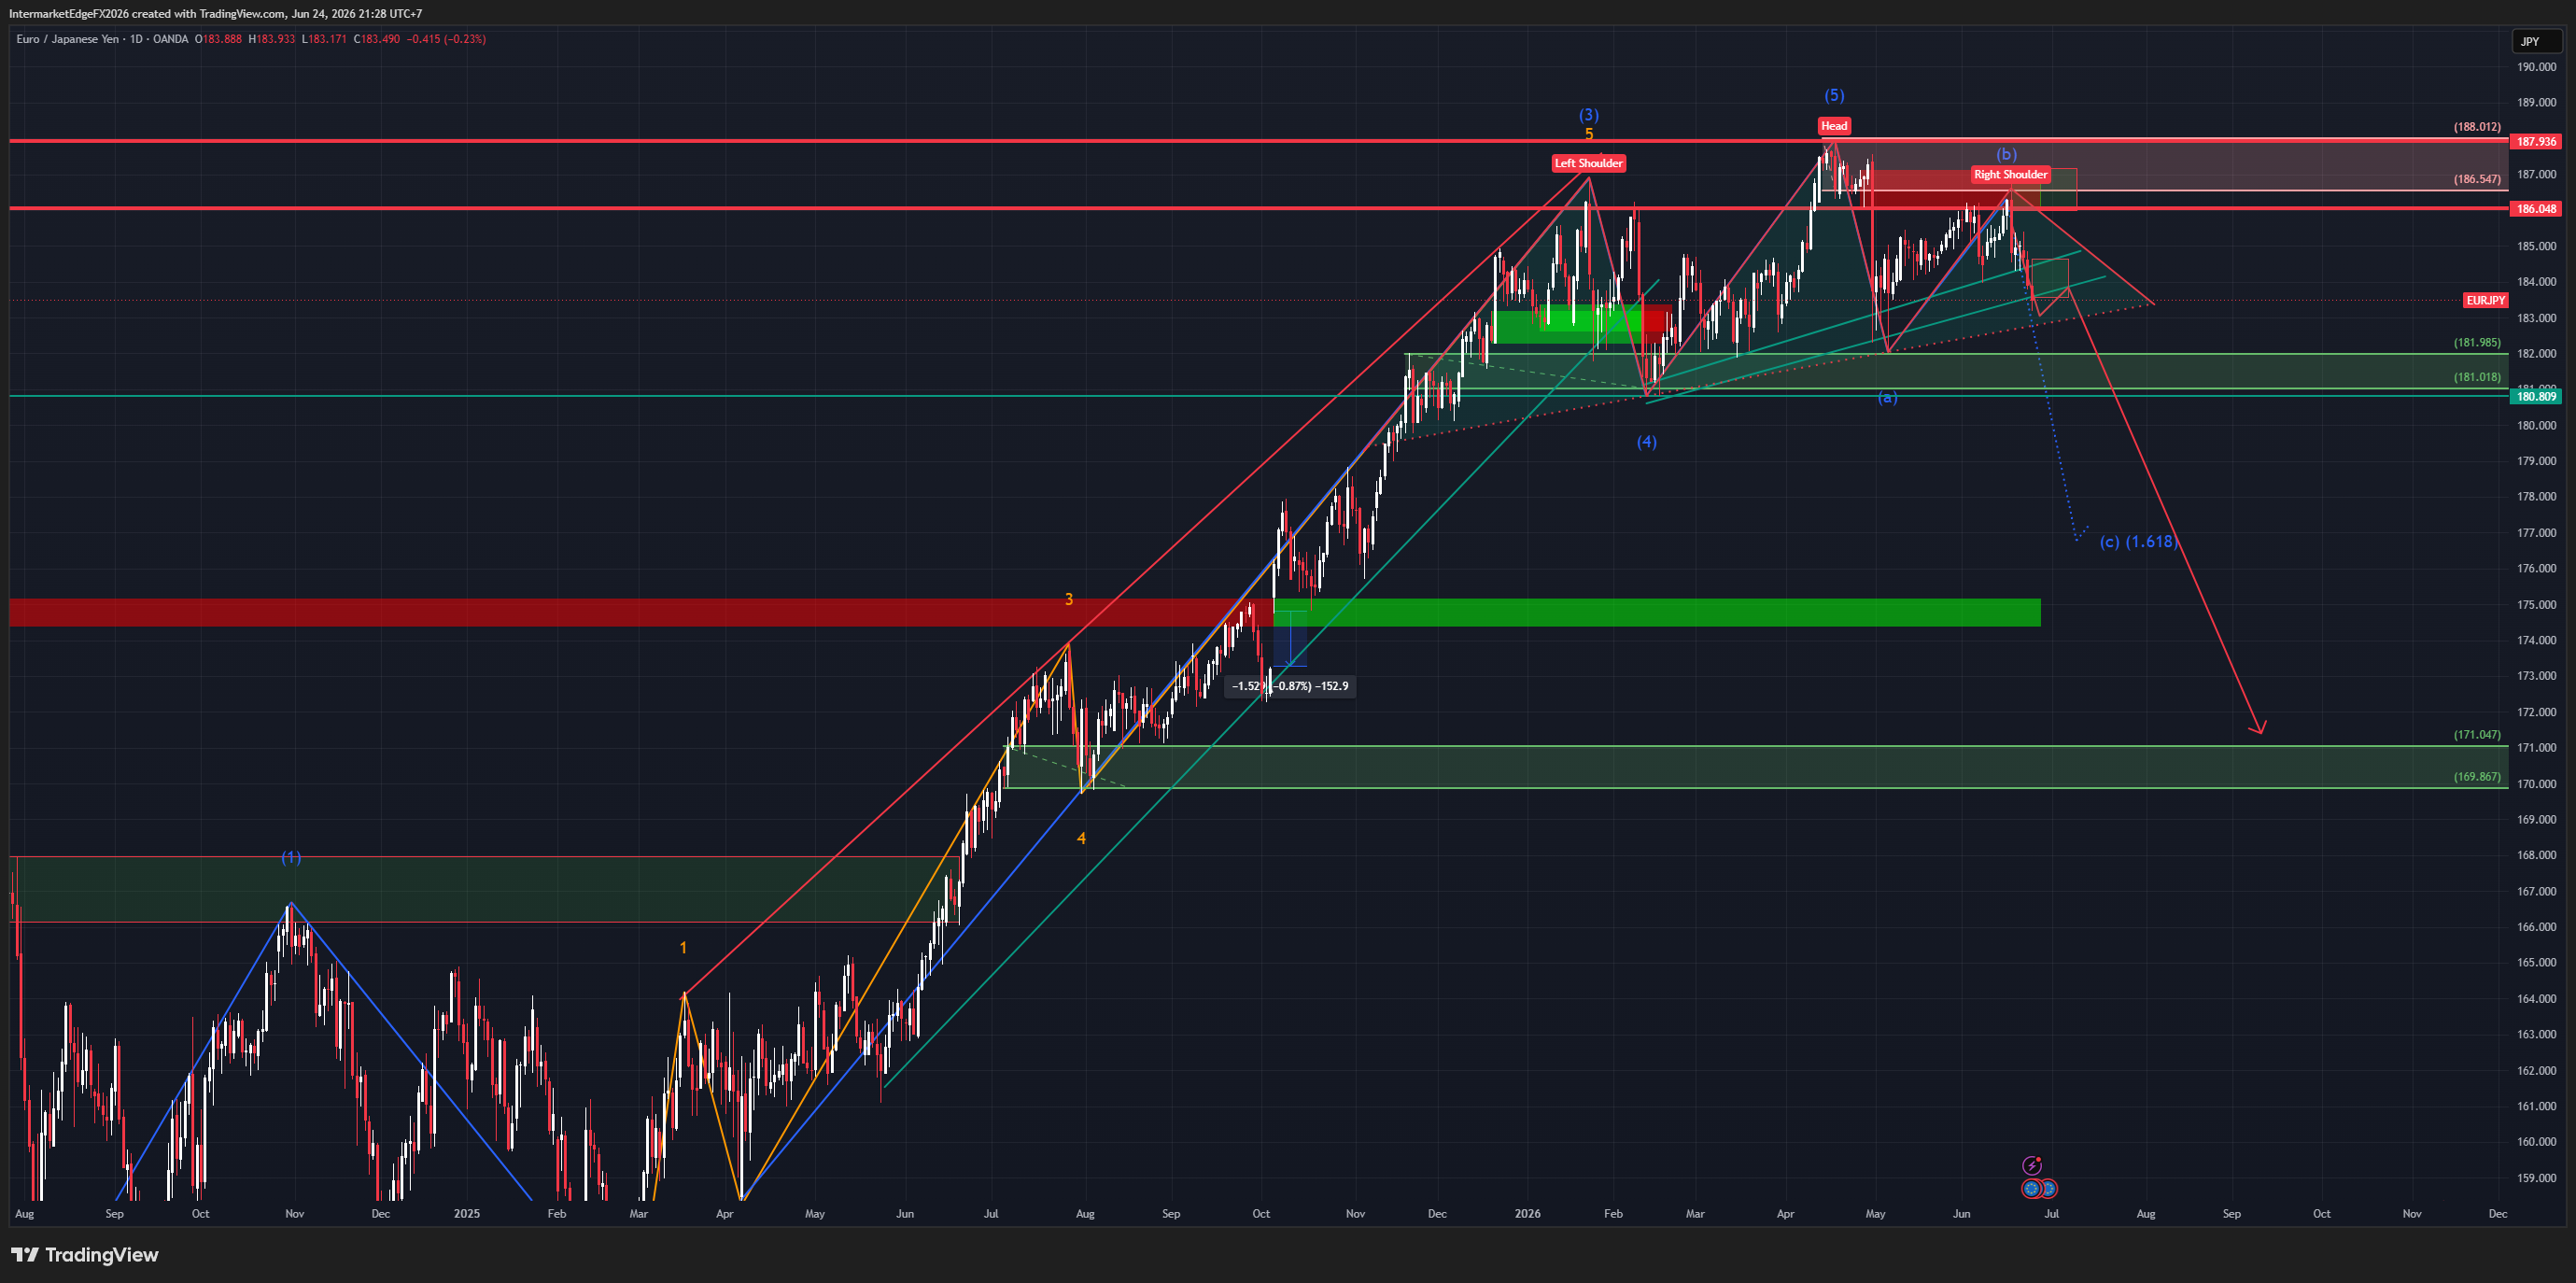
EURJPY 183.465 | H&S confirmed, carry collapses to 0.21% | 24 June 2026 Last week: "RS forming 185.5-186.5." This week: RS completed at 186.547, price left the RS, wave (c) running. H&S confirmed. But the bigger story is the carry. The pipeline shows DE-JP spread at about 1.52%. Entirely wrong. Actual: JP10Y jumped to 2.660% after the BoJ hike, DE10Y fell to 2.870%. The real spread is just +0.210%, near zero. This is the largest correction of all nine instruments this week. When carry vanishes, the top pattern forms naturally. The H&S is the structural consequence. Tokyo CPI June forecast to accelerate on commodity prices -- giving the BoJ grounds to hike further. Markets watching for follow-up. ECB 2.00% neutral, no EUR catalyst. D1 structure: LS ~185.5, Head 188.012, RS 186.547 (completed). Neckline 181. Price 183.465 between RS and neckline. Targets: break neckline 181, wave c 1.618 at 177, H&S measured 171.047, deep 169.867. Three scenarios: → Break neckline 181, target 177. Probability: 40% → Break then H&S measured 171. Probability: 25% → Technical bounce to 185 then resumes lower. Probability: 20% Invalidation: daily close above RS 186.547. The tell: the pipeline shows 1.52% carry. The real number is 0.21%. When the market catches up, the decline accelerates. Conviction: High Bear. --- Intermarket Edge | Institutional Macro & Intermarket Analysis For informational purposes only. Not financial advice.
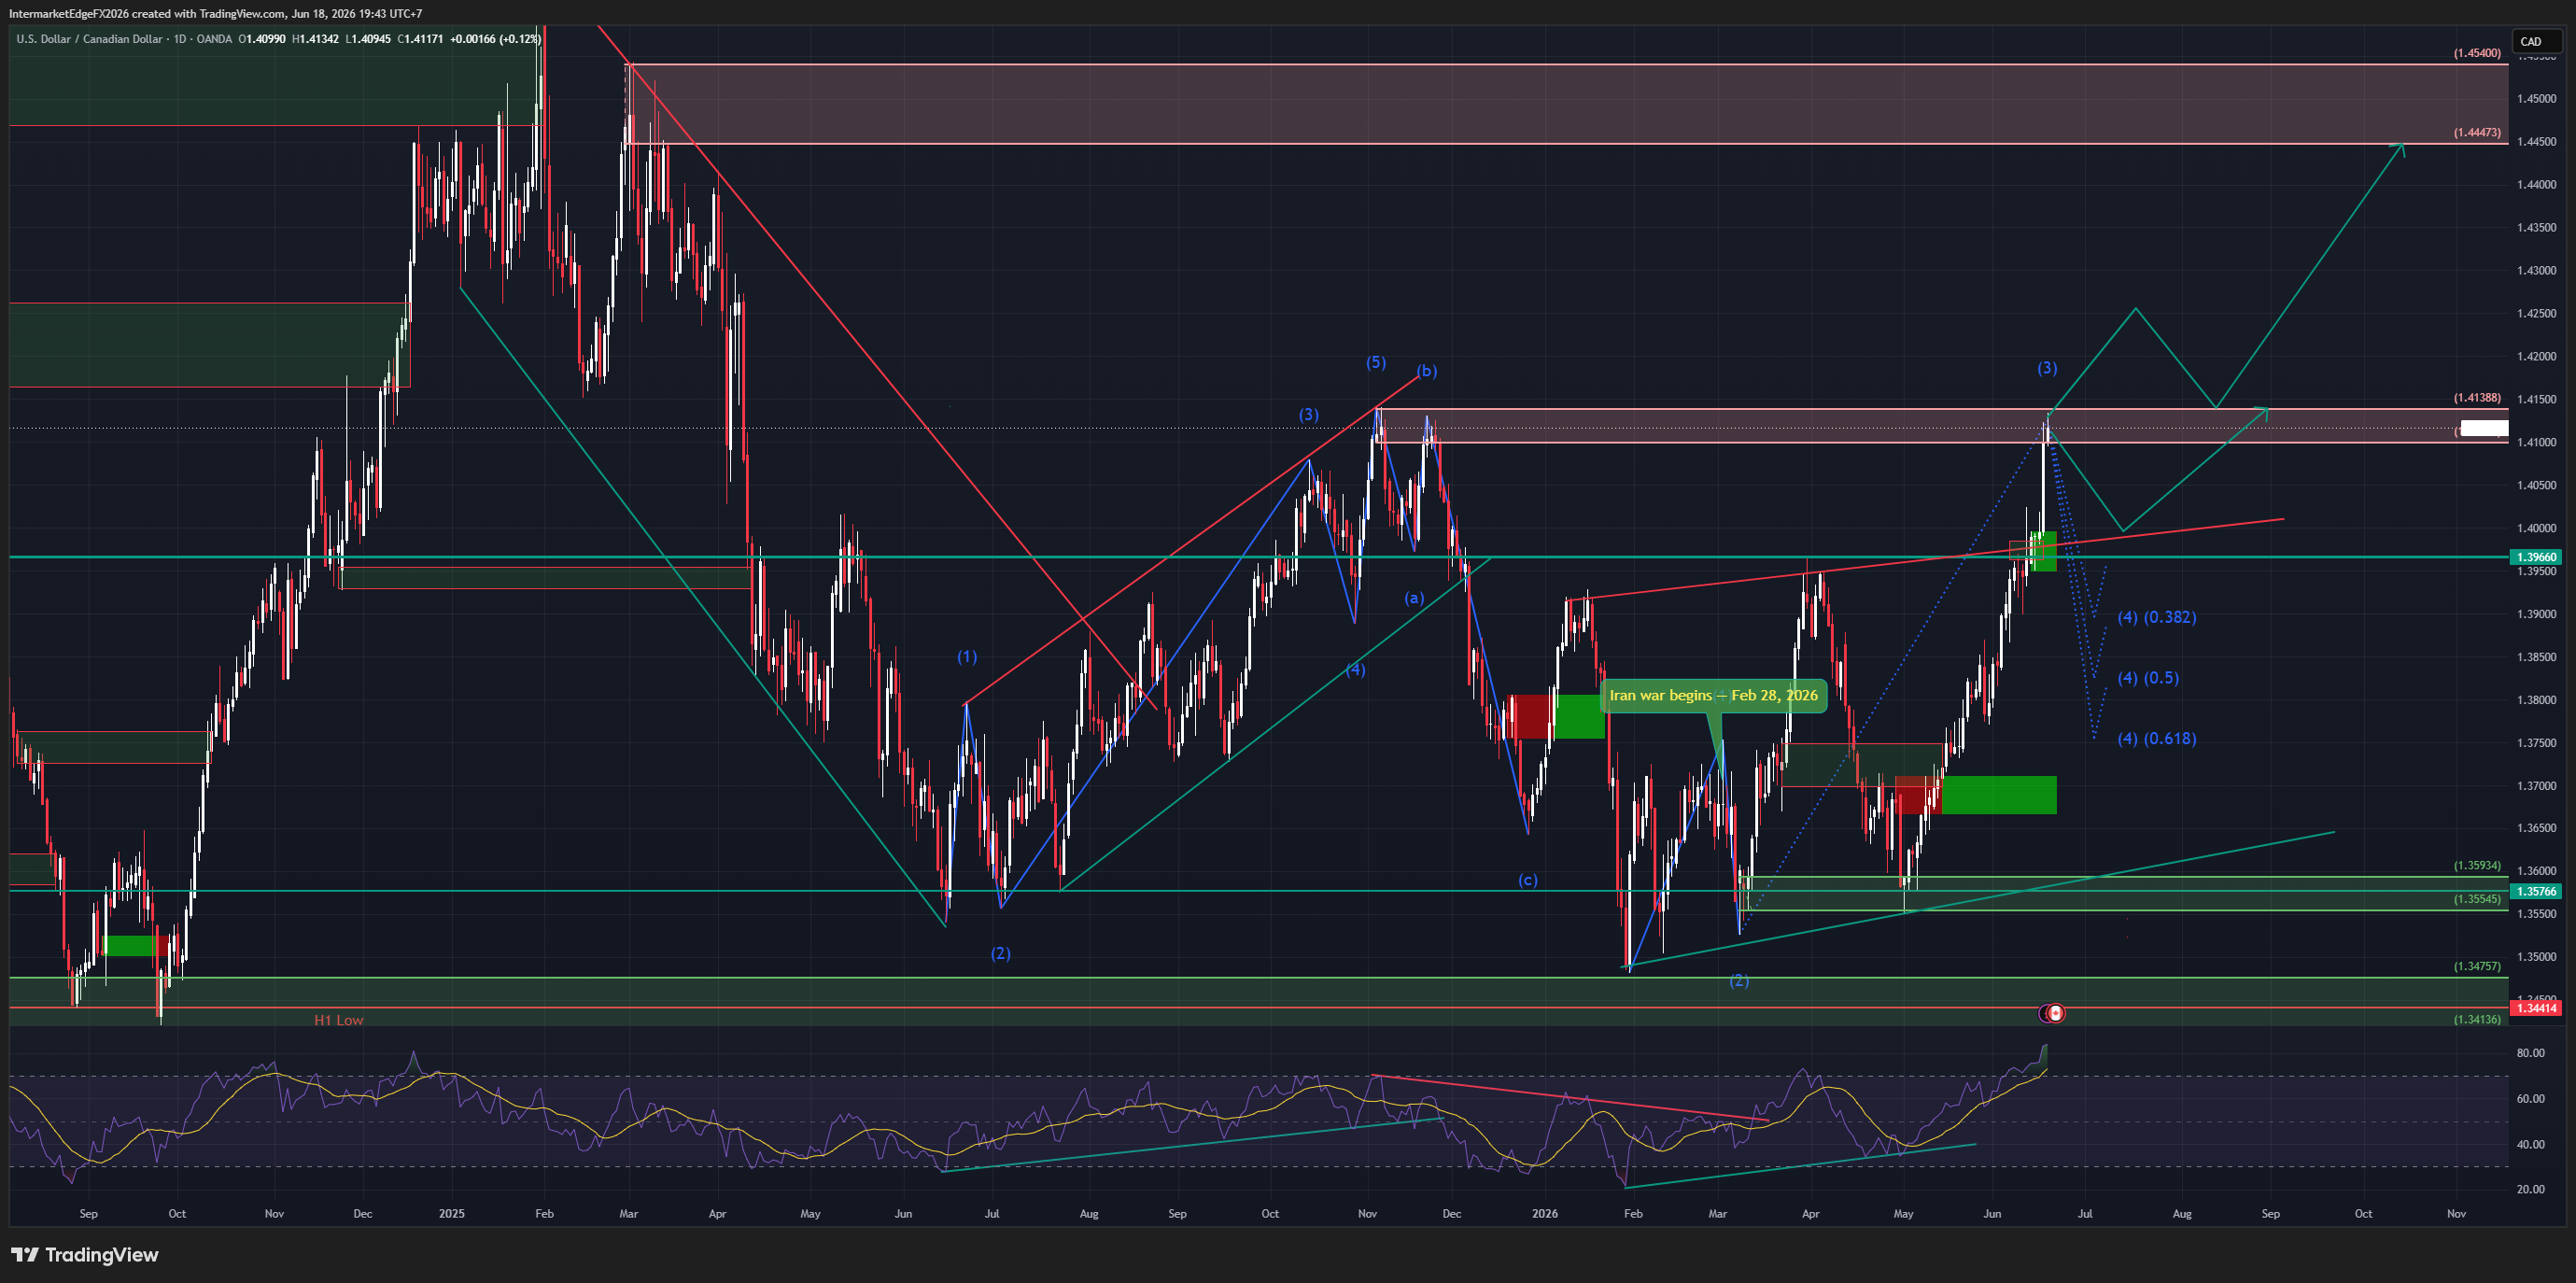
USDCAD - Wave (3) Impulse on Post-FOMC Dollar Strength, CAD at a 7-Month Low, a Wave (4) Pullback Sets Up the Wave (5) Push Toward 1.45

USDCAD - Wave (3) Impulse on Post-FOMC Dollar Strength, CAD at a 7-Month Low, a Wave (4) Pullback Sets Up the Wave (5) Push Toward 1.45

USDCAD 1.4115 | Wave (3) impulse on post-FOMC dollar strength | 18 June 2026 Two currencies moving in opposite directions met in one pair: the Fed projected a hike, and the Canadian dollar hit a 7-month low. The wave count says the big move hasn't started yet. USD leg: the FOMC on 17/06 held rates but projected a hike later in 2026 -- a hawkish dot plot. The dollar extended gains, DXY to a two-month high near 100.6. EUR/GBP/AUD all falling, confirming broad USD strength. CAD leg: the Canadian dollar at a 7-month low (newsfeed: "Canadian Dollar Hits 7-Month Low"). Crude ticked up to 74.46 but stays low after the war premium unwound -- pressure on CAD. The pipeline showed you the wrong numbers. Fed pipeline: "Hold 2026, hike Apr 2027." Actual: hold + projected hike later 2026 (hawkish, done). Pipeline CPI US 2.4%. Actual 4.2%, real yield 0.263%. D1 structure: a bullish Elliott impulse. (1) ~1.38, (2) ~1.347, (3) now ~1.414. Price at 1.4115, just below the 1.41388 resistance. The chart expects a wave (4) pullback to the fib region 1.39 (0.382) / 1.385 (0.5) / 1.378 (0.618), pivot 1.39660. Then wave (5) up to 1.44473 → 1.45400. Three scenarios: → Wave (4) to 1.39-1.385 then wave (5) up to 1.44473. Probability: 40% → Direct break above 1.41388 toward 1.44473, shallow pullback. Probability: 25% → Deeper wave (4) to 1.378 then resume up. Probability: 20% Invalidation: daily close below 1.347 (early warning: a break of 1.378). The tell: the wave (4) pullback. A hold above 1.378 with the dollar firm keeps the path to 1.45 alive. Position around the 1.39-1.385 fib region rather than chasing at the top. Conviction: Medium-High Bull. --- Intermarket Edge | Institutional Macro & Intermarket Analysis For informational purposes only. Not financial advice.
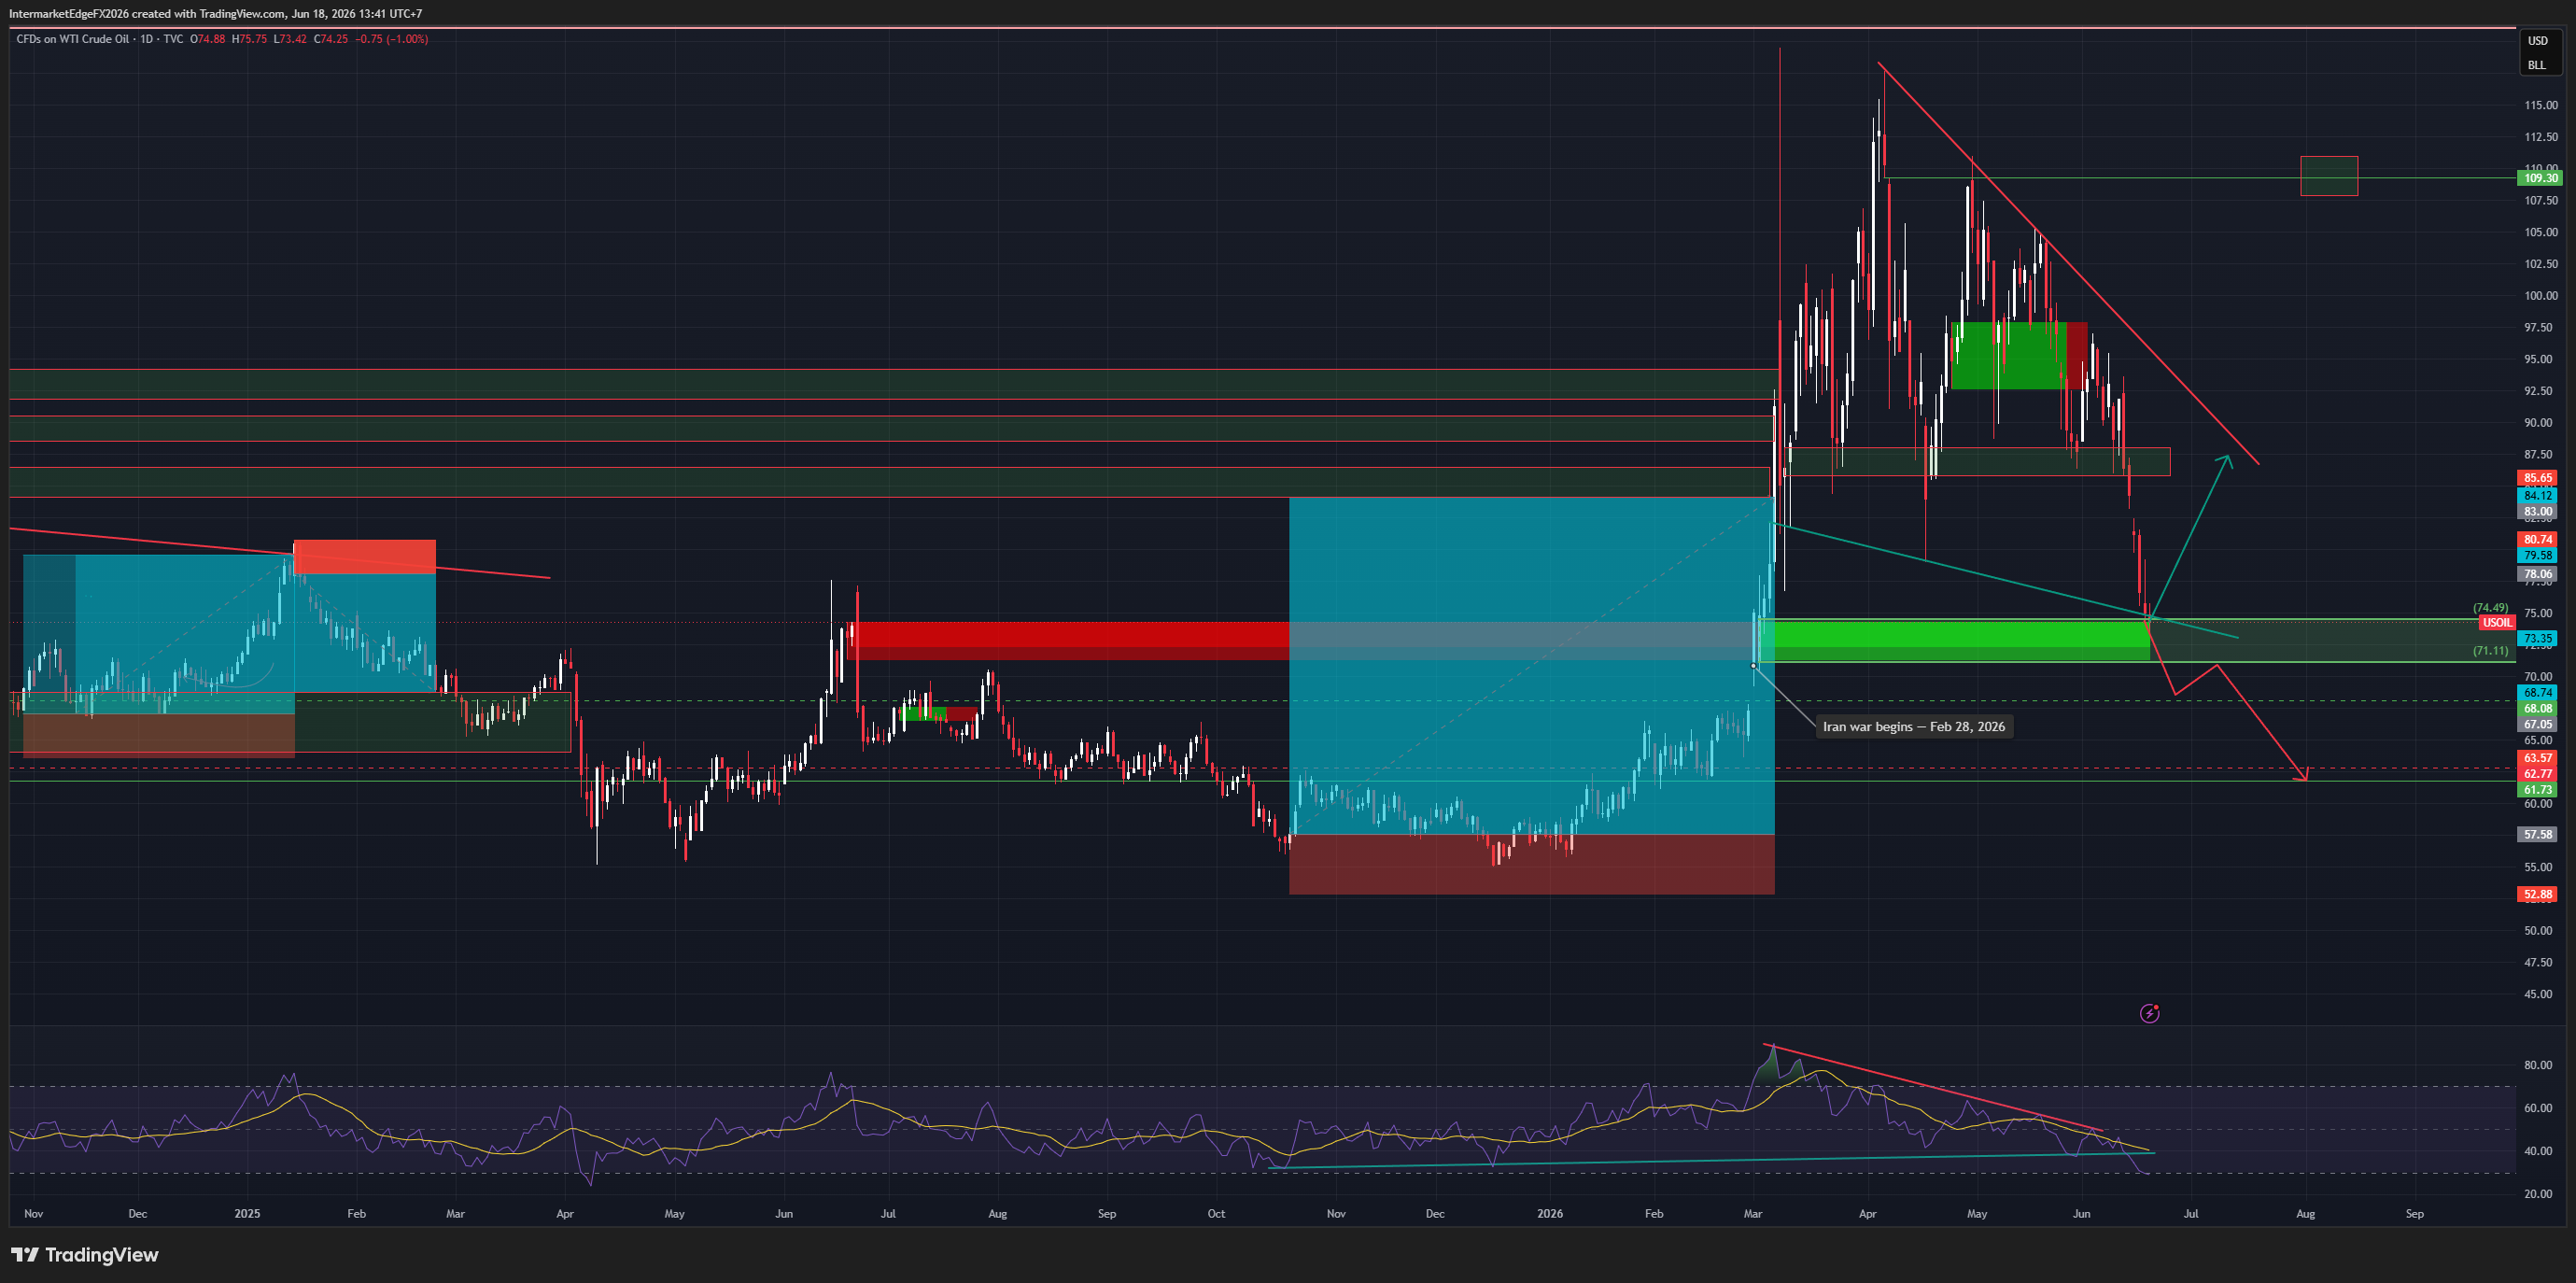
USOIL - The War Premium Fully Unwound to Pre-War Support, a Post-FOMC Bearish Tide Meets a Bullish -8.263M Draw

USOIL - The War Premium Fully Unwound to Pre-War Support, a Post-FOMC Bearish Tide Meets a Bullish -8.263M Draw

USOIL $73.58 | War premium fully unwound to pre-war support | 18 June 2026 Oil has handed back nearly the entire Iran-war rally and returned to where it started. Here, a bearish tide meets a bullish draw. The Iran war broke out Feb 28, lifting oil from ~57-70 to a 120 peak (April). The peace deal and the prospect of a Hormuz reopening have drained the haven premium steadily. Now 73.58, back in the pre-war zone. Last night's hawkish FOMC lifted DXY to ~100, VIX to 18.43, equities lower. A strong dollar plus demand risk is another bearish layer for oil. Add OPEC+ raising +411kbpd. But against the tide: the EIA draw was -8.263M (forecast just -3.6M, prior -7.227M). US supply is tightening -- a real support. The newsfeed agrees: "Tightness in US Crude Supplies Supports Prices." The pipeline showed you the wrong field. Pipeline EIA: "awaiting release." Actual: -8.263M. DXY now ~100 (jumped post-FOMC). D1 structure: key support 74.49-71.11 (pre-war zone). Resistance 78.06 → 80.74. A break of 71.11 opens 67-68 → 63.57. Three scenarios: → Hold 71.11 + inventory tightness: technical bounce toward 78-80. Probability: 35% → Break 71.11 (Hormuz fully reopens + OPEC + strong dollar): toward 67 then 63. Probability: 35% → Standoff, bearish macro vs bullish draw: 71-78. Probability: 30% Invalidation: daily close above 80.74. The tell: the 71.11 support against the inventory draws. A break with Hormuz fully reopening sends oil to 67; a hold on tightness bounces it to 78. Do not chase shorts into 71.11. Conviction: Medium Bear at support, two-sided. Intermarket Edge | Institutional Macro & Intermarket Analysis For informational purposes only. Not financial advice.
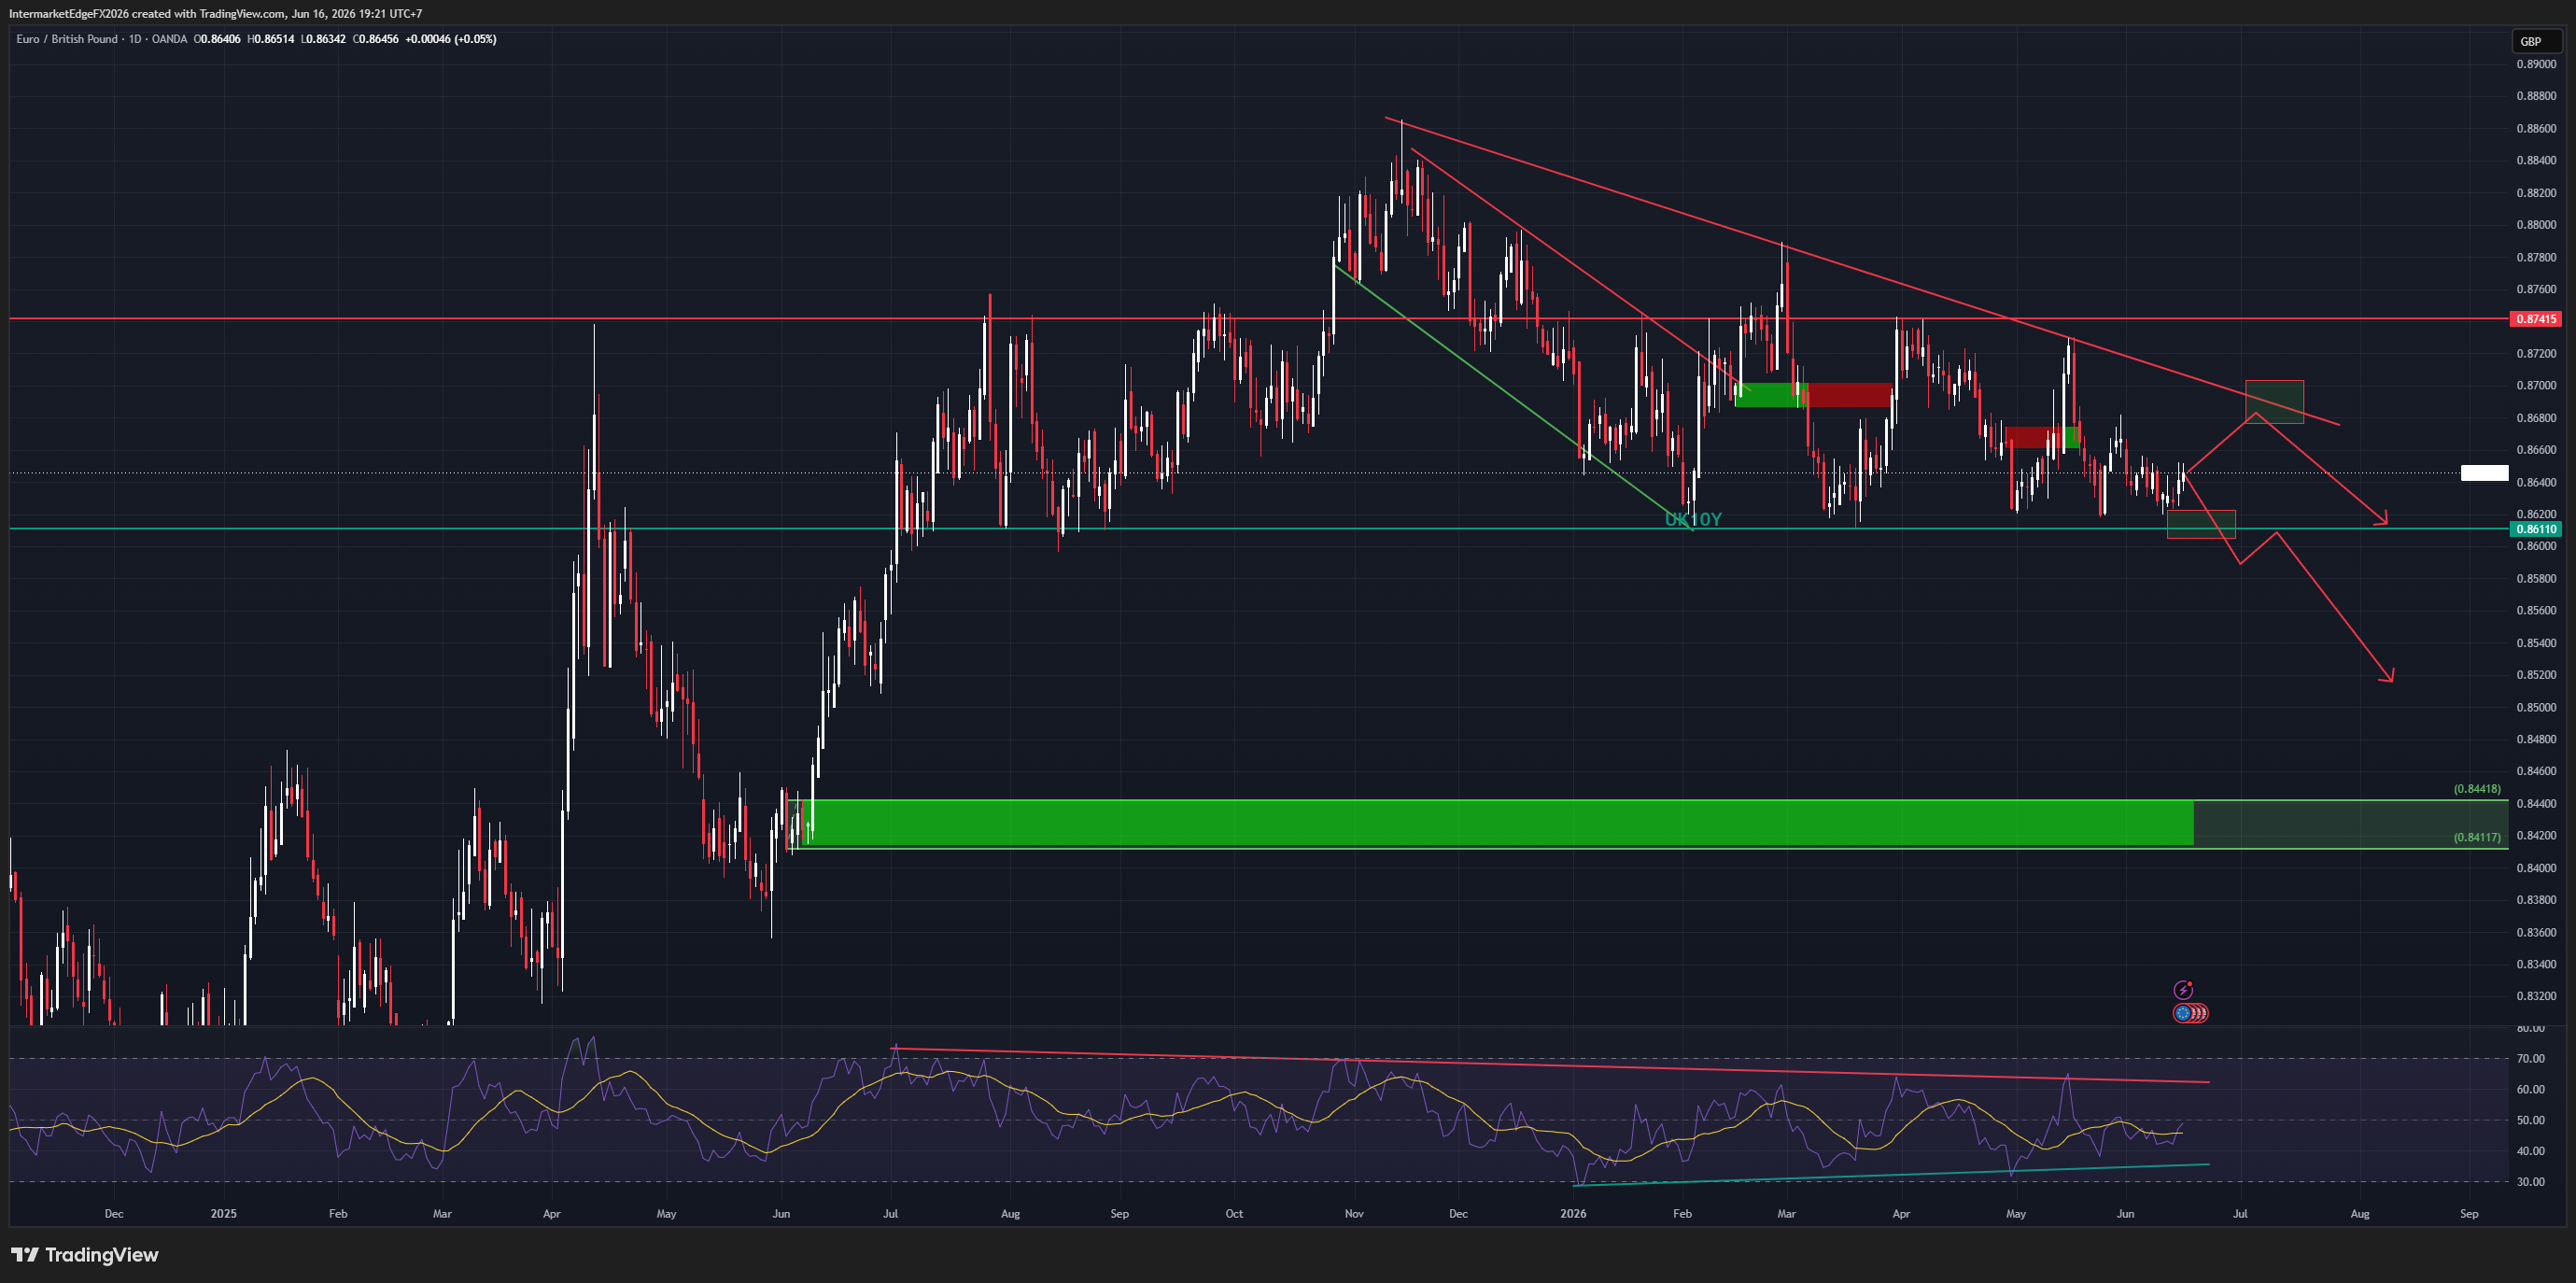
EURGBP - GBP Carry Advantage Drives the Descending Channel, ECB Neutral-Hawkish Hold the Lone EUR Counterweight

EURGBP - GBP Carry Advantage Drives the Descending Channel, ECB Neutral-Hawkish Hold the Lone EUR Counterweight

EURGBP 0.8646 | GBP carry advantage drives the channel | 16 June 2026 Many read the EURGBP decline as euro weakness. The reverse is true. This is a sterling-strength story, not a euro collapse. The ECB completed its eighth cut to 2.00% and shifted to a neutral, slightly hawkish-leaning hold. The market no longer prices deep cuts -- that is neutral-to-mildly bullish for the euro. The euro leg is not weak. The real driver is yield. UK10Y at 4.784% sits above DE10Y at 2.922% by 1.862 percentage points. That wide gap, plus the BoE holding above the ECB, is a carry advantage tilted to sterling. The newsfeed confirms: "Sterling steady... focus turns to UK data and BoE." The pipeline is showing you the wrong numbers. Pipeline UK10Y: 4.50% (stale). Actual: 4.784%. Pipeline ECB: 2.50%, still cutting. Actual: 2.00%, neutral hold. D1 structure: a descending channel from the 0.888 high (Nov 2025). Now 0.8646, below the 0.87415 resistance, approaching the 0.86110 support. Target: 0.84418 → 0.84117. Three scenarios: → Break below 0.86110: activates the 0.84418 target. Probability: 40% → Bounce to test 0.869 then resume lower. Probability: 25% → Surprise dovish BoE: EURGBP bounces to 0.87415. Probability: 20% Invalidation: daily close above 0.87415. The tell: the upcoming BoE meeting. A higher-for-longer BoE keeps sterling's 1.86% yield edge intact and the channel pointing down. Conviction: Medium-High Bear. Intermarket Edge | Institutional Macro & Intermarket Analysis For informational purposes only. Not financial advice.
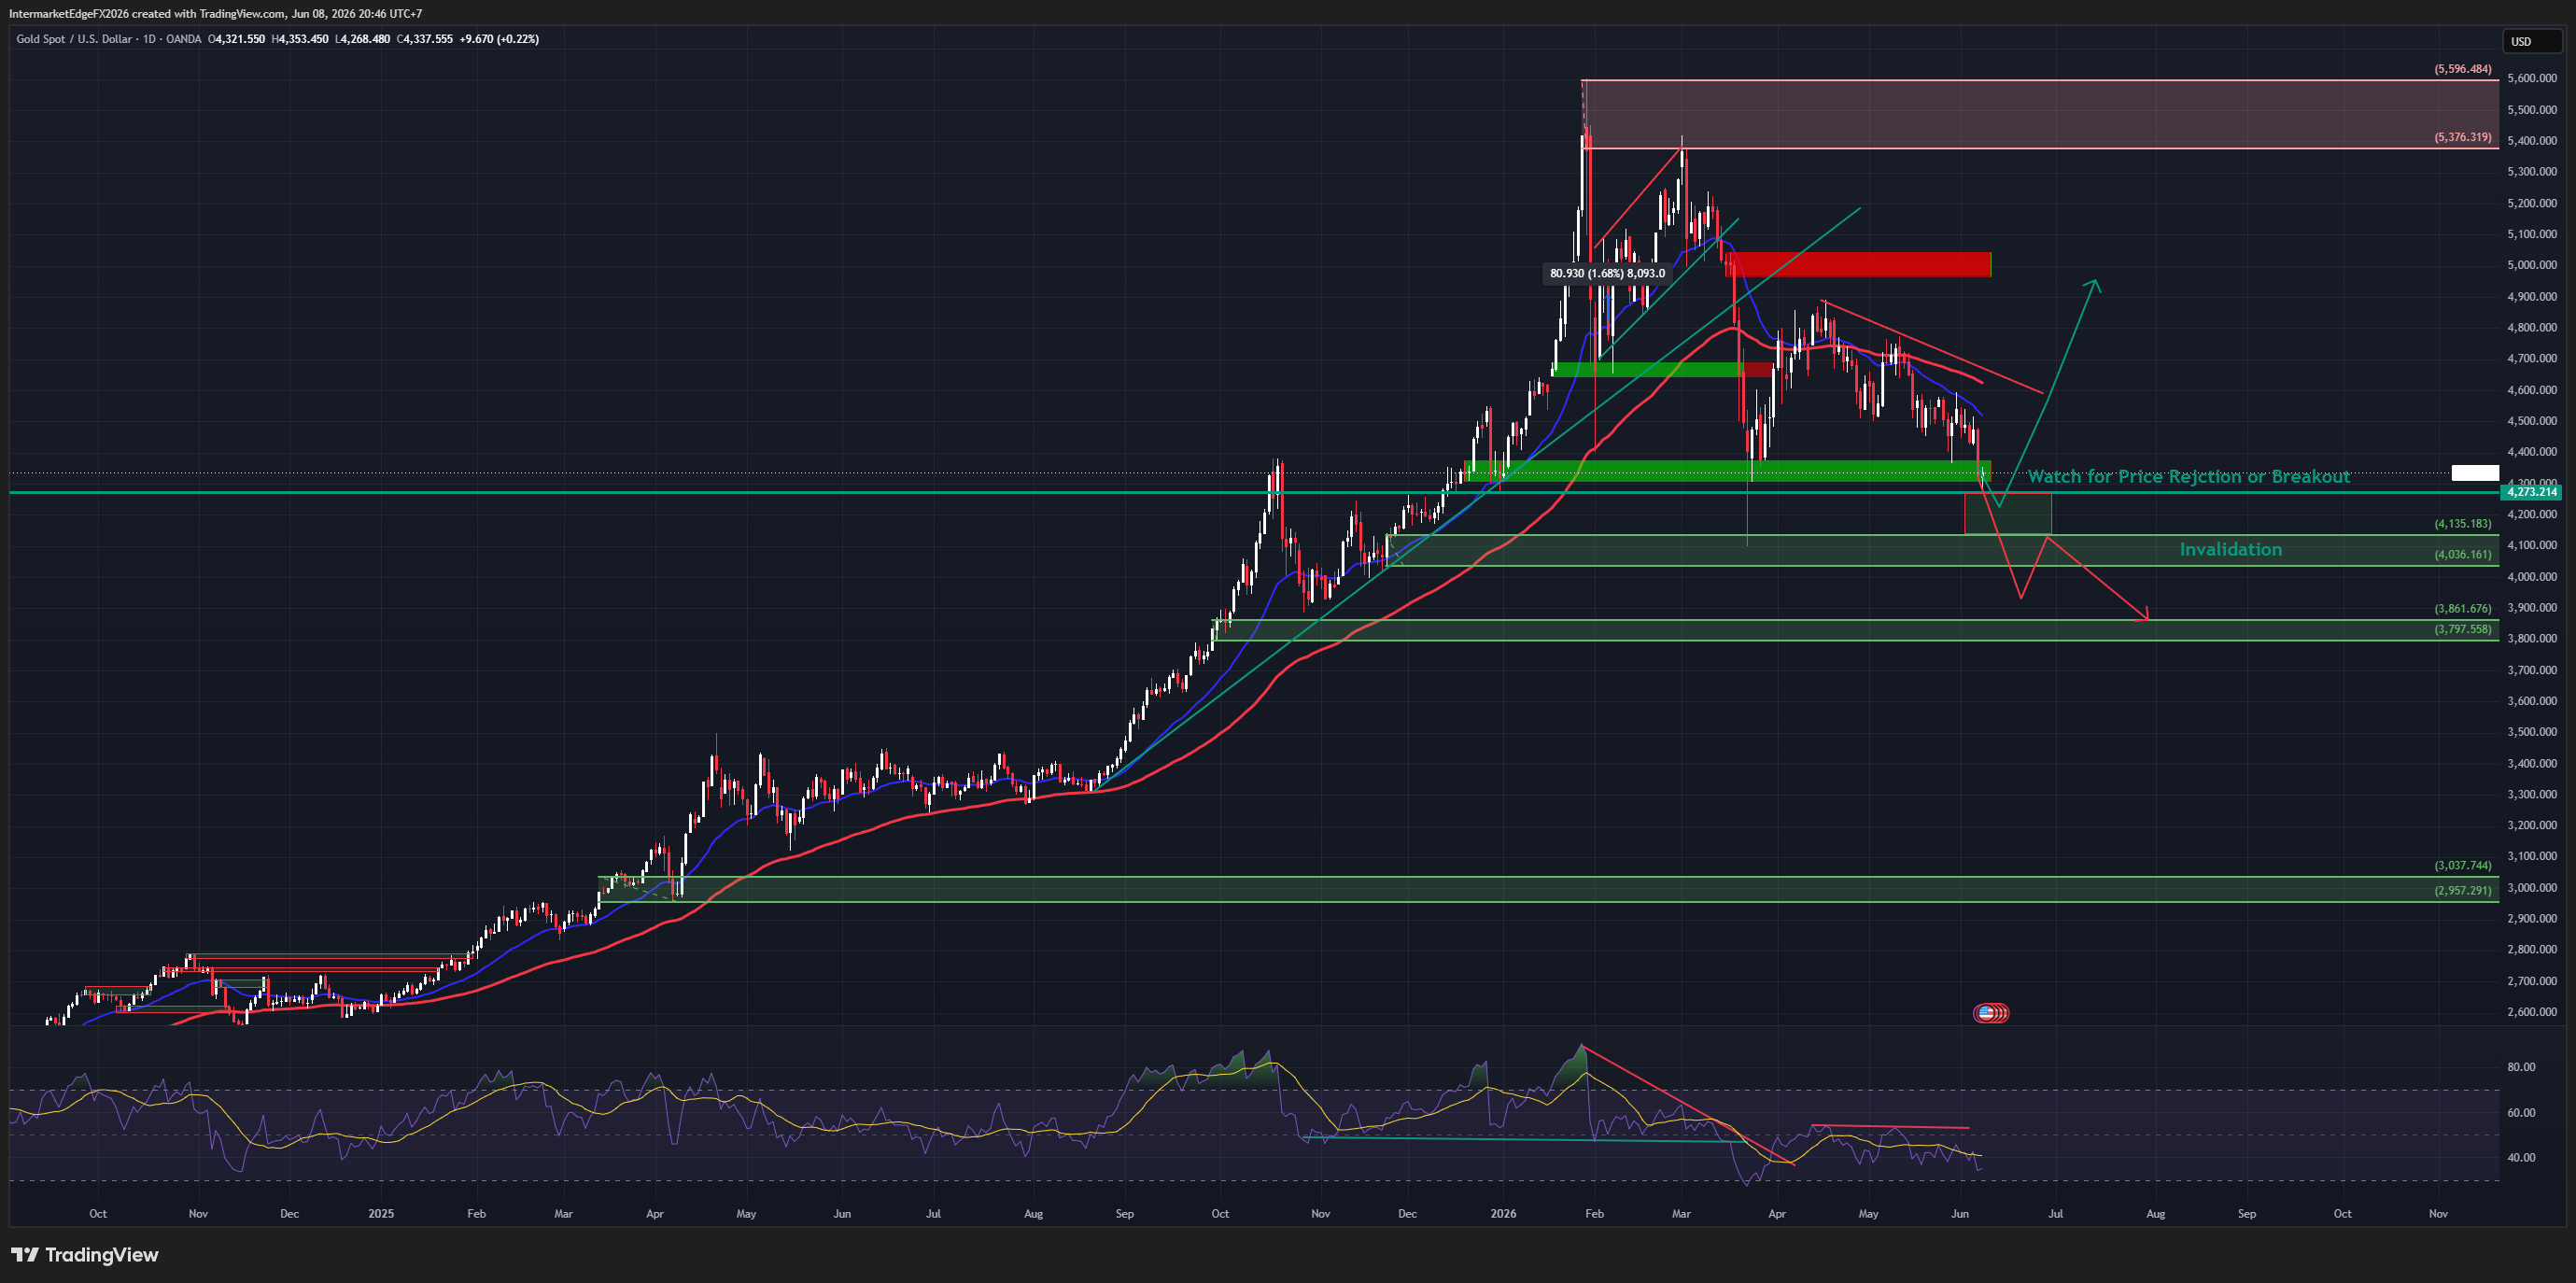
XAUUSD — Why War Is Bearish for Gold, NFP at 172K Flips the Rate Hike to 74% Probability, and the $4,296 Support Is the Last Line

XAUUSD — Why War Is Bearish for Gold, NFP at 172K Flips the Rate Hike to 74% Probability, and the $4,296 Support Is the Last Line

XAUUSD $4,355 | NFP 172K | Hike odds 74.8% | 08 June 2026 Gold hit $4,268 today — its lowest price in more than two months. The safe-haven role has been taken by the US dollar, drawing additional support from higher Treasury yields. FXStreet May NFP came in at 172,000 — nearly double the 85K forecast. Fed hike probability has jumped from 53.5% last week to 74.8% today. Before the NFP report, odds of a 2026 hike were about 50%. Now they're about 70%, making a hike the market's base case. MarketPulse The most important insight: in this regime, war is bearish for gold — not bullish. The mechanism: Iran-Israel re-escalation → oil spike → inflation re-acceleration → Fed hike probability surges → real yields rise → dollar strengthens → gold falls. The renewed war is driving up oil and making people afraid of inflation — not making them want to buy gold as a safe haven. MarketPulse Real yield corrected: 0.724% — still below the 1% structural threshold. CB accumulation (PBoC 17+ months, Poland +14t) provides a structural floor. The structural bull case is under pressure but not broken. XAU/USD has fallen below the key 200-day SMA — first time since the Iran war began. FXStreet Support: $4,135-$4,296. Invalidation: daily close below $4,036-$4,061. Do not add directional exposure before CPI Wednesday June 11. Conviction: Medium-High Bear (tactical), Conditionally Bullish (structural).

DXY — Iran Strikes Israel, Warsh Declares Independence, and the Deal Decompression Narrative Is Dead

DXY — Iran Strikes Israel, Warsh Declares Independence, and the Deal Decompression Narrative Is Dead

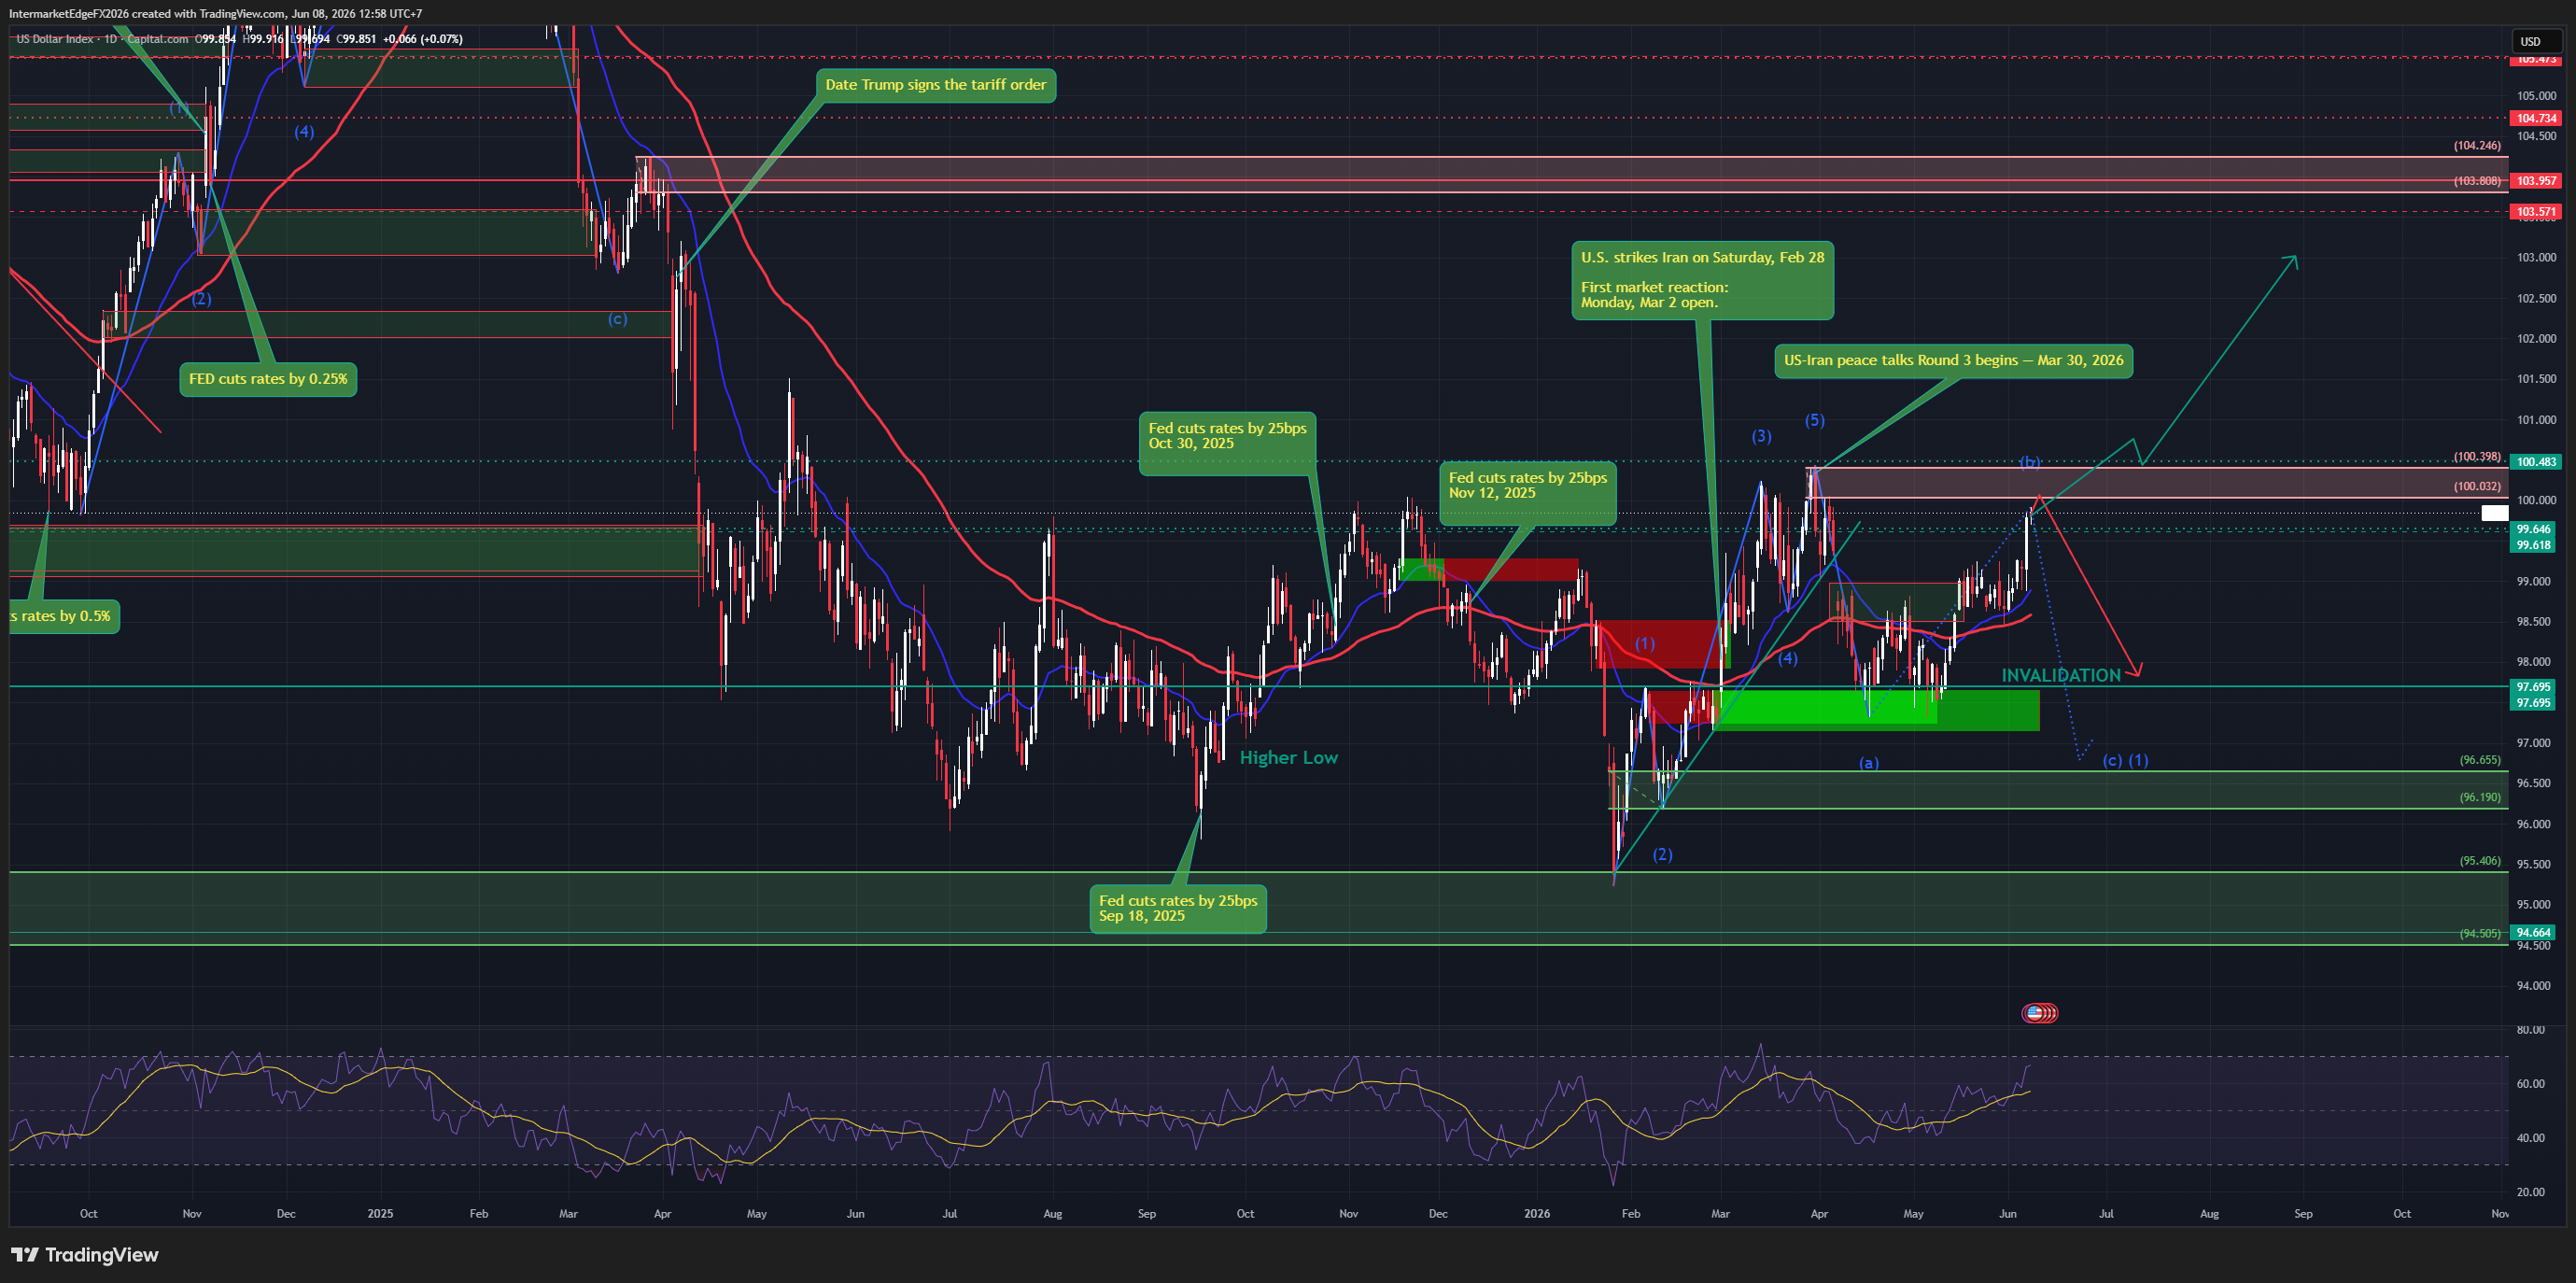
DXY 99.971 | VIX 21.57 | 08 June 2026 The deal decompression narrative is dead. Three weeks of DXY Medium Bear analysis has been overridden in a single weekend. On Sunday night, Iran launched multiple barrages of ballistic missiles toward Israel — the first bombardment since the fragile April 8 ceasefire. Israel struck back on Monday with airstrikes on central and western Iran, while a US military base in Saudi Arabia came under fire in the most serious exchange of hostilities since the ceasefire. Brent has rebounded from $91.69 to $96.99. VIX has spiked from 15.73 to 21.57. S&P 500 is down 200 points. DXY is surging toward the 100.40 invalidation level that, if closed above on a daily basis, formally terminates the Medium Bear framework. Yahoo FinanceMarketPulse The second driver is Warsh. At his Senate confirmation hearing, the new Fed chair framed political pressure as a "test of independence rather than a threat" and committed the Fed to operating on "best assessment of what will serve the public rather than the preferences of the president." EY-Parthenon chief economist notes the June 16-17 FOMC "could acknowledge it may have to hike rates if inflation remains above the 2% target." With May NFP beating at an estimated 130-160K and oil re-accelerating on Iran-Israel, the hike probability has moved from tail to meaningful base case. Investing.com Real yield corrected: 0.736%. Still below 1% structural threshold — but the tactical safe-haven bid and inflation re-acceleration are overriding it. Invalidation of bear count: daily close above 100.40. Bull targets if invalidation: 101.00 → 101.50. Bear survives if: Iran-Israel de-escalates within 48-72 hours. Warsh FOMC June 16-17 is the gating event. Conviction: Medium-High Bull.

EURJPY: Japan Yen Nears Intervention Zone; Dollar Steady as Traders Watch Iran - EURJPY Stands at the Crossroads of the Week's Three Biggest Narratives

EURJPY: Japan Yen Nears Intervention Zone; Dollar Steady as Traders Watch Iran - EURJPY Stands at the Crossroads of the Week's Three Biggest Narratives

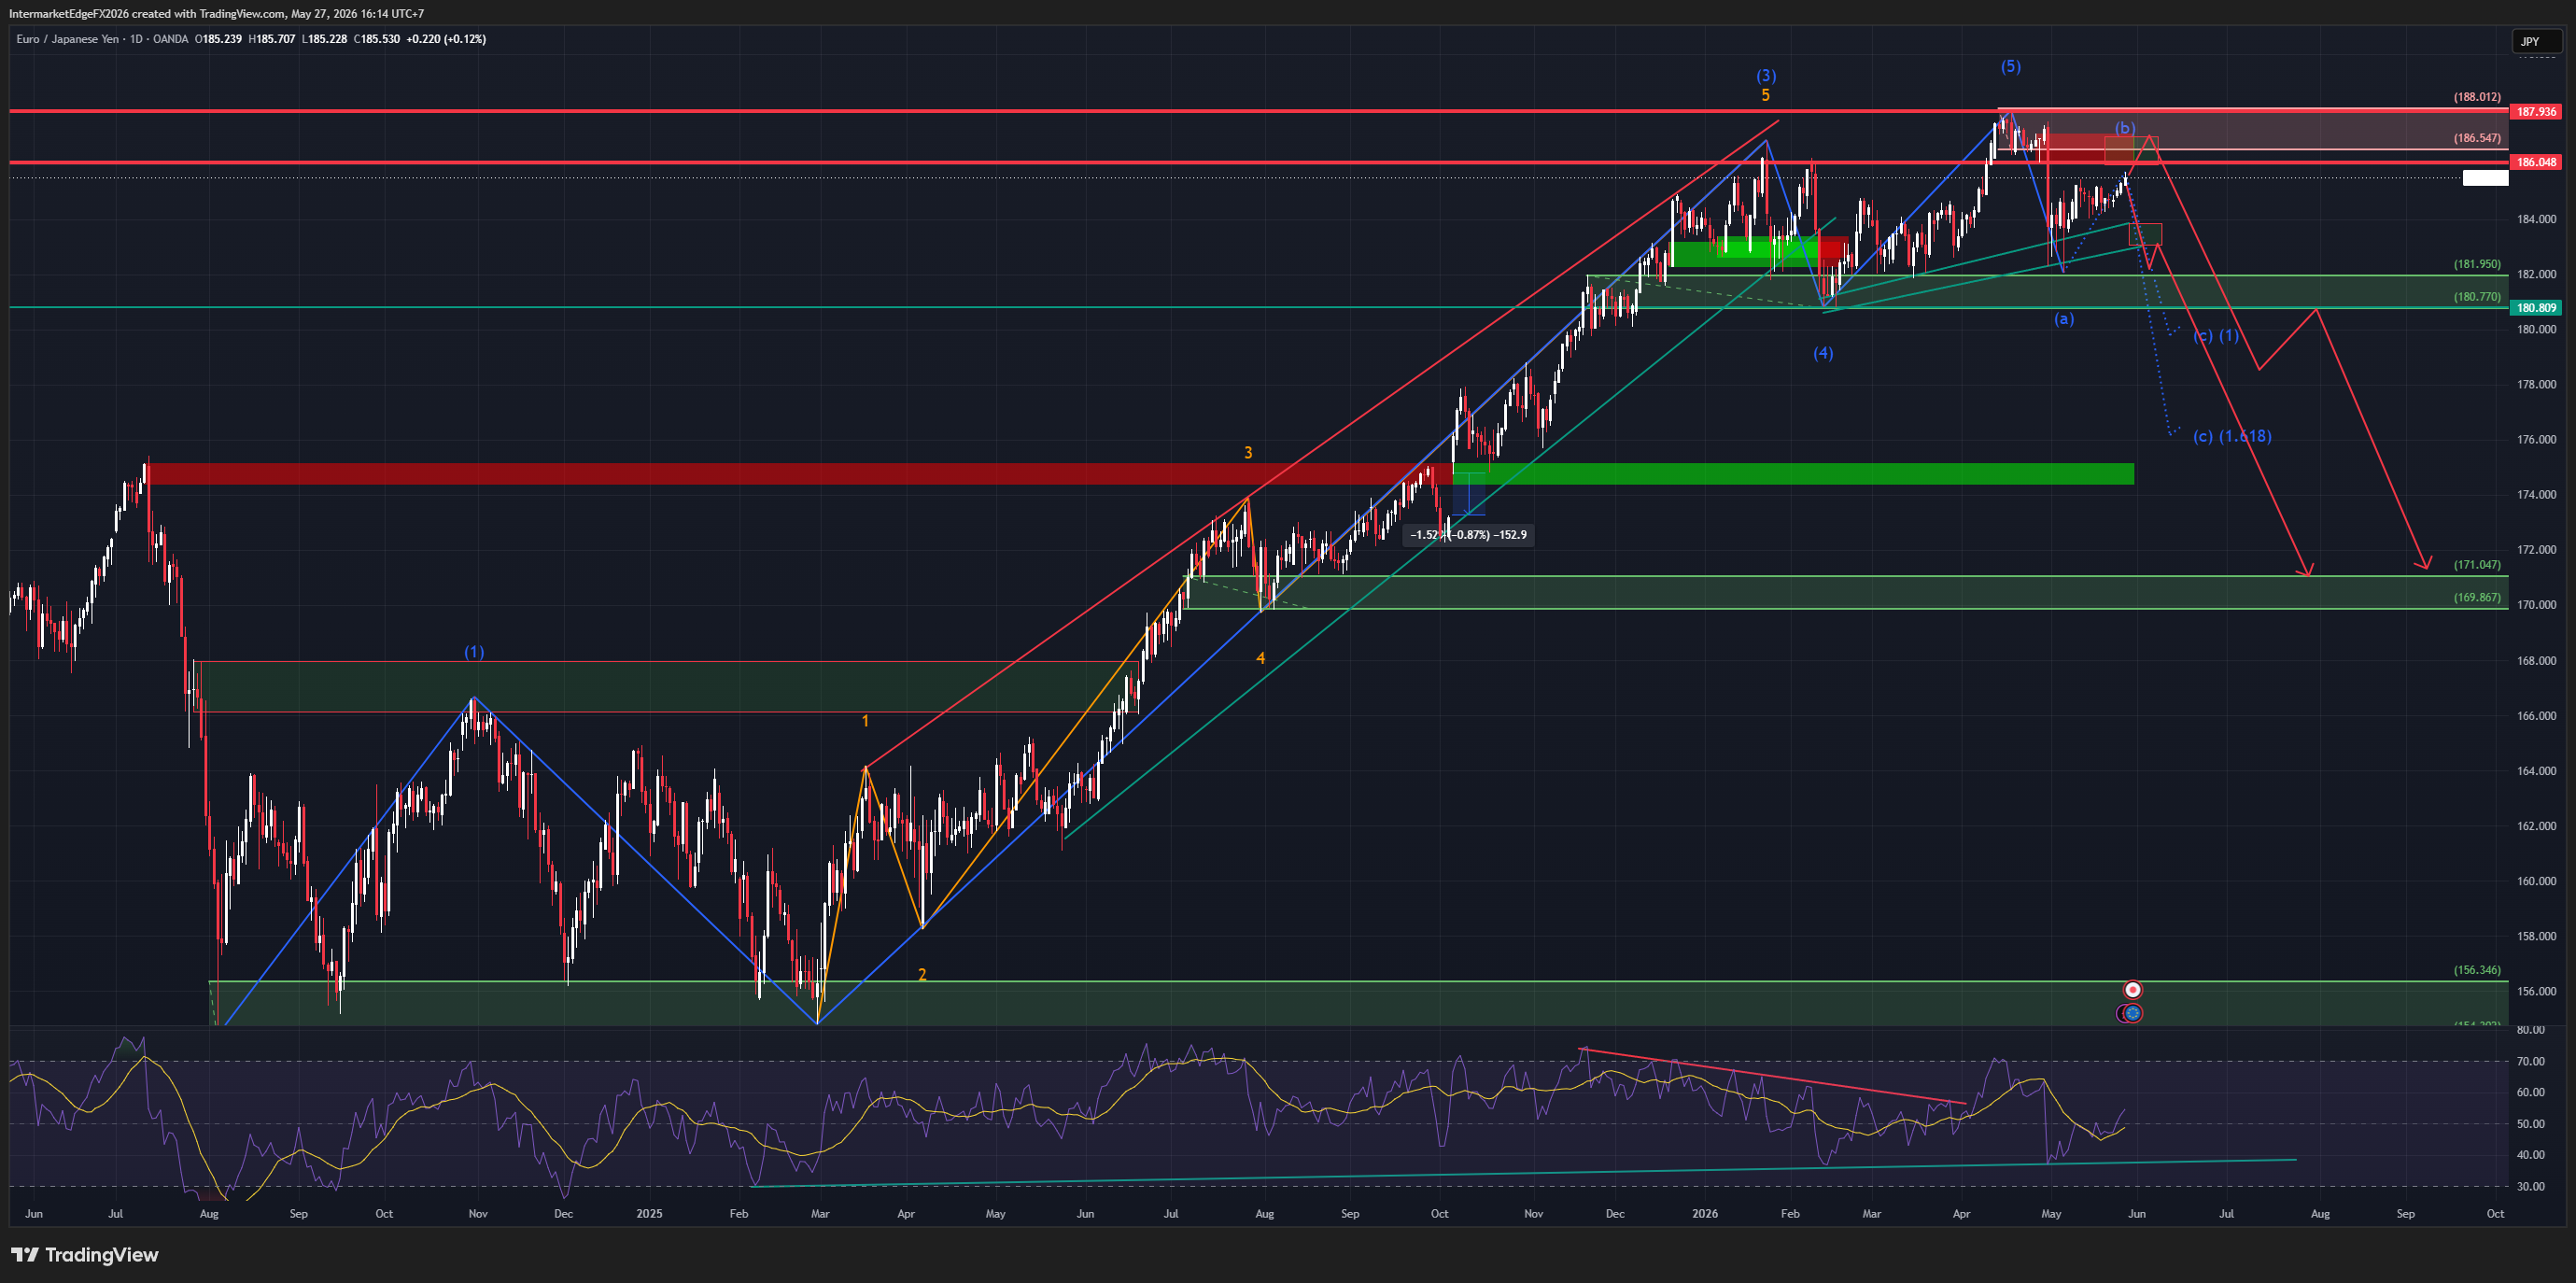
EURJPY is the only cross in macro right now where both legs are moving in the same direction. And that direction is down. EUR leg: ECB cutting at 2.50%. Lagarde deliberately vague on June. Every cut widens the ECB-BoJ rate gap. JPY leg: BoJ normalization path intact. Ueda spoke yesterday. The headline right now: "Japan yen nears intervention zone." USDJPY at 159.376, approaching 160. Iran deal oil decompression hits both legs simultaneously - a double-bearish impact no other cross in this week's series receives: Lower oil reduces EZ inflation - ECB has room to cut deeper (EUR weaker) Lower oil reduces Japan energy import costs - BoJ has room to hike (JPY stronger) Brent has dropped $18.04 in 9 days from $111.27 to $93.23. WTI is at $90.03, approaching the psychological $90 level. The chart confirms. D1 EURJPY shows completed 5-wave impulse from the 156 low to the 190 peak. ABC correction is underway. Wave (b) bounce rejected at the 185.936-187.936 resistance zone. Wave (c) is developing with measured targets at 171.047 (1.0 extension) and 169.867 (1.618). DE-JP rate spread is +1.52% and narrowing. ECB cuts push it lower. BoJ hikes push it lower. Carry trade unwind has no near-term stopping point. The wildcard: USDJPY 160. The BoJ does not need to fully intervene. A verbal warning from any BoJ official is enough to strengthen JPY 100-150 pips and drop EURJPY to 183-184 within hours. This is the highest-probability near-term catalyst. Watch two tells this week: USDJPY approaching 160 - BoJ verbal intervention trigger Brent breaking $90 - ECB June cut probability exceeds 80% Either one alone accelerates the bear case. Both together would be violent. Conviction: Medium-High Bear. Target: 171.047. Invalidation: break above 187.936. #EURJPY #Yen #ECB #BoJ #IranDeal #CarryTrade #ElliottWave #MacroAnalysis #Intervention #ForexAnalysis

GBPUSD: Dollar Steadies as Hopes for Iran Peace Deal Waver - Sterling Holding Ground But the RSI Is Telling a Different Story

GBPUSD: Dollar Steadies as Hopes for Iran Peace Deal Waver - Sterling Holding Ground But the RSI Is Telling a Different Story

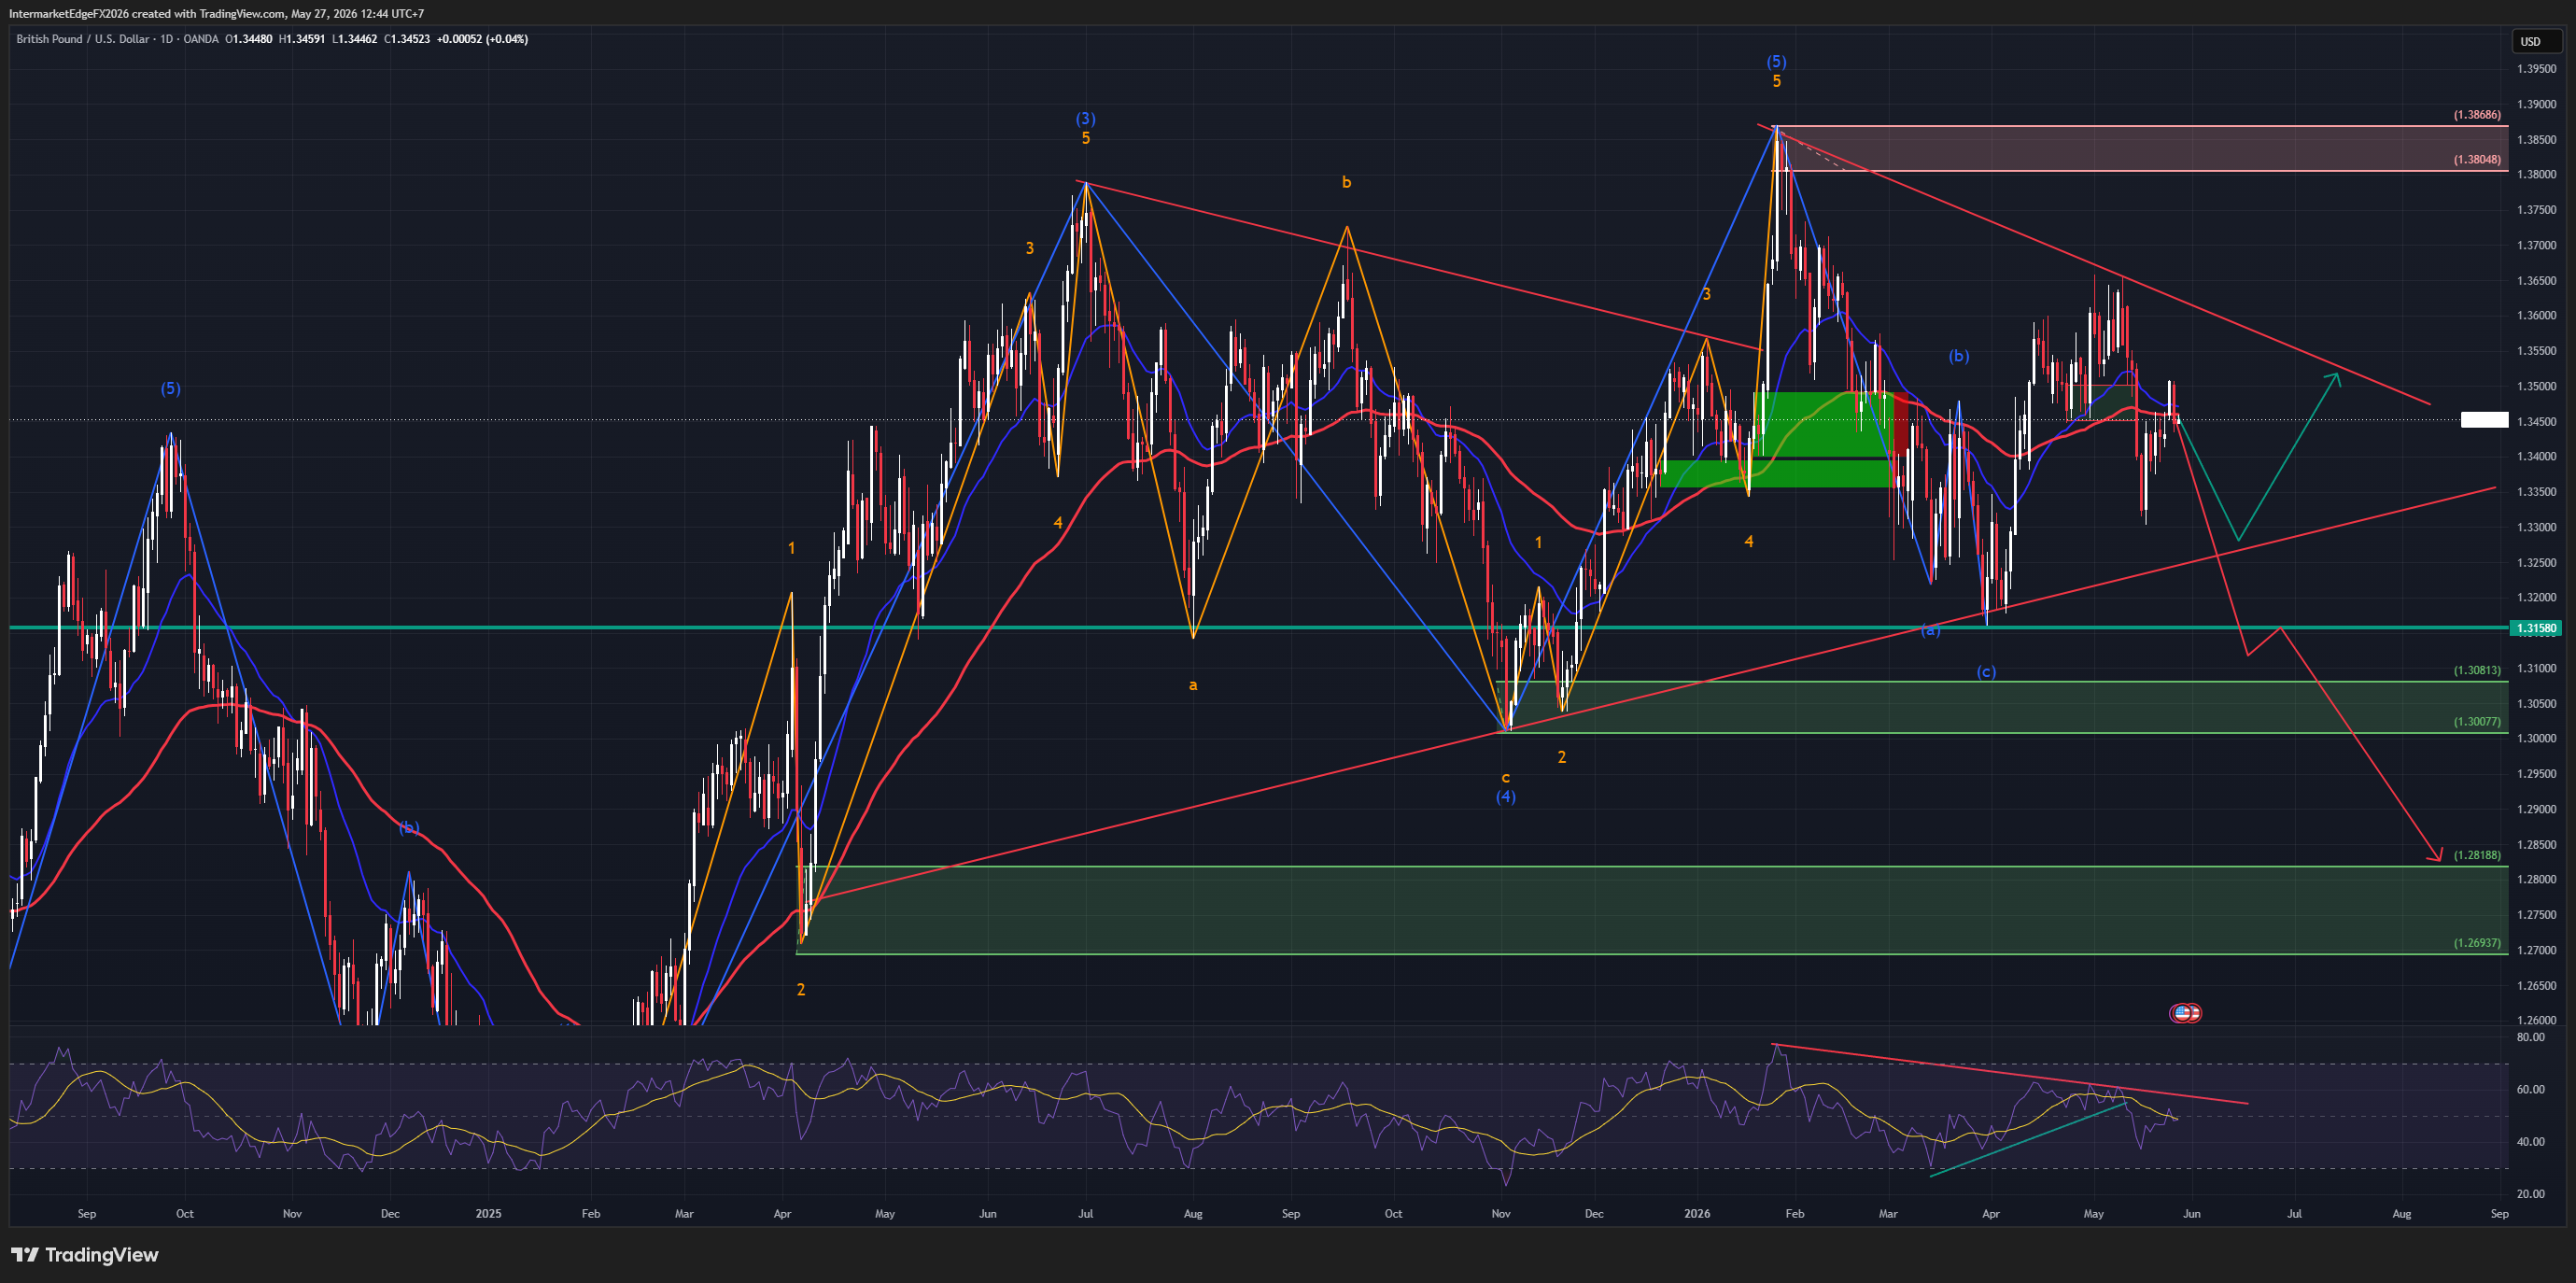
GBPUSD 1.3454 today. Price is attempting recovery. But the RSI is not following. That divergence is the most important signal on this chart - and it is the only instrument in this week's series where RSI, not macro or price level, is the primary signal. Here is what the chart is showing: Two competing Elliott Wave counts are fighting for control. Orange count: completed 5-wave impulse from 2024 lows, correction incoming toward 1.30-1.31. Blue count: ABC correction with wave (c) targeting 1.3008-1.3077. Both point the same direction. RSI bearish divergence - price making higher lows, RSI making lower highs - is the tiebreaker. It typically appears at the end of wave (b) or terminal wave (5). Both are pre-correction setups. What makes GBPUSD unique in this week's series: Rate differential is near-zero. UK10Y 4.50% vs US10Y 4.493%, spread +0.007%. No structural carry advantage from either side. Unlike EURUSD (-1.568% headwind for EUR) or EURGBP (+1.51% favoring GBP), GBPUSD will be driven entirely by macro narrative. Not carry. Not rate differential. Just: Iran deal or no deal, and what the Fed says next. The macro picture today: oil market and FX market are diverging. Brent down $16.25 from the 18 May peak - oil still pricing the deal. But DXY steadied at 99.07 and the headline is "dollar steadies as deal hopes waver." Two markets, two different reads on the same event. Today is the most event-dense day of the week. Logan speaks. Cook speaks. ADP drops. EIA releases. Four catalysts simultaneously. Base case (45%): Logan hawkish, ADP strong, DXY bounces to 100+, GBPUSD retraces to 1.33-1.34. RSI divergence confirms. The only tell that matters: watch RSI after Logan speaks. If RSI turns up and GBPUSD holds 1.3400 - divergence resolving bullish. If RSI keeps declining while price attempts 1.35-1.36 - correction to 1.3077 is next. Conviction: Medium. Bias: Mildly bearish near-term. #GBPUSD #Sterling #DXY #IranDeal #ElliottWave #RSIDivergence #MacroAnalysis #FedWatch #BoE

InterMarketEdge

© 2026 InterMarketEdge. Financial intelligence for inter-market traders.