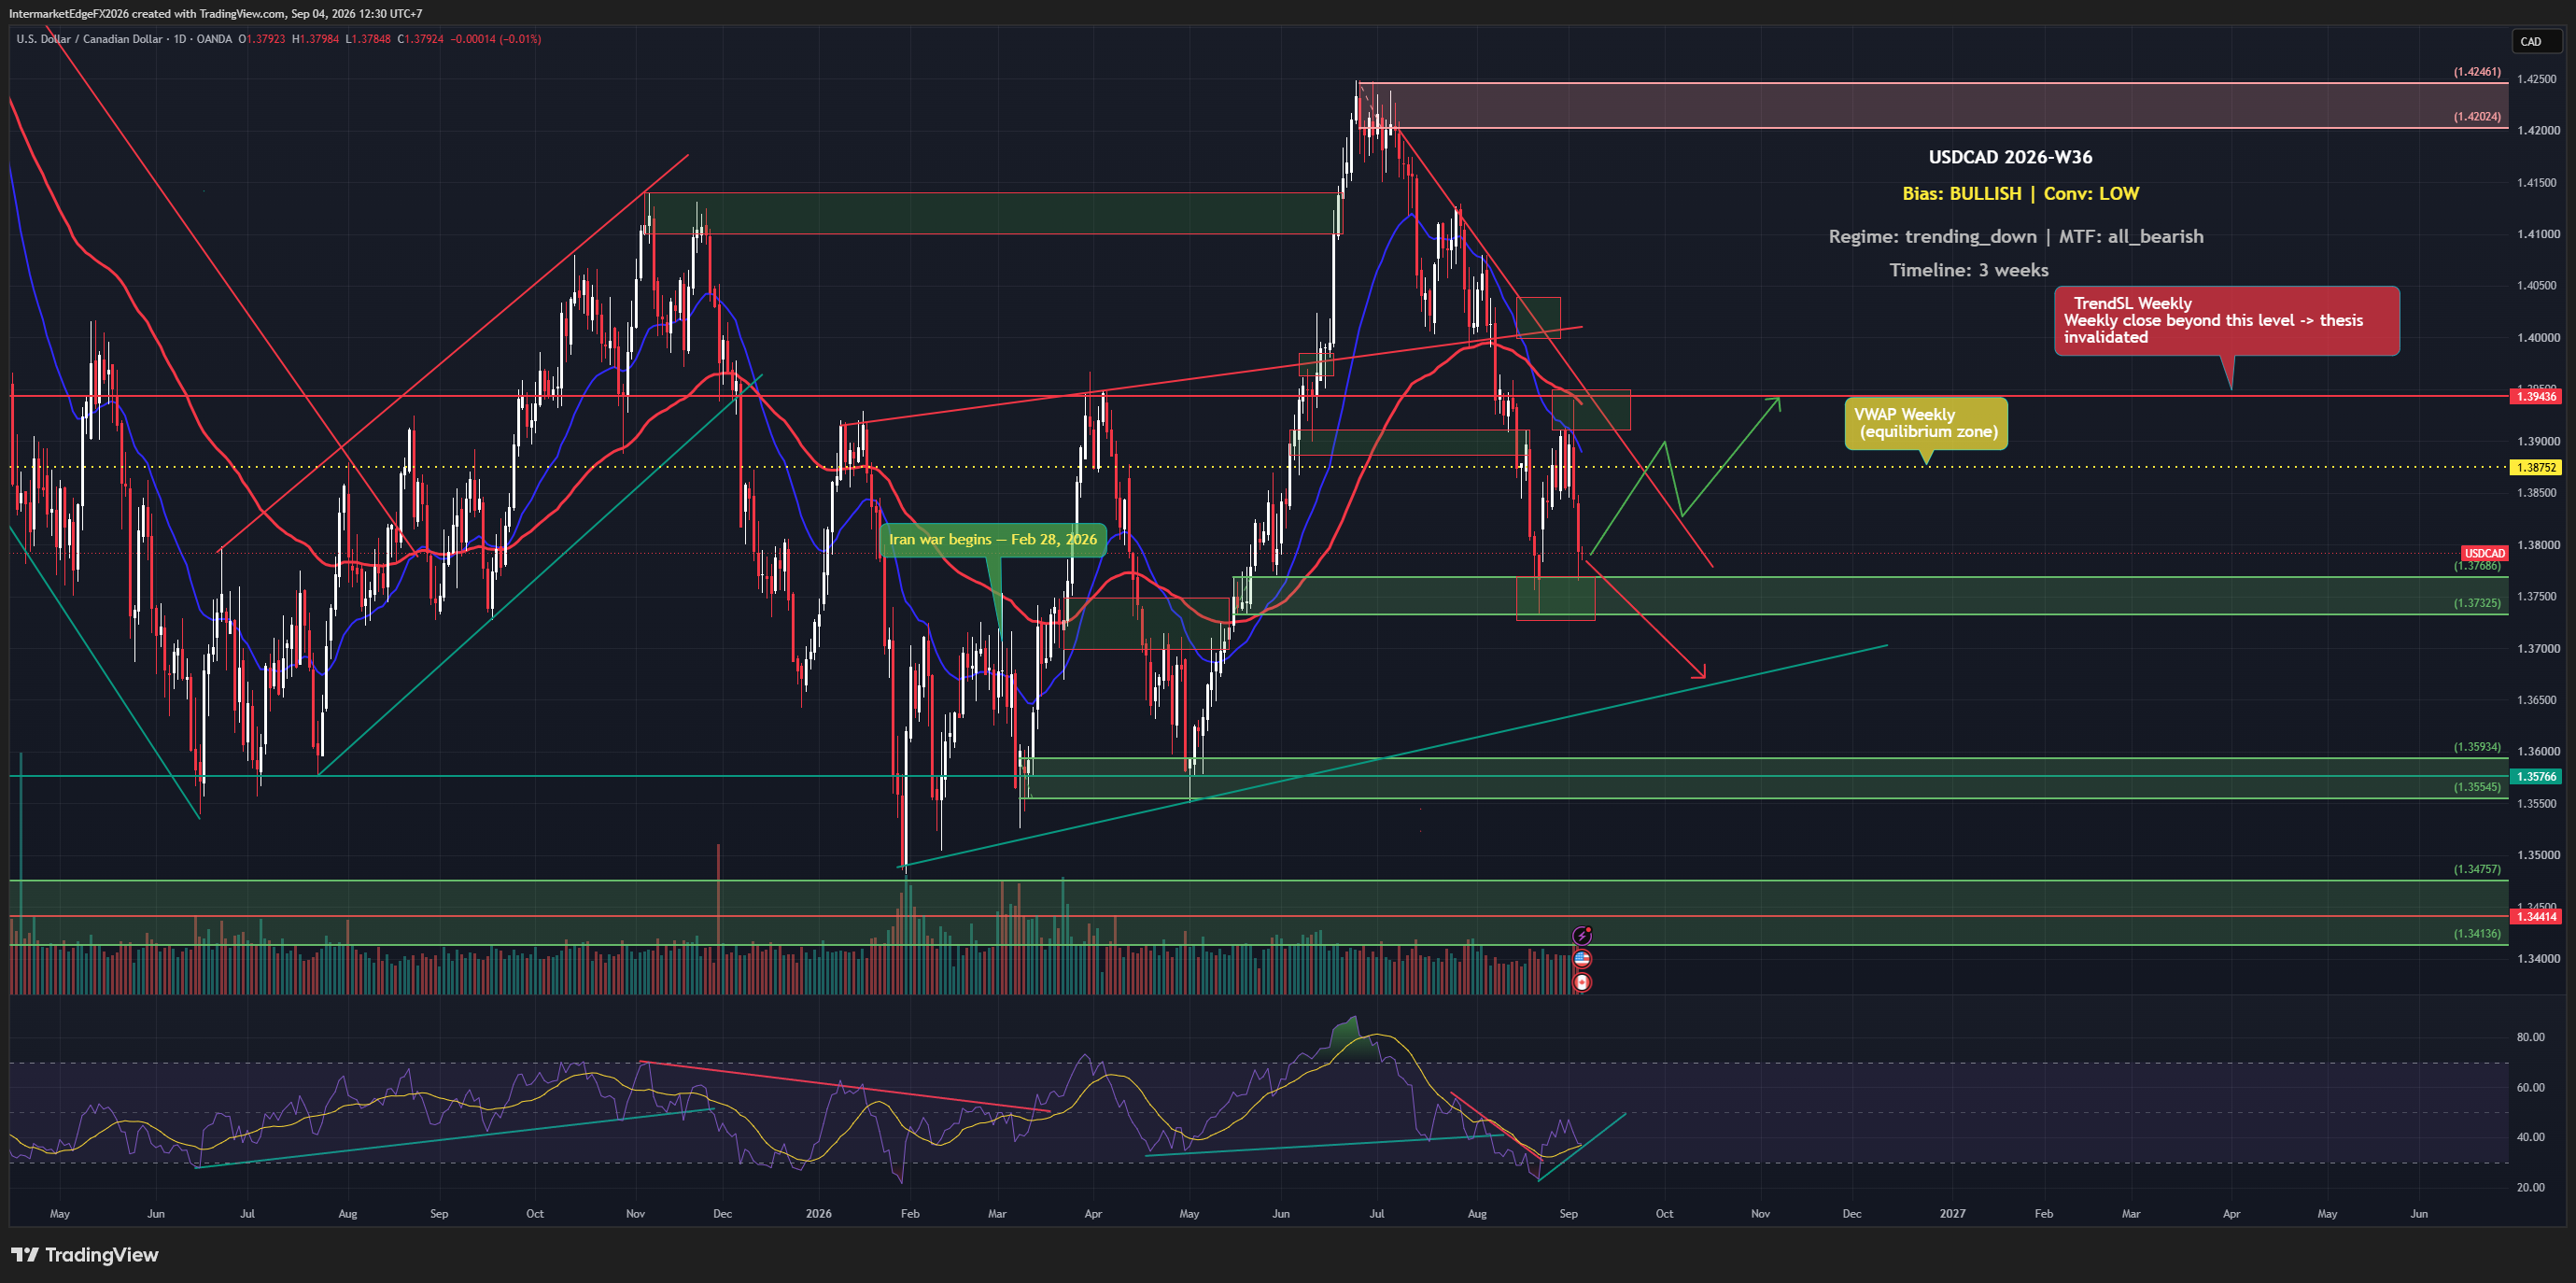
Tag: CAD — InterMarketEdge

Tag: CAD

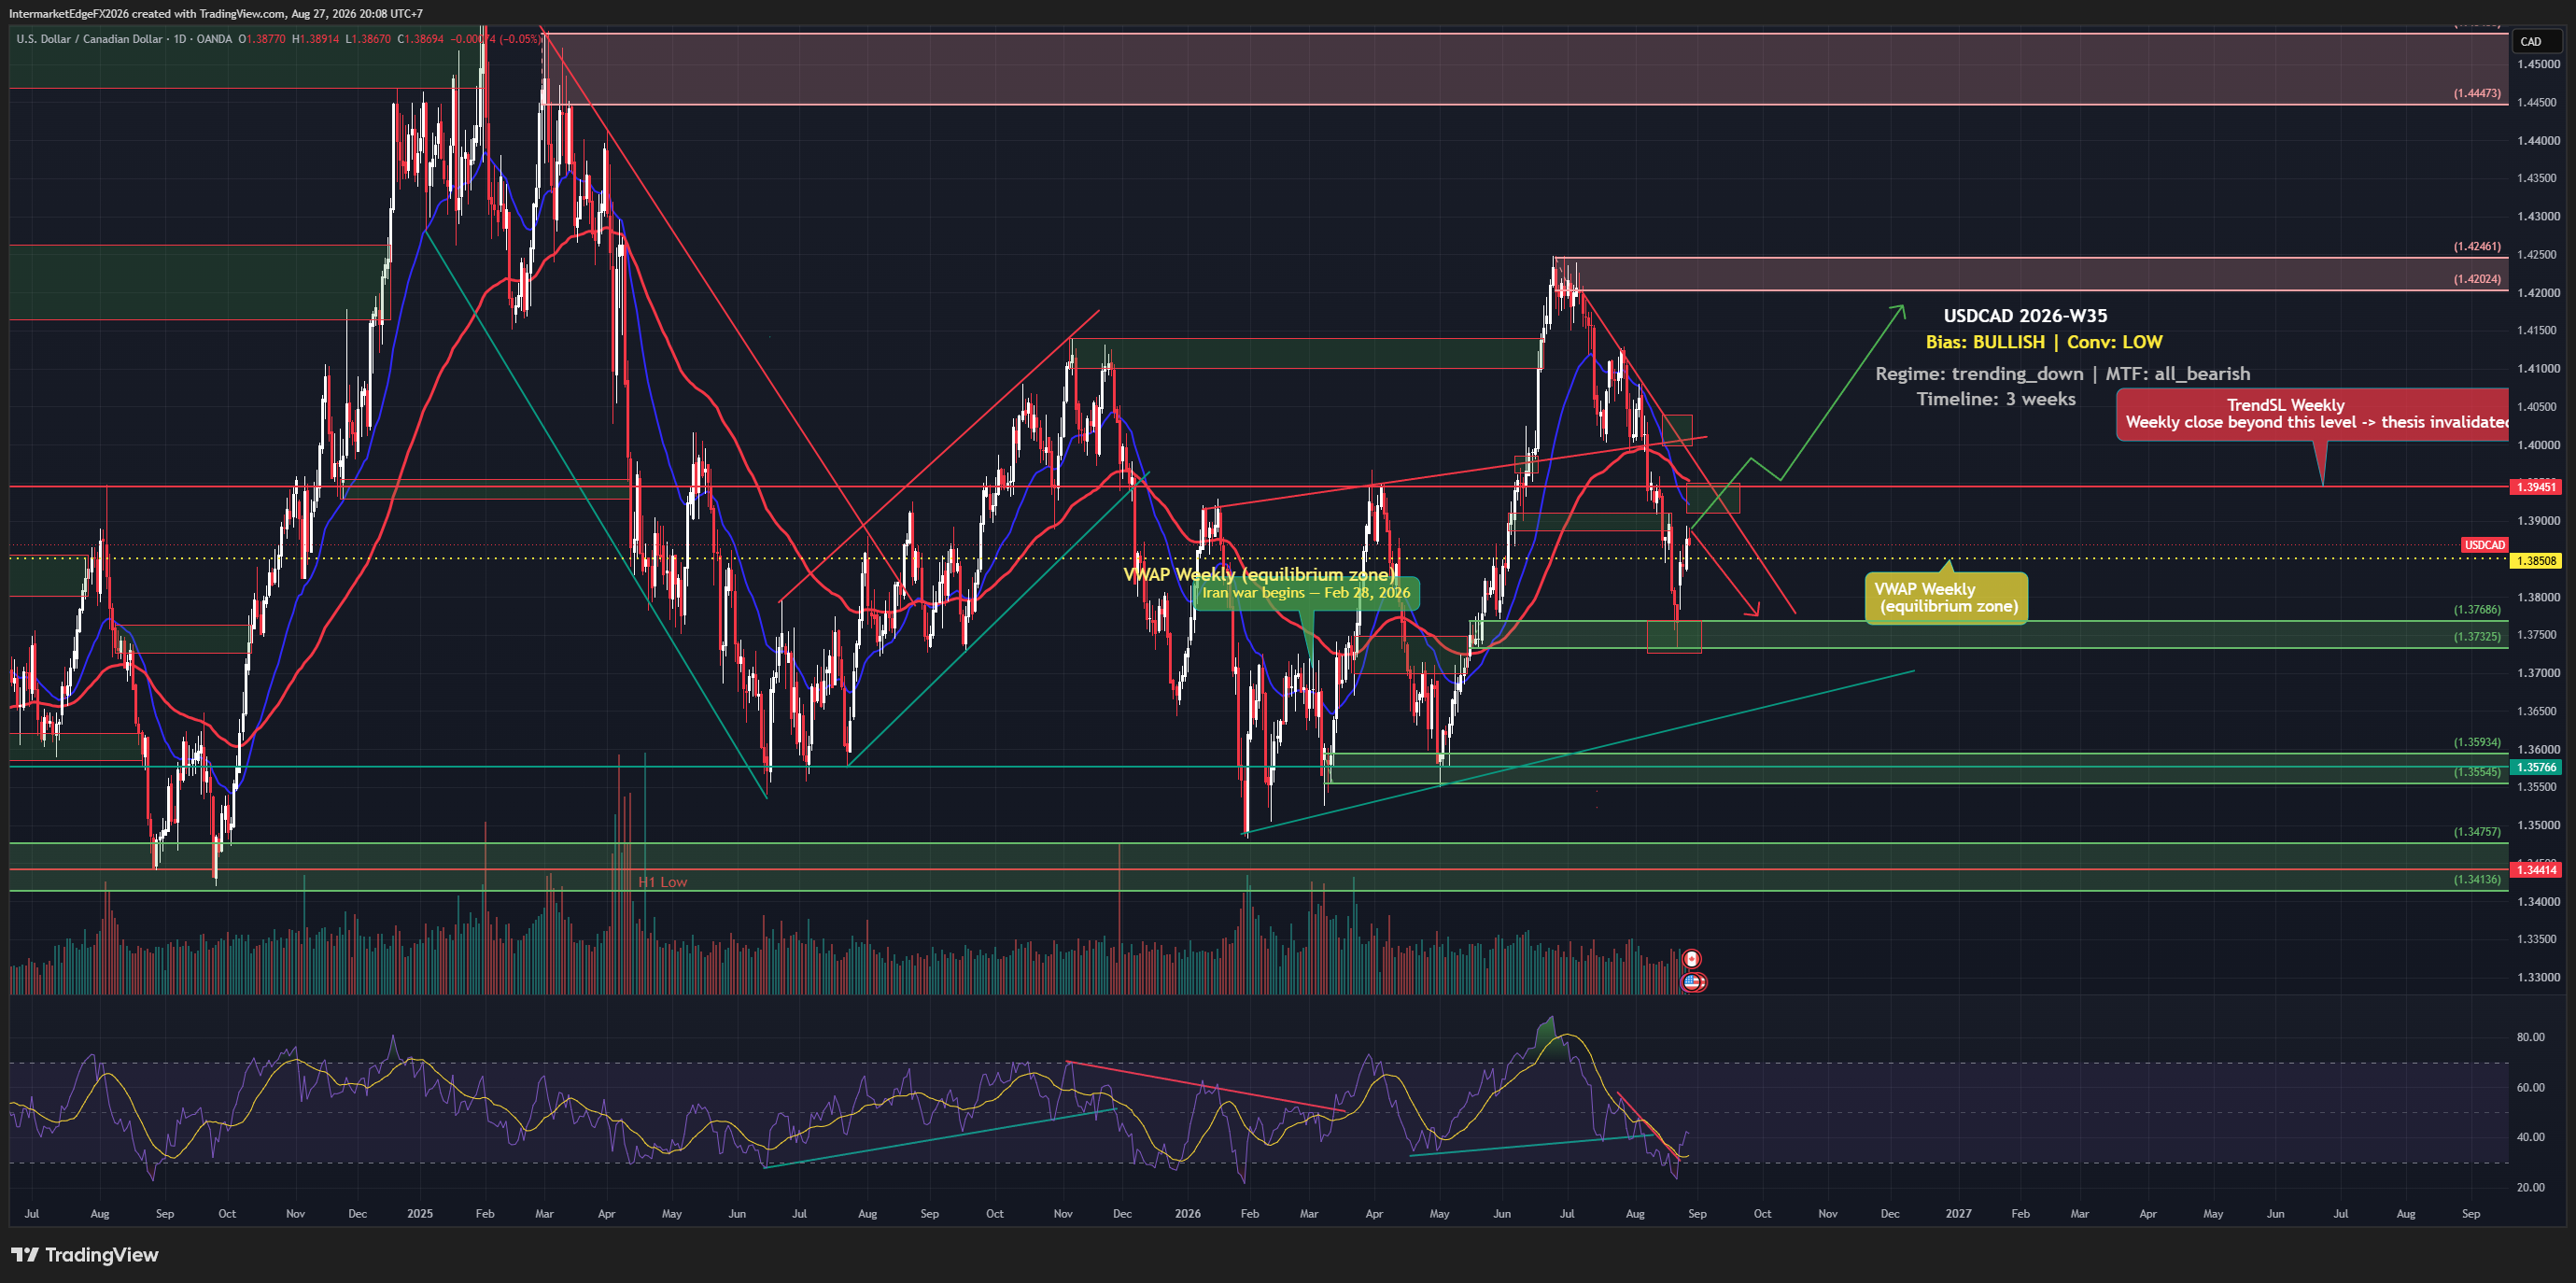
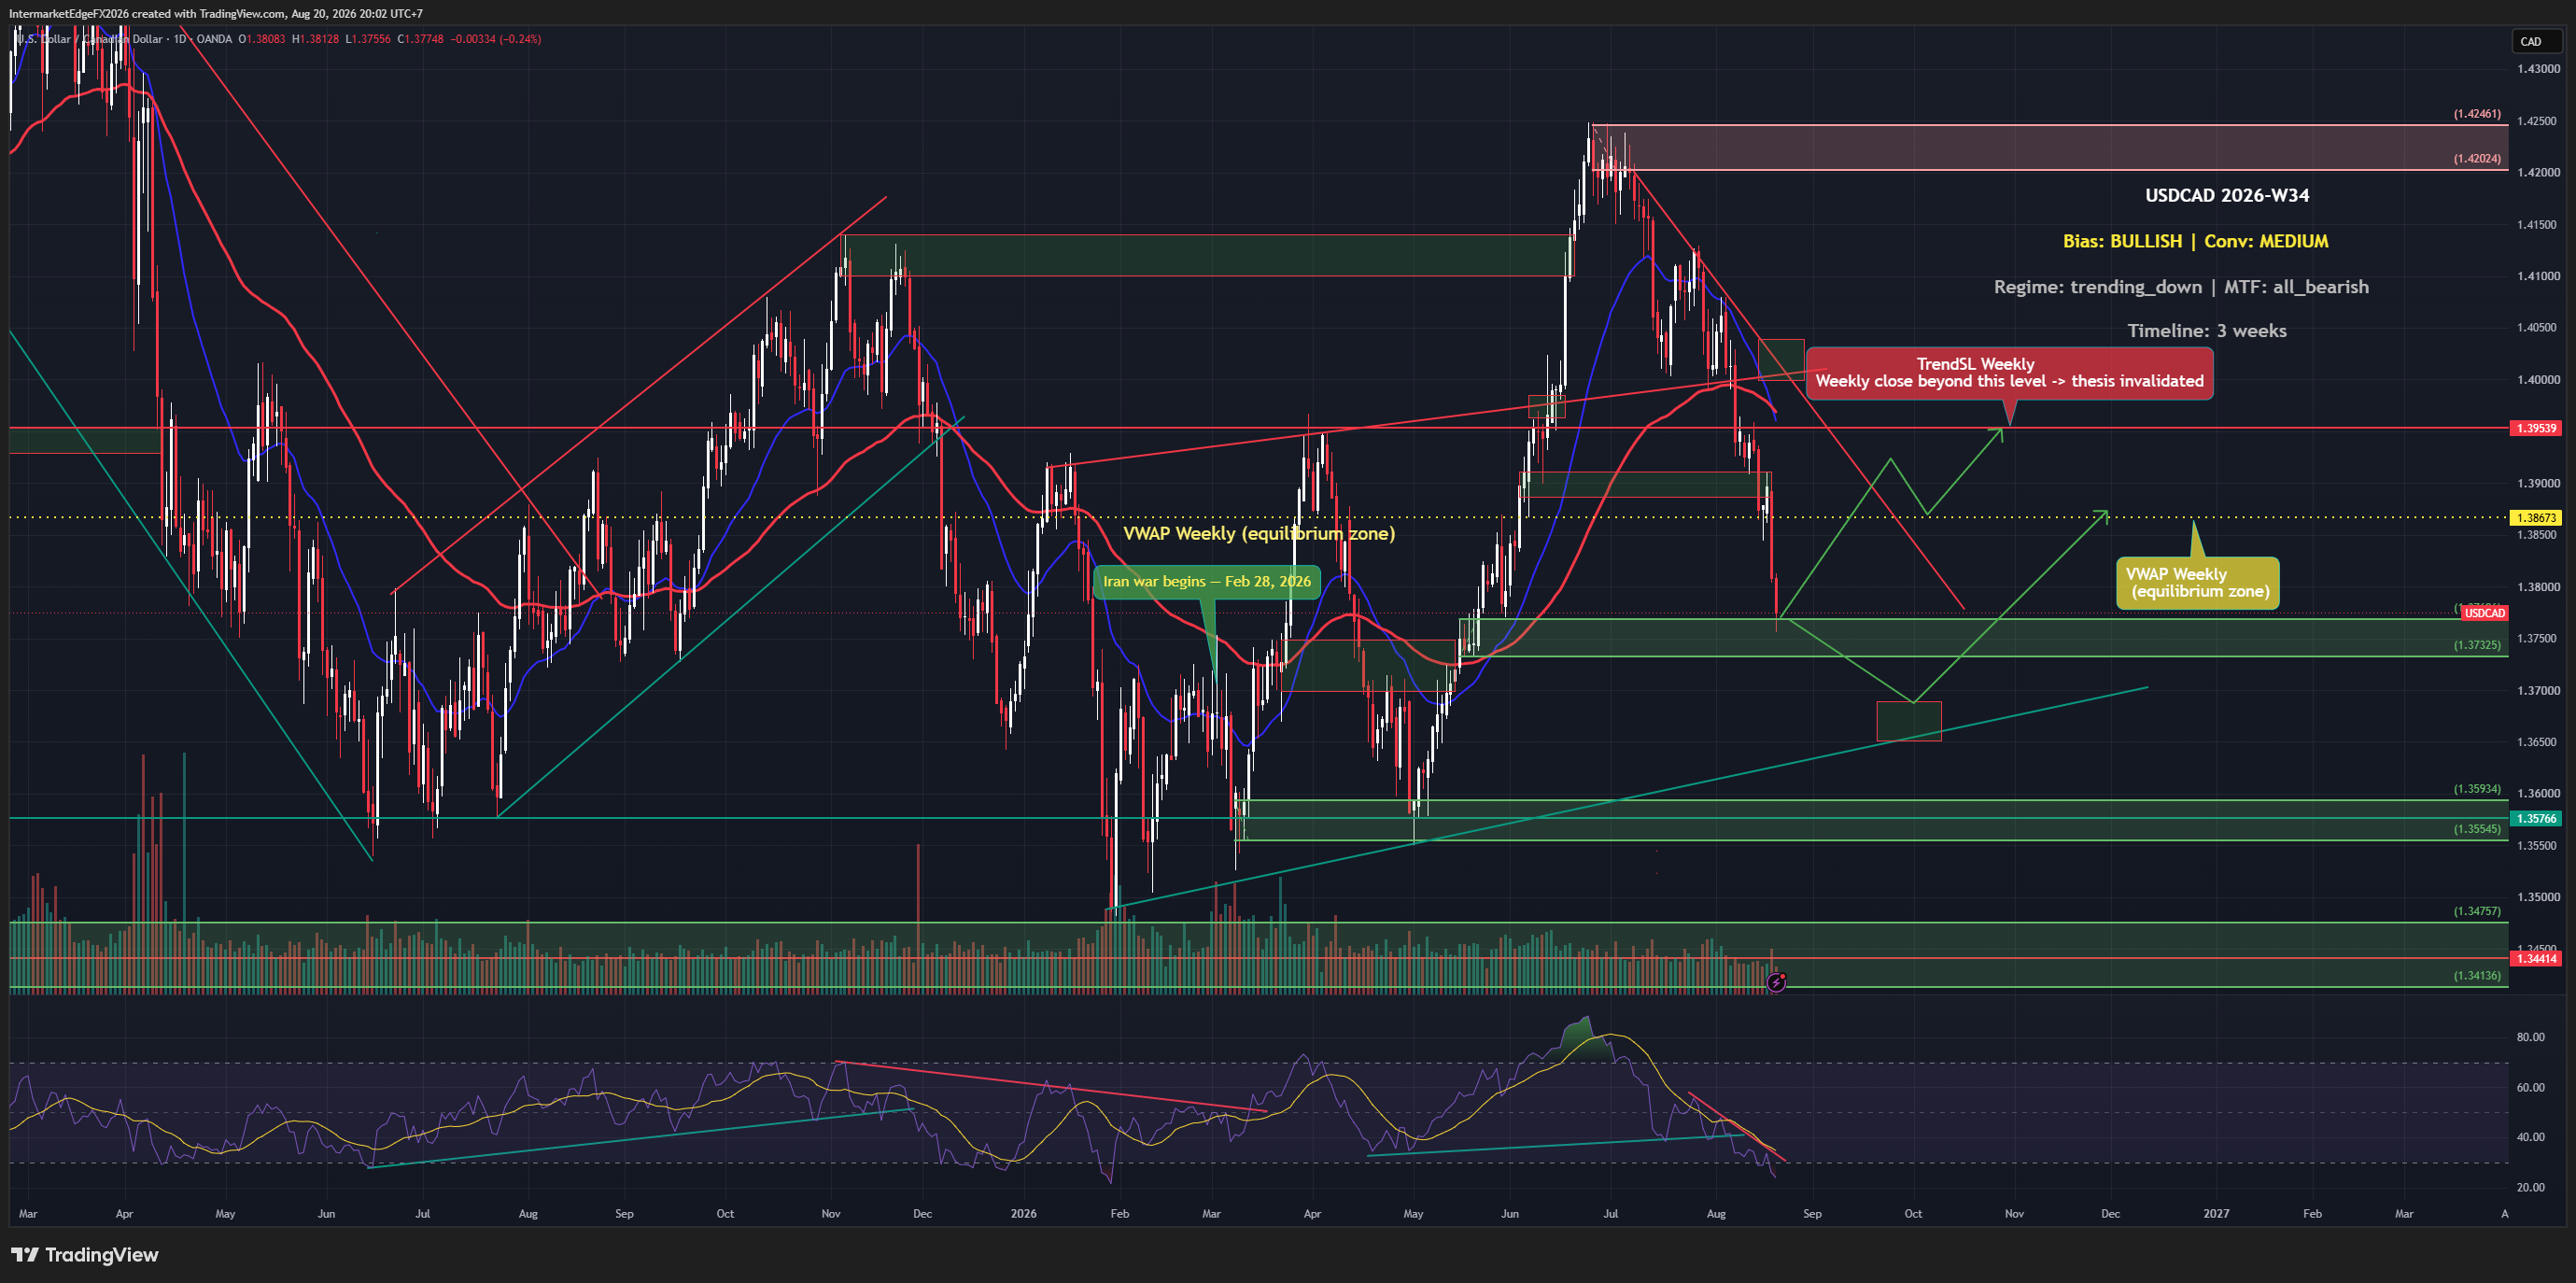
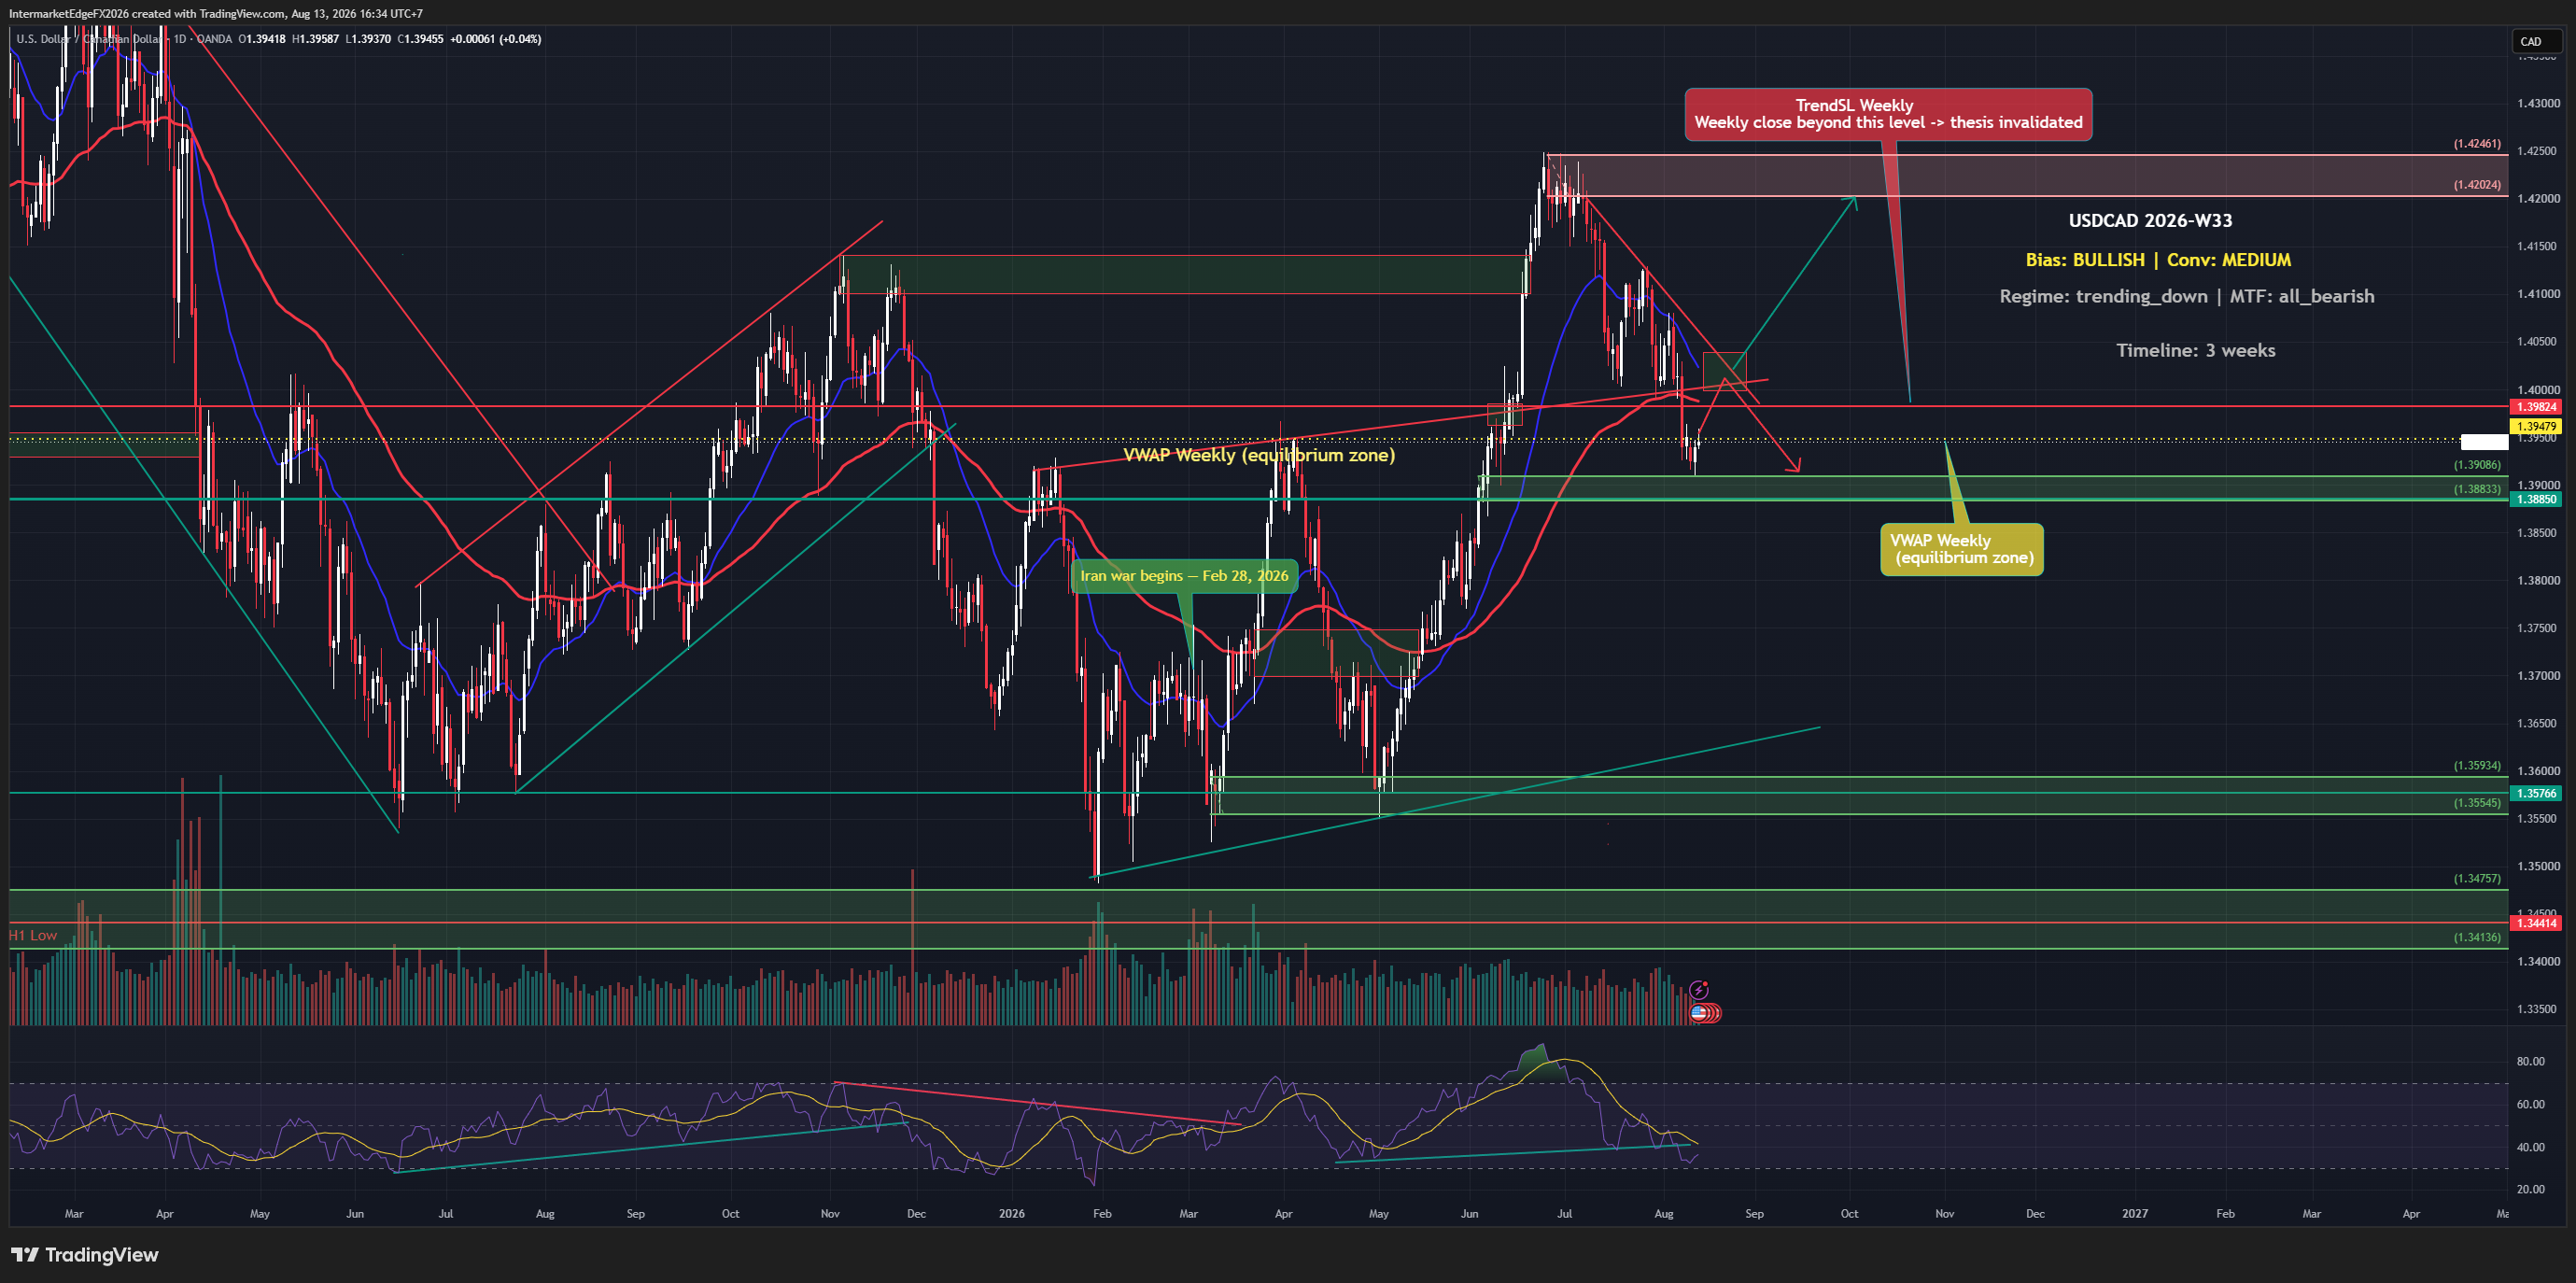
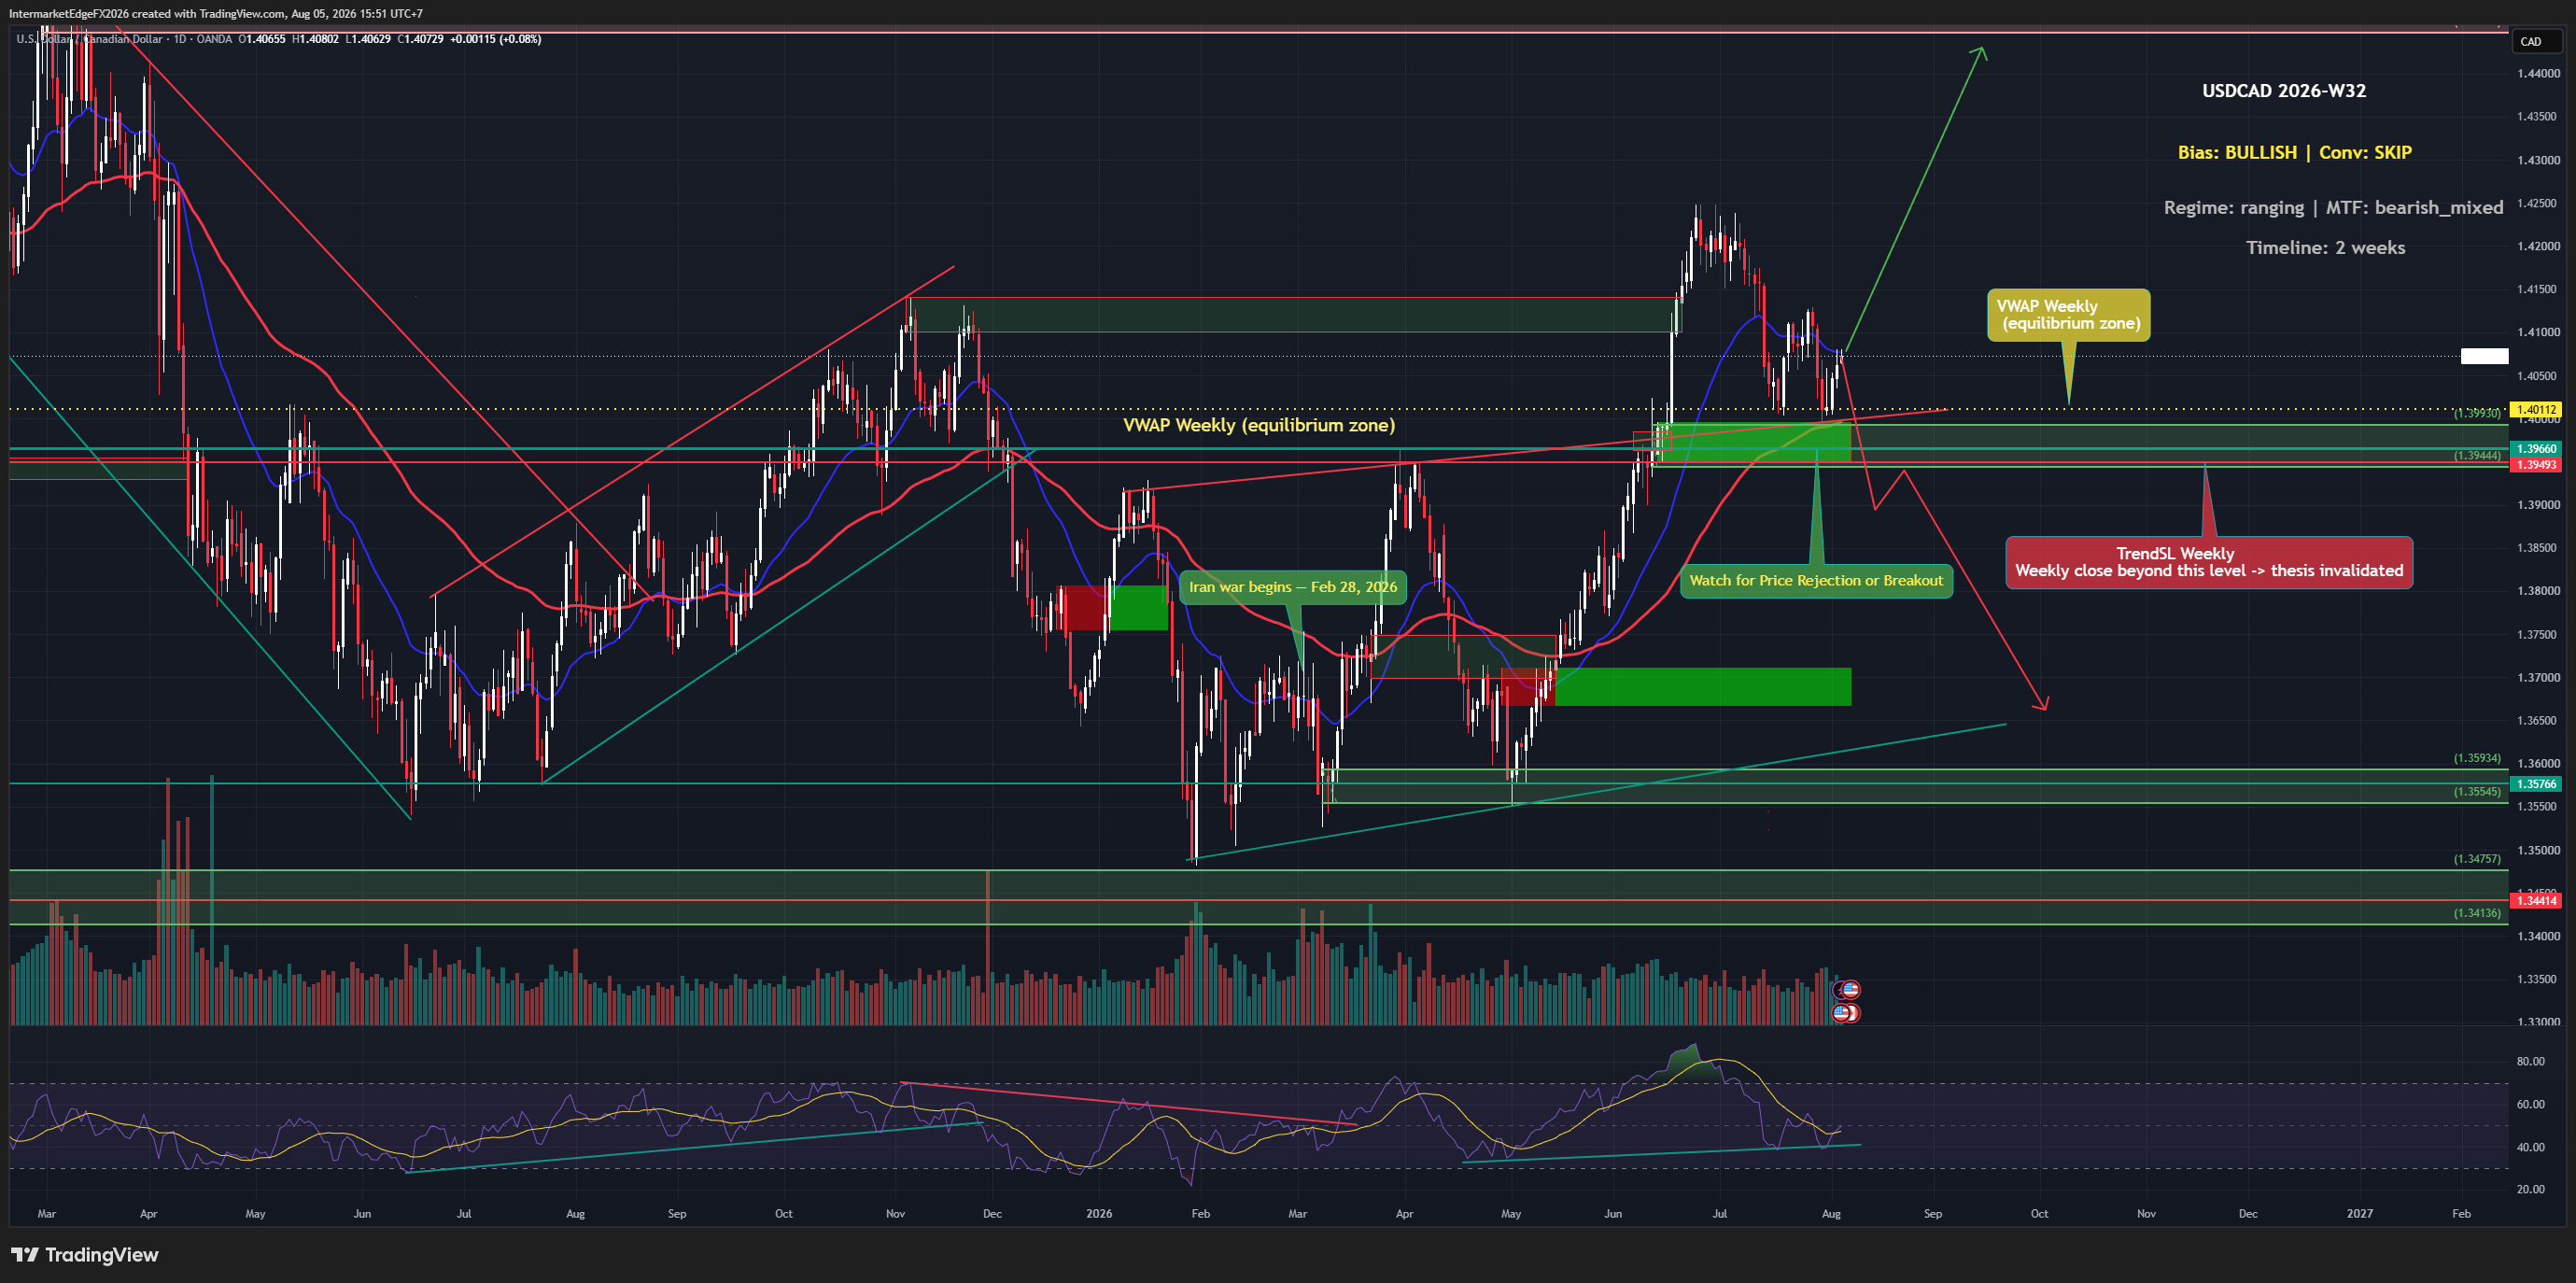
USDCAD - Wave 4 Recovers From a Deeper-Than-Expected Pullback, Price Retests the 1.4174 Decision Zone Ahead of Wave 5 Toward 1.4447-1.4540

USDCAD - Wave 4 Recovers From a Deeper-Than-Expected Pullback, Price Retests the 1.4174 Decision Zone Ahead of Wave 5 Toward 1.4447-1.4540

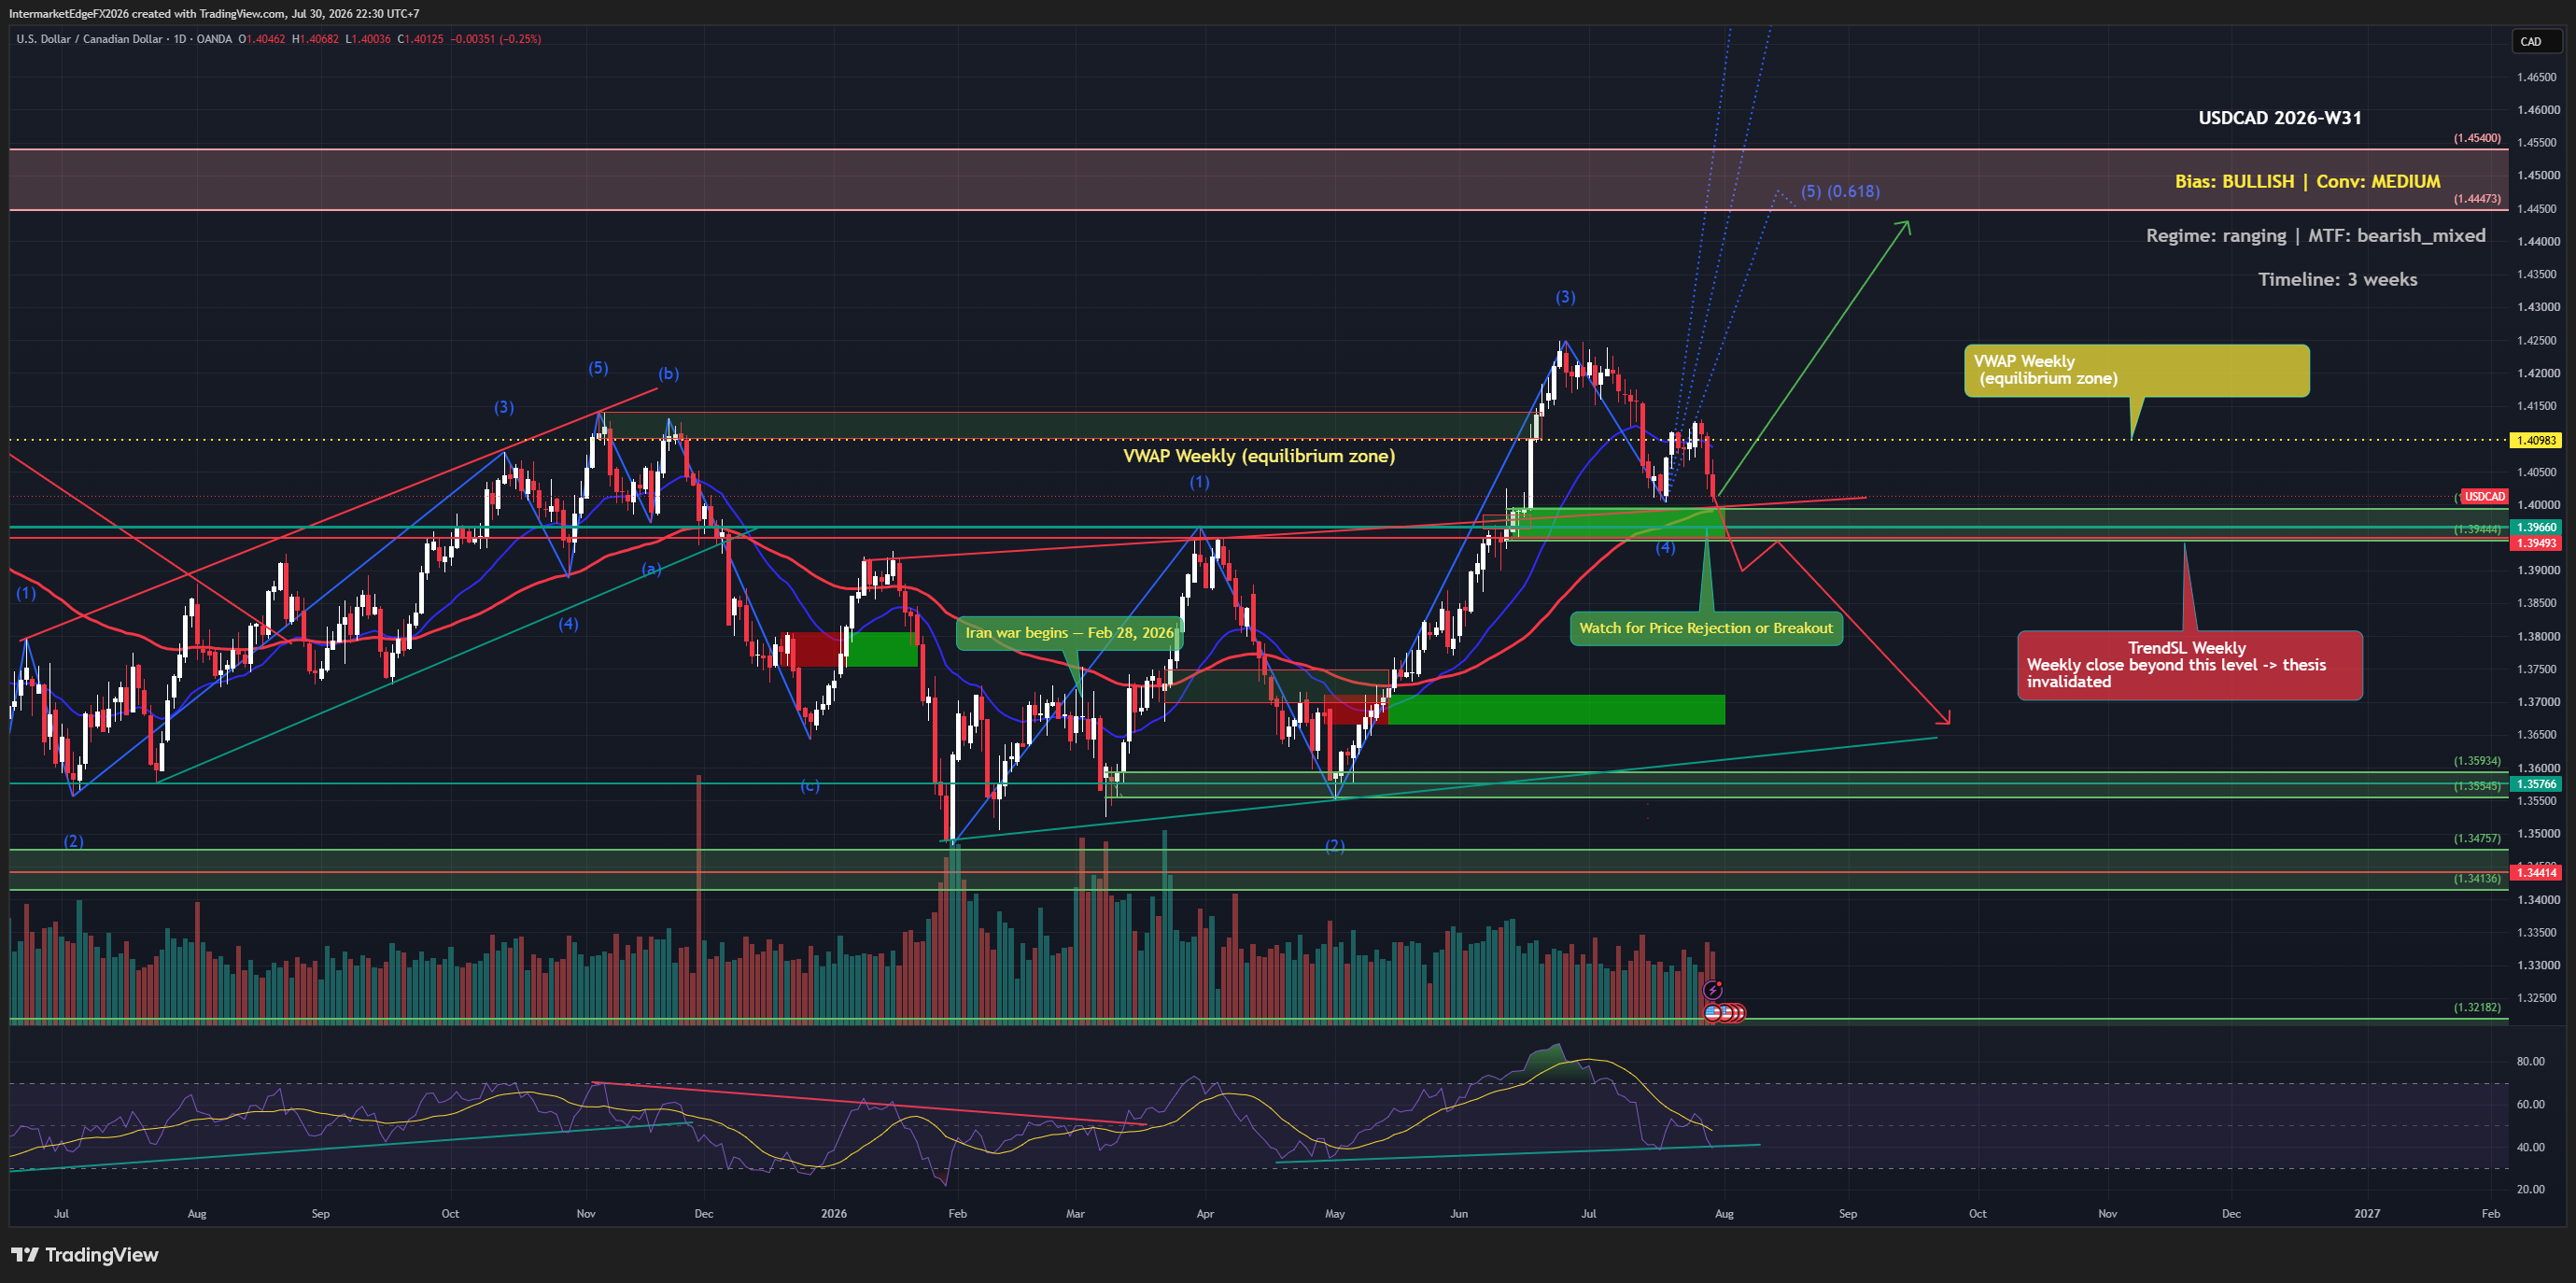
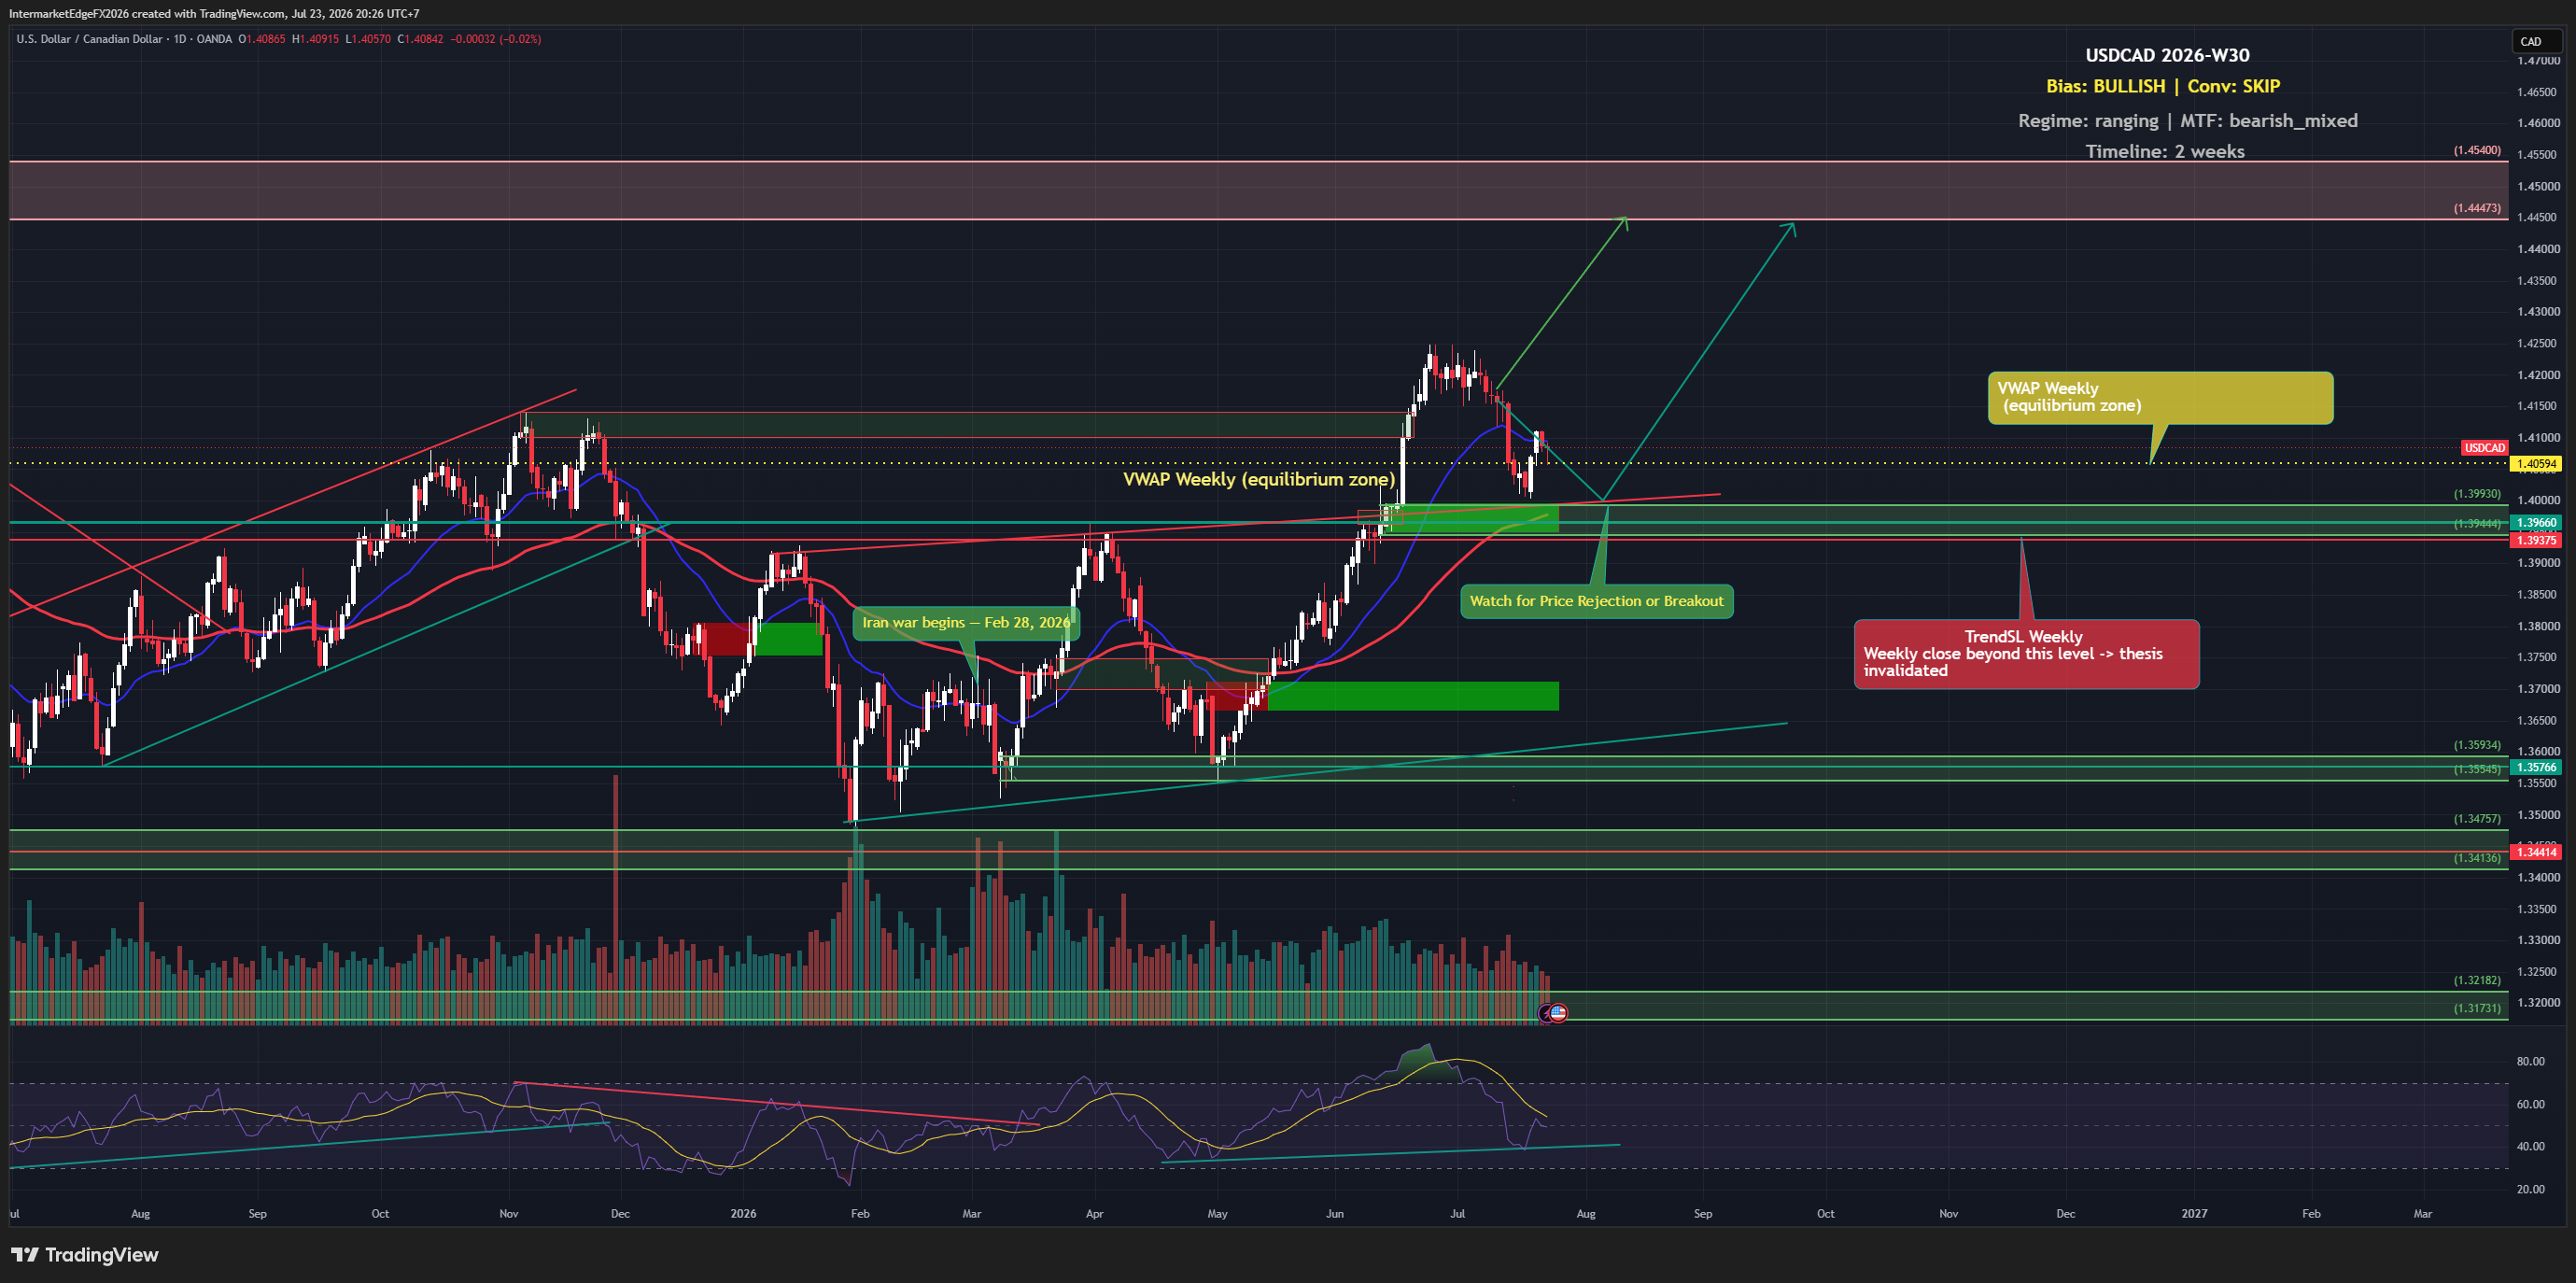
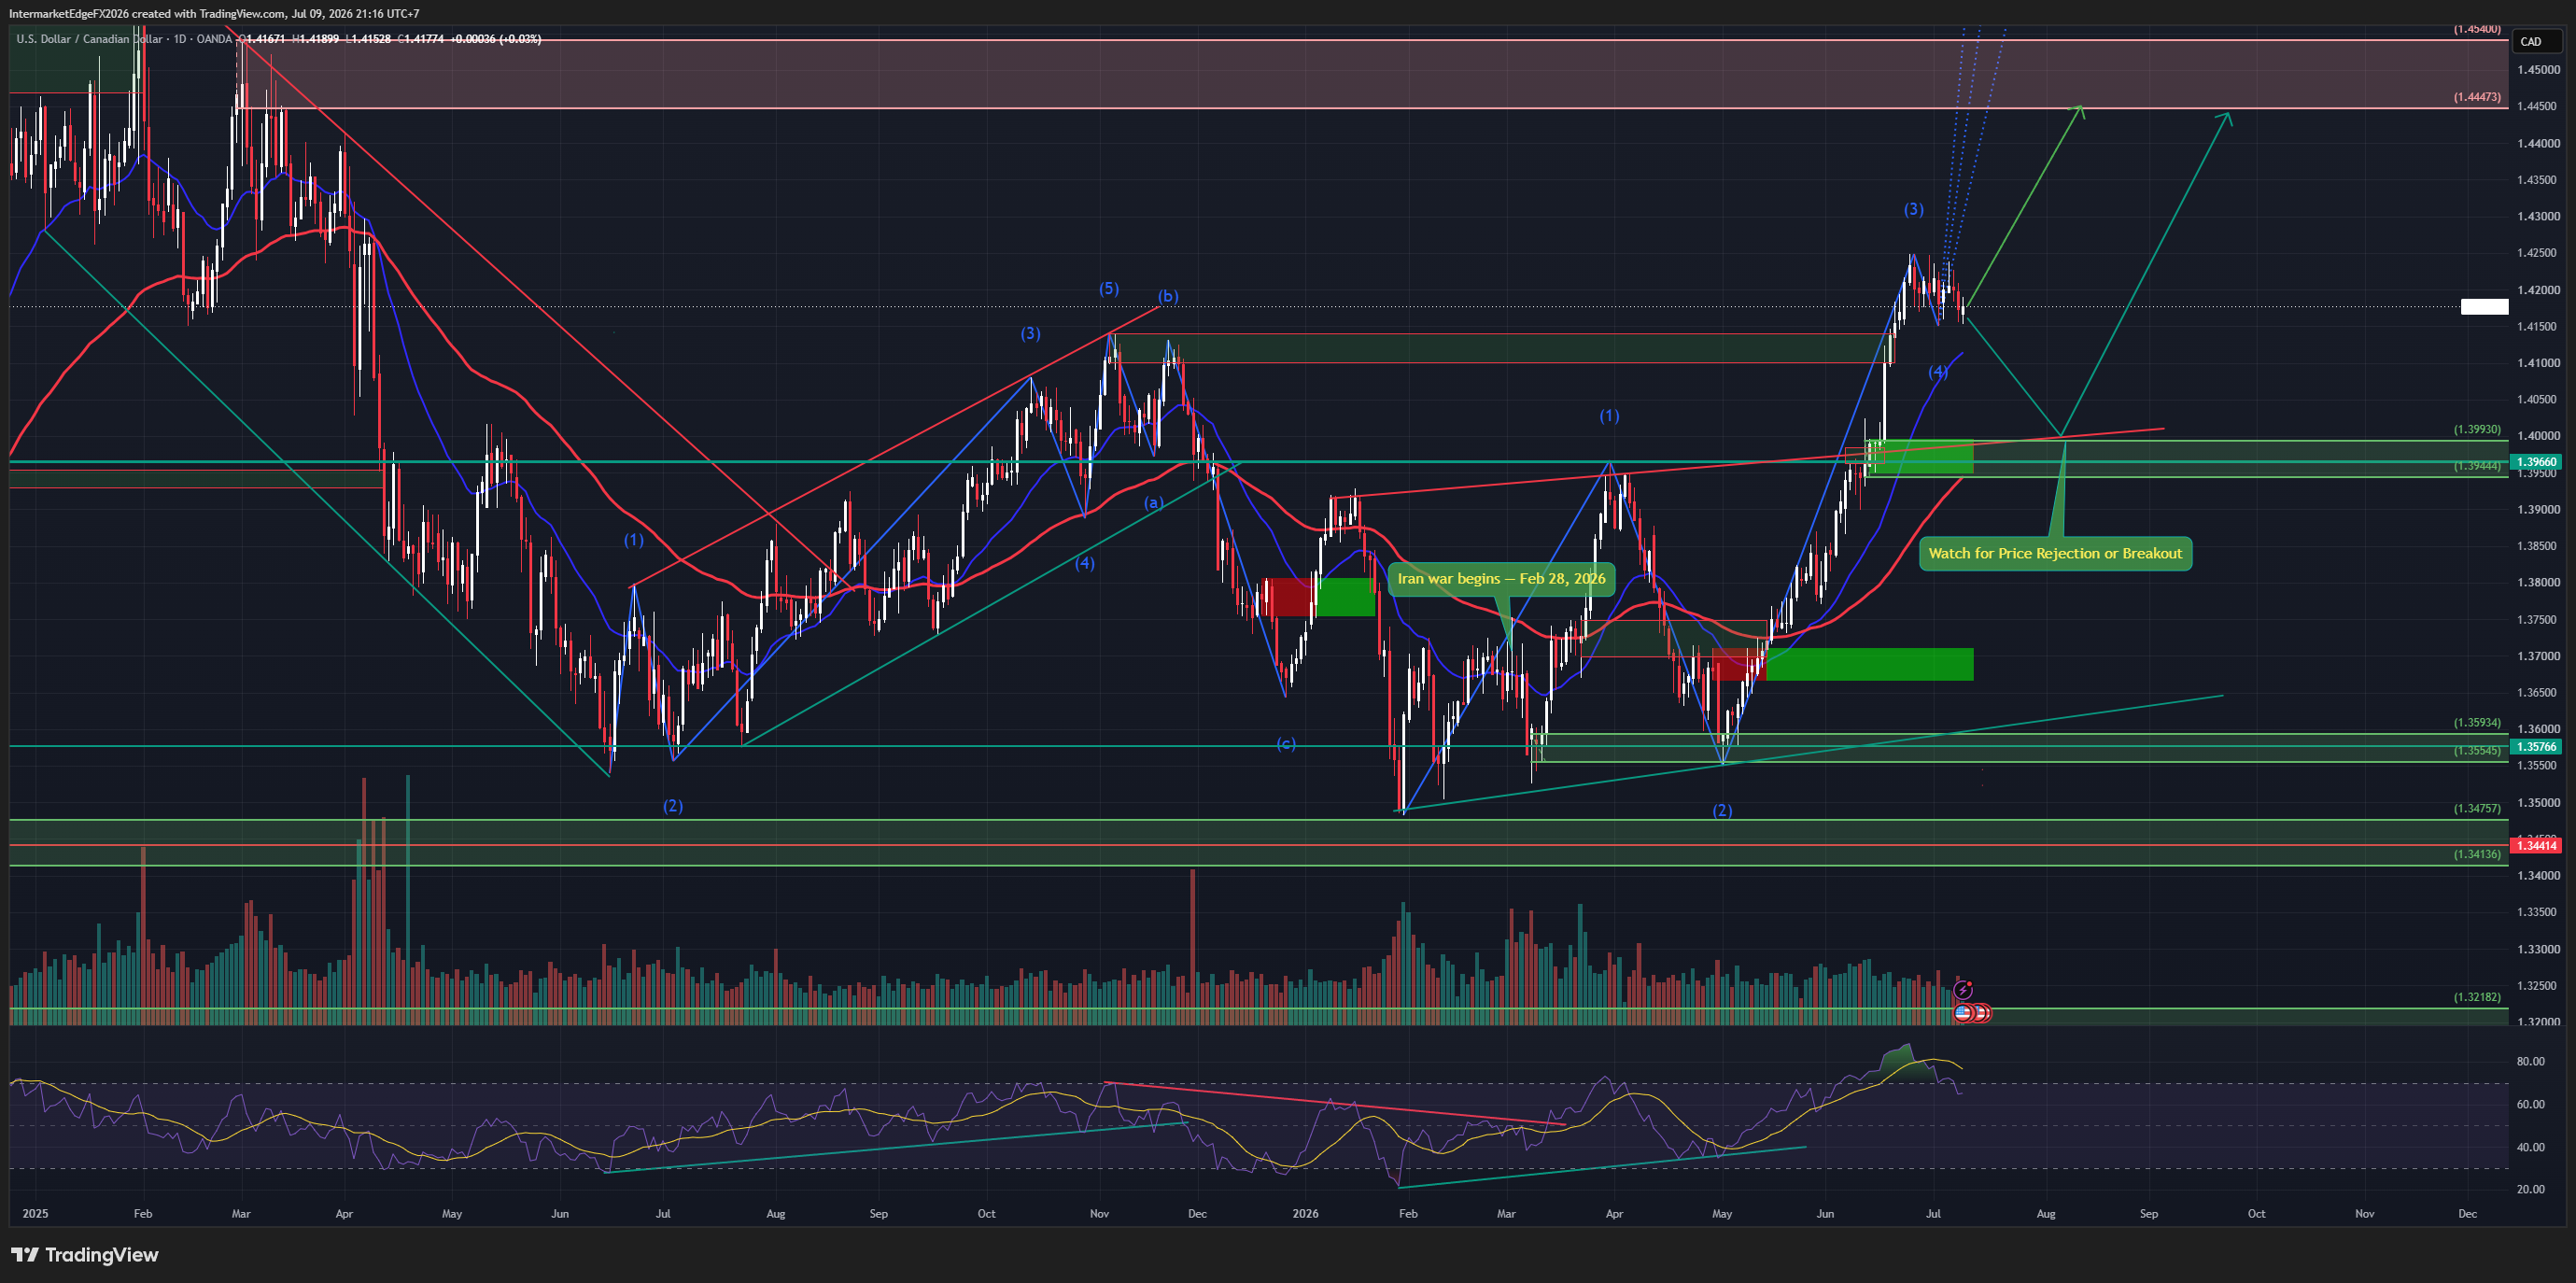
USDCAD - SUMMARY 09/07/2026 Regime: Wave 4 completed a deeper-than-expected correction (1.394-1.397 instead of 1.415-1.417), now recovering to retest the 1.415-1.417 pivot from above. Medium-High Bull unchanged. Bias: Medium-High Bull. New factors: sharp two-way oil volatility from Iran (detailed in the USOIL piece), down 2.85% today creating near-term weak-CAD pressure. VIX cooling for 3 straight days (18.4 → 17.47 → 16.45). BoC's Macklem shifted mixed-to-hawkish. Data corrections: US2Y 4.18% (not 3.693%); US CPI 4.2% (not 2.4%). D1 structure: wave (3) peaked ~1.42 on target, wave (4) fell deeper than expected to 1.394-1.397, now recovering to retest the 1.415-1.417 pivot. Wave (5) target: 1.4447 then 1.4540. Invalidation below 1.400. Scenarios: holds and continues toward 1.4447-1.4540 (40%); range 1.400-1.420 pending confirmation (40%); break below 1.400 invalidating the thesis (20%). No confirmed date/time yet for the FOMC minutes despite newsflow noting market attention. For informational purposes only, not investment advice.

USOIL - Last Week's Bearish Thesis Invalidated as Price Clears 73.35, Iran War Escalation Reverses the Entire Oil-Glut Narrative

USOIL - Last Week's Bearish Thesis Invalidated as Price Clears 73.35, Iran War Escalation Reverses the Entire Oil-Glut Narrative

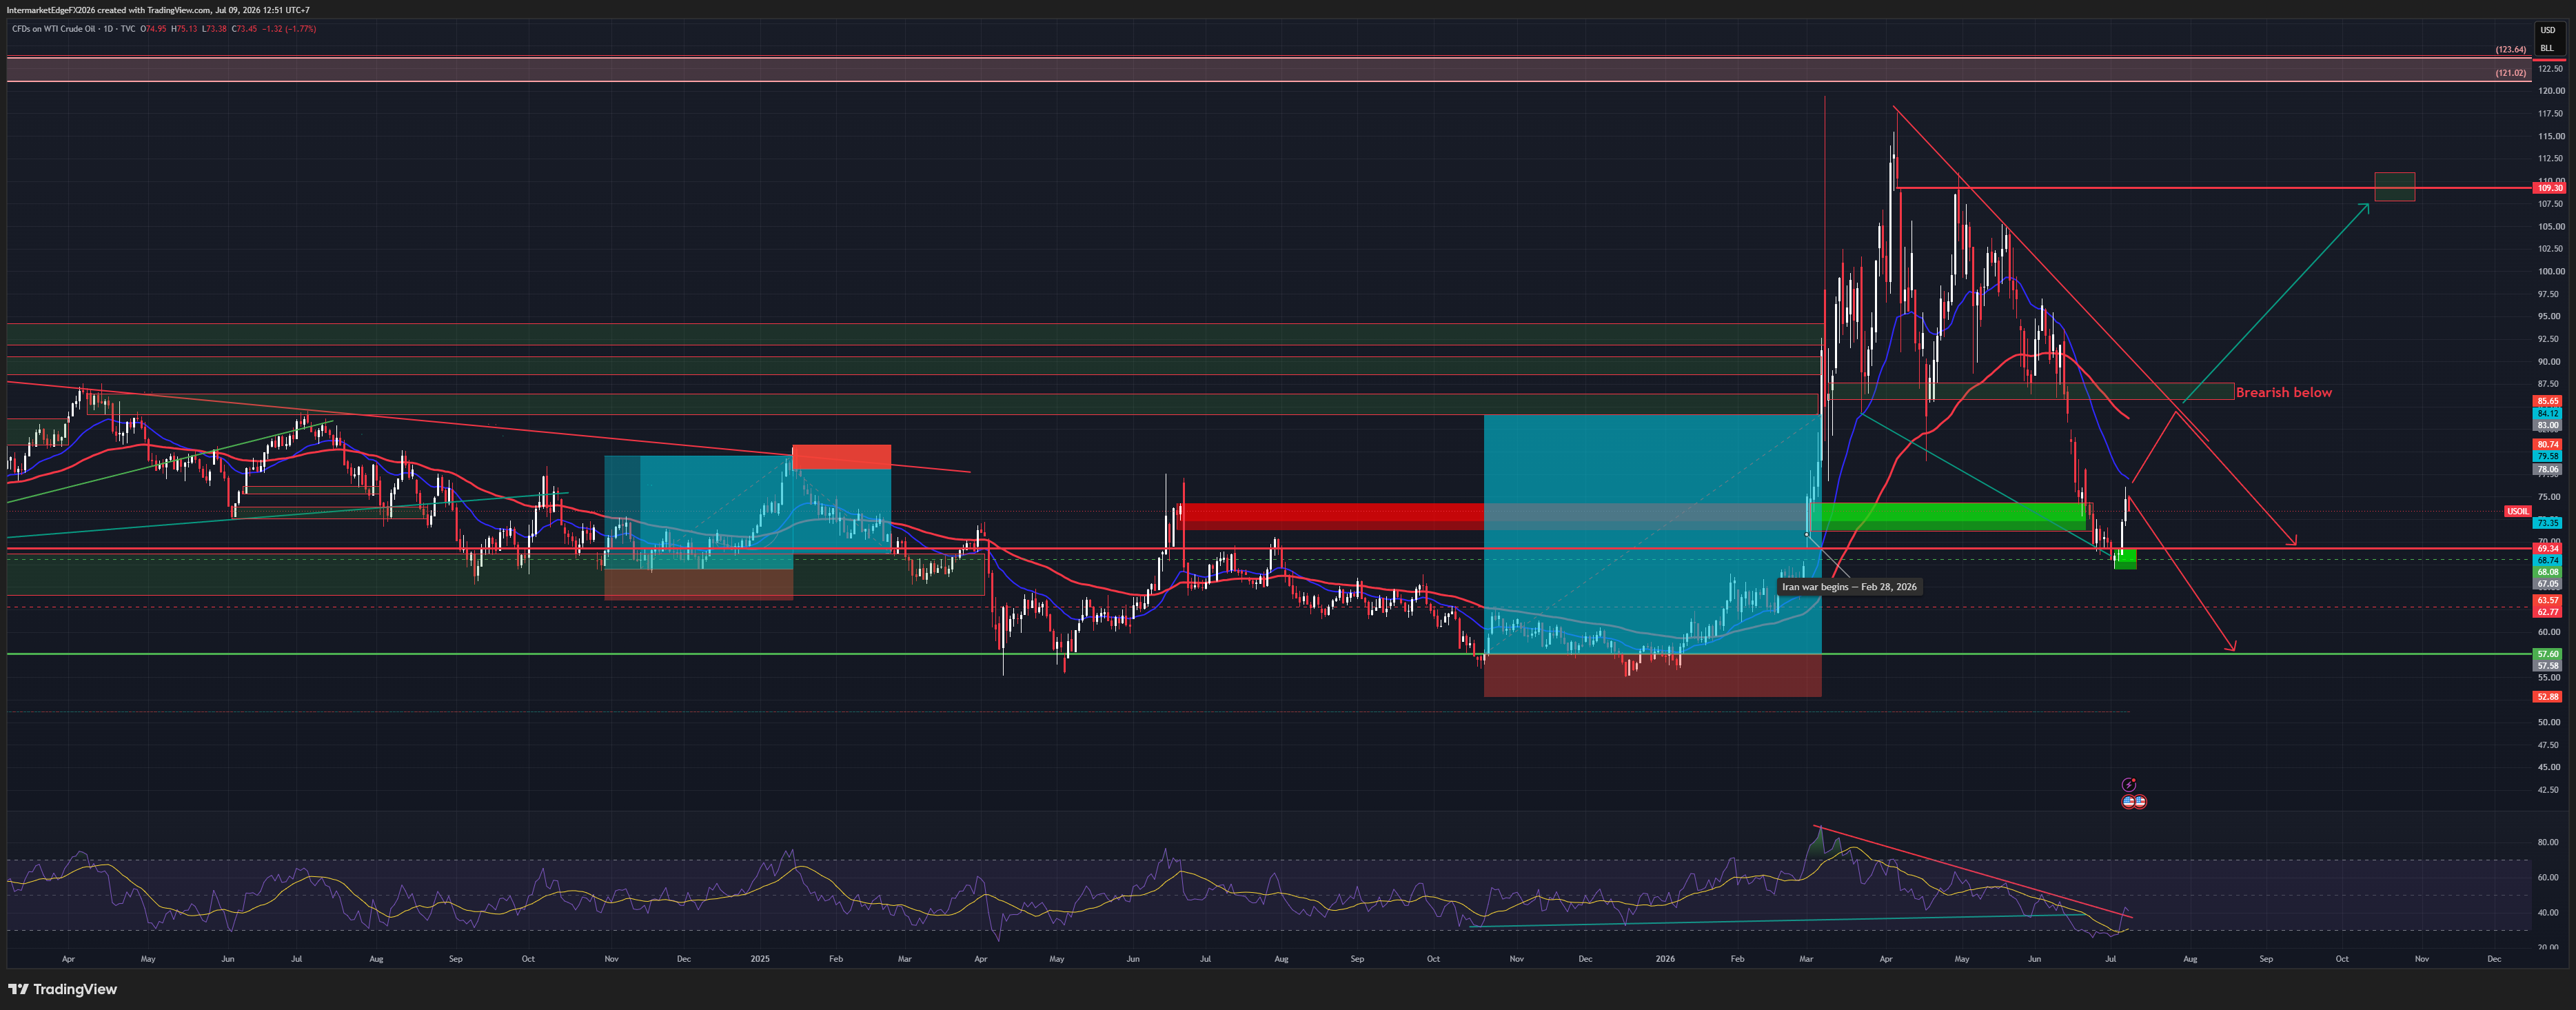
USOIL - SUMMARY 09/07/2026 Regime: Last week's High Bear thesis invalidated as price cleared the 73.35 invalidation level, due to Iran war escalation rather than analytical error. Shifted to Medium Bull (risk premium), moderate conviction. Bias: Medium Bull (risk premium), shifted from High Bear last week. New factors: US revoked Iran's oil sale authorization, struck 80+ targets, Iran retaliated against Bahrain and Kuwait, price surged as much as 7% in a session. Simultaneously, EIA reported a surprise inventory build of 2.998M, breaking an 8-week streak of draws -- a bearish fundamental signal being overwhelmed by risk premium. Key precedent: the Iran war's outbreak in February pushed Brent up 65% before fully reversing over 4 months. Caution warranted given this precedent could repeat. D1 structure: support 69-70, medium-term resistance 87.5-92.5. Upside target: 108-112. Downside target: 63.57-57.60. Scenarios: continued escalation toward 87.5-112 (35%); range 70-85 pending developments (40%); cooling as in the precedent, resuming the downtrend (25%). This is the hardest-to-forecast variable in the current 9-instrument basket; continuous monitoring of geopolitical developments is required. For informational purposes only, not investment advice.

USOIL - Five Consecutive Weekly Draws and Price Keeps Falling: When the Market Ignores Inventory, the Supply Narrative Is Winning Absolutely

USOIL - Five Consecutive Weekly Draws and Price Keeps Falling: When the Market Ignores Inventory, the Supply Narrative Is Winning Absolutely

USOIL - SUMMARY 02/07/2026 Regime: High Bear Continues, Supply Narrative in Total Control. USOIL 67.85 (-0.34%), the 67 target from last week's analysis has been hit. Falling channel from the 117.50 war peak remains intact. Bias: High Bear. Core story: 5 consecutive weekly EIA draws totalling -33.3M barrels (1 July: -3.775M vs forecast -2.900M) -- the strongest destocking sequence this year -- and price still fell from 75 to 67.85. When a market ignores the most bullish data available, bulls have lost control. The strongest behavioural bearish signal that exists. Supply narrative: OPEC+ +411kbpd from June, Hormuz flows recovered (OCBC + UBS both cut forecasts), Iran-US talks progressing -- each round another leg lower. Data corrections: EIA -3.775M released (pipeline "awaiting" stale); CPI 4.2% (not 2.4%); real yield +0.28%. D1 structure: 69.34-73.35 support broken. Resistance: 69.34 / 73.35 (channel invalidation). Targets: 63.57 → 62.77 → 57.60 (major support Q4 2025 base -- where OPEC+ fiscal pressure peaks, production-cut intervention likely). Extension: 52.88. Scenarios: downtrend continues to 63.57 (50%); extends to 57.60 (25%); oversold bounce 69-73 then resumes (15%); Iran talks collapse, breakout 73-85 (10%). Event risk: NFP 3 July, EIA 8 July (sixth draw?), OPEC+ communique, Iran talks wildcard. Stops for shorts: above 69.34. For informational purposes only. Not financial advice.

USDCAD - CAD Hits a 14-Month Low as Oil Breaks Below $70 and DXY Holds a 13-Month High, a Double Squeeze Drives Wave (3) Toward 1.4447

USDCAD - CAD Hits a 14-Month Low as Oil Breaks Below $70 and DXY Holds a 13-Month High, a Double Squeeze Drives Wave (3) Toward 1.4447

USDCAD 1.4232 | Double squeeze: 13-month DXY high + oil below $70 | 25 June 2026 CAD hits a 14-month low, pressured from both sides simultaneously. USD leg: 13-month high post-hawkish FOMC. CAD leg: oil broke below $70 and the pre-war 71.11 support. When both legs tilt the same way, this is the strongest bullish configuration. BoC Macklem today: not seeing spillovers from higher oil prices into CPI. Implicitly dovish, BoC in no hurry to hike. Canada benchmark yields slipping. CAD at a 14-month low as tech selloff drives safe-haven into USD. AUDUSD at 0.691, broad commodity FX weakness. CAD weakness is not idiosyncratic. D1 structure: wave (3) impulse running. Target 1.4447 then 1.4540. Support 1.4100 then 1.3993. Invalidation: below 1.3476. Three scenarios: → Wave (3) continues to 1.4447 then 1.4540. Probability: 45% → Sub-wave 4 correction to 1.40 then resumes. Probability: 25% → Oil bounces + dovish Fed, drops to 1.39. Probability: 15% The tell: both legs tilting simultaneously. DXY strongest in 13 months, CAD weakest in 14. Not a coincidence. A double squeeze. Conviction: High Bull (upgraded from Med-High). --- Intermarket Edge | Institutional Macro & Intermarket Analysis For informational purposes only. Not financial advice.

USOIL - Below $71 Confirms the War Premium Fully Erased, Persian Gulf Flows Accelerate as the Market Shrugs Off a -6M Draw

USOIL - Below $71 Confirms the War Premium Fully Erased, Persian Gulf Flows Accelerate as the Market Shrugs Off a -6M Draw

USOIL $69.36 | Below $71, war premium fully erased | 25 June 2026 Last week: "Do not chase shorts into 71.11. A break confirms a further leg, target 67 then 63." It broke. Oil now $69.36, below the pre-war starting point. The most notable signal: the EIA drew 6.088M (forecast just 3.9M), the second consecutive larger-than-expected draw. The market shrugged it off entirely. Oil kept falling. When good news is ignored, the selling force dominates. Three forces: Persian Gulf flows accelerating as Hormuz reopens; global supply recovering + OPEC+ +411kbpd; DXY 101 at a 13-month high. Leading headlines: "Oil Sinks Toward Pre-War Levels", "Crude Oil Falls Below $70", "Oil Market Shrugs Off Large Crude Stock Draw." D1 structure: 71.11 broken (now resistance). Nearby support 67.05 then 63.57 then 62.77. Deep: 57.60 (pre-war bottom). Invalidation: daily close above 74.49. Three scenarios: → Continued decline to 67.05 then 63.57. Probability: 45% → Hormuz fully reopens, accelerates to 57.60. Probability: 25% → Technical bounce to test 71.11 (broken support), resumes lower. Probability: 20% The tell: two consecutive bullish draws, price still falls. The market has answered. Conviction: High Bear (upgraded from Medium Bear). --- Intermarket Edge | Institutional Macro & Intermarket Analysis For informational purposes only. Not financial advice.

USDCAD - Wave (3) Impulse on Post-FOMC Dollar Strength, CAD at a 7-Month Low, a Wave (4) Pullback Sets Up the Wave (5) Push Toward 1.45

USDCAD - Wave (3) Impulse on Post-FOMC Dollar Strength, CAD at a 7-Month Low, a Wave (4) Pullback Sets Up the Wave (5) Push Toward 1.45

USDCAD 1.4115 | Wave (3) impulse on post-FOMC dollar strength | 18 June 2026 Two currencies moving in opposite directions met in one pair: the Fed projected a hike, and the Canadian dollar hit a 7-month low. The wave count says the big move hasn't started yet. USD leg: the FOMC on 17/06 held rates but projected a hike later in 2026 -- a hawkish dot plot. The dollar extended gains, DXY to a two-month high near 100.6. EUR/GBP/AUD all falling, confirming broad USD strength. CAD leg: the Canadian dollar at a 7-month low (newsfeed: "Canadian Dollar Hits 7-Month Low"). Crude ticked up to 74.46 but stays low after the war premium unwound -- pressure on CAD. The pipeline showed you the wrong numbers. Fed pipeline: "Hold 2026, hike Apr 2027." Actual: hold + projected hike later 2026 (hawkish, done). Pipeline CPI US 2.4%. Actual 4.2%, real yield 0.263%. D1 structure: a bullish Elliott impulse. (1) ~1.38, (2) ~1.347, (3) now ~1.414. Price at 1.4115, just below the 1.41388 resistance. The chart expects a wave (4) pullback to the fib region 1.39 (0.382) / 1.385 (0.5) / 1.378 (0.618), pivot 1.39660. Then wave (5) up to 1.44473 → 1.45400. Three scenarios: → Wave (4) to 1.39-1.385 then wave (5) up to 1.44473. Probability: 40% → Direct break above 1.41388 toward 1.44473, shallow pullback. Probability: 25% → Deeper wave (4) to 1.378 then resume up. Probability: 20% Invalidation: daily close below 1.347 (early warning: a break of 1.378). The tell: the wave (4) pullback. A hold above 1.378 with the dollar firm keeps the path to 1.45 alive. Position around the 1.39-1.385 fib region rather than chasing at the top. Conviction: Medium-High Bull. --- Intermarket Edge | Institutional Macro & Intermarket Analysis For informational purposes only. Not financial advice.

USOIL - The War Premium Fully Unwound to Pre-War Support, a Post-FOMC Bearish Tide Meets a Bullish -8.263M Draw

USOIL - The War Premium Fully Unwound to Pre-War Support, a Post-FOMC Bearish Tide Meets a Bullish -8.263M Draw

USOIL $73.58 | War premium fully unwound to pre-war support | 18 June 2026 Oil has handed back nearly the entire Iran-war rally and returned to where it started. Here, a bearish tide meets a bullish draw. The Iran war broke out Feb 28, lifting oil from ~57-70 to a 120 peak (April). The peace deal and the prospect of a Hormuz reopening have drained the haven premium steadily. Now 73.58, back in the pre-war zone. Last night's hawkish FOMC lifted DXY to ~100, VIX to 18.43, equities lower. A strong dollar plus demand risk is another bearish layer for oil. Add OPEC+ raising +411kbpd. But against the tide: the EIA draw was -8.263M (forecast just -3.6M, prior -7.227M). US supply is tightening -- a real support. The newsfeed agrees: "Tightness in US Crude Supplies Supports Prices." The pipeline showed you the wrong field. Pipeline EIA: "awaiting release." Actual: -8.263M. DXY now ~100 (jumped post-FOMC). D1 structure: key support 74.49-71.11 (pre-war zone). Resistance 78.06 → 80.74. A break of 71.11 opens 67-68 → 63.57. Three scenarios: → Hold 71.11 + inventory tightness: technical bounce toward 78-80. Probability: 35% → Break 71.11 (Hormuz fully reopens + OPEC + strong dollar): toward 67 then 63. Probability: 35% → Standoff, bearish macro vs bullish draw: 71-78. Probability: 30% Invalidation: daily close above 80.74. The tell: the 71.11 support against the inventory draws. A break with Hormuz fully reopening sends oil to 67; a hold on tightness bounces it to 78. Do not chase shorts into 71.11. Conviction: Medium Bear at support, two-sided. Intermarket Edge | Institutional Macro & Intermarket Analysis For informational purposes only. Not financial advice.

USDCAD — BoC Fifth Consecutive Hold, Macklem Admits Stagflationary Dilemma, and Oil Rising Is No Longer Bullish for CAD

USDCAD — BoC Fifth Consecutive Hold, Macklem Admits Stagflationary Dilemma, and Oil Rising Is No Longer Bullish for CAD

USDCAD 1.3984 | Oil rising, CAD weakening | 11 June 2026 Oil rose $2.50 today on Iran-Hormuz news. The Canadian dollar weakened. The oil-CAD channel has inverted — and understanding why is the entire analytical framework for this pair right now. The current oil spike is geopolitical risk premium, not demand-driven. Geopolitical oil creates safe-haven dollar demand simultaneously. The dollar safe-haven channel is dominant. Standard oil-CAD heuristic = systematically wrong in this regime. BoC held for the fifth consecutive time at 2.25% on June 10. The language change matters more than the decision. April: "changes can be expected to be small." June: "economic weakness combined with rising inflation is a dilemma." Macklem also explicitly opened the cut door: "we may need to cut further if US trade restrictions intensify." Most dovish BoC forward guidance since the current hold cycle began. Result: BoC in stagflationary paralysis. Fed pricing a hike at 40%. Forward curves diverging further. BoC-Fed differential structural, not just cyclical. AUDCAD at 0.9773 — below 1.000 for 21 consecutive sessions. USMCA discount: structural and persistent. Bull confirmation: daily close above 1.4099. Targets: 1.4099 → 1.4139 → 1.4200. Invalidation: Iran MOU approved. Warsh FOMC June 16-17 is the gating event. Conviction: Medium-High Bull.

USDCAD: Canadian Dollar Hits Six-Week Low as USMCA Headline Risk Grows - USDCAD at the Crossroads of Oil Decompression and Dollar Structural Bid

USDCAD: Canadian Dollar Hits Six-Week Low as USMCA Headline Risk Grows - USDCAD at the Crossroads of Oil Decompression and Dollar Structural Bid

**The Canadian dollar just hit a six-week low. And the reason is not oil.** Everyone watching CAD is focused on the Iran deal decompression and WTI direction. They are missing the more important driver that appeared in today's headline: USMCA headline risk. USMCA is the backbone of Canada-US trade. Approximately 75% of Canadian exports go to the US market. Any renegotiation signal, tariff threat, or deterioration in USMCA terms is a structural CAD negative that operates entirely independently of oil price. CAD can weaken even when oil is rising. That is what is happening right now. The proof is in AUDCAD. AUD is a commodity currency similar to CAD but without USMCA exposure. AUDCAD is sitting at 0.9864, below 1.000. CAD is underperforming AUD. That is not a commodity story. That is a Canada-specific story. USDCAD is now navigating three independent forces simultaneously: USMCA risk - Canada-specific, unrelated to oil, unscheduled catalyst Iran deal oil decompression - WTI bear thesis toward $74-71, structurally bearish CAD Fed-BoC differential - if BoC cuts before Fed on Canada slowdown, rate divergence accelerates USDCAD higher DXY below 100 and the EIA crude draw of 7.9M bbl (from earlier today's analysis) are the counterforces keeping USDCAD flat rather than spiking. The chart shows two competing Elliott Wave counts converging at 1.3842. Both point toward the 1.4099-1.4139 resistance zone as the next major target if bullish drivers align. The wave (b) demand zone at 1.3540-1.3593 is the floor if USMCA reassurance materializes. Two tells to watch: AUDCAD continuing below 0.9864 toward 0.97 = USMCA risk is real, USDCAD rallies AUDCAD bouncing back above 1.00 = USMCA risk fading, USDCAD pulls back The most dangerous scenario: USMCA risk escalates at the same time the Iran deal is signed. Oil drops (bearish CAD) while trade risk increases (also bearish CAD). USDCAD would test 1.42+ with very little resistance. Conviction: Medium. Bias: Mildly bullish USDCA

InterMarketEdge

© 2026 InterMarketEdge. Financial intelligence for inter-market traders.