Tag: Commodity — InterMarketEdge

Tag: Commodity

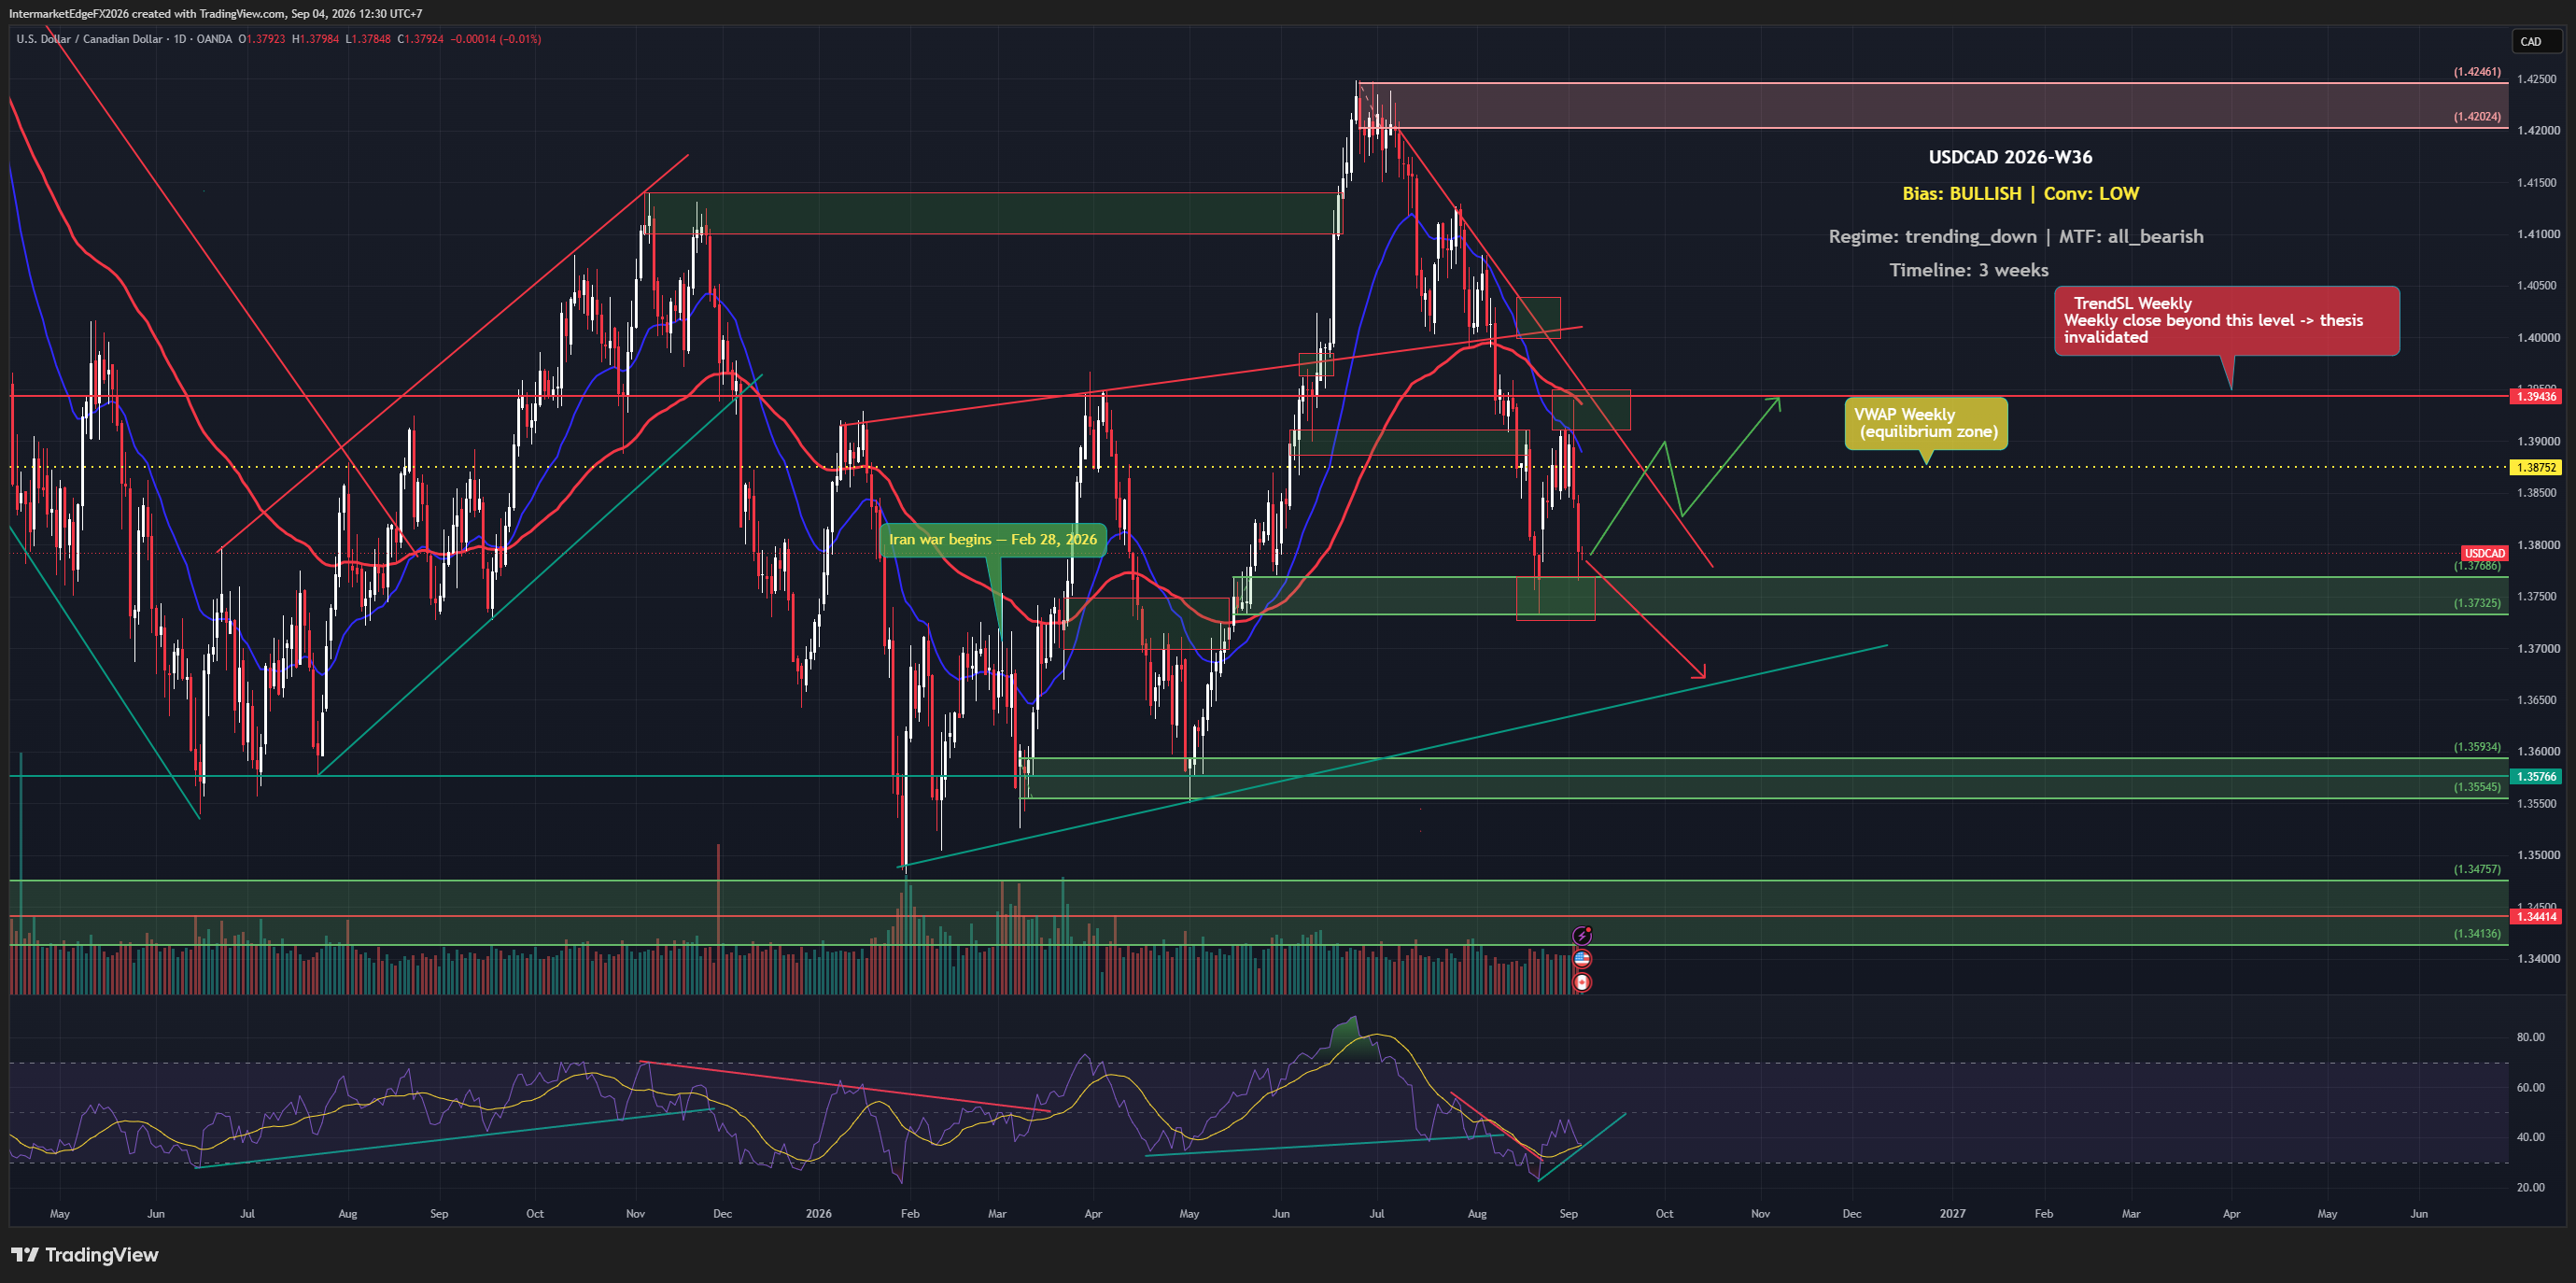
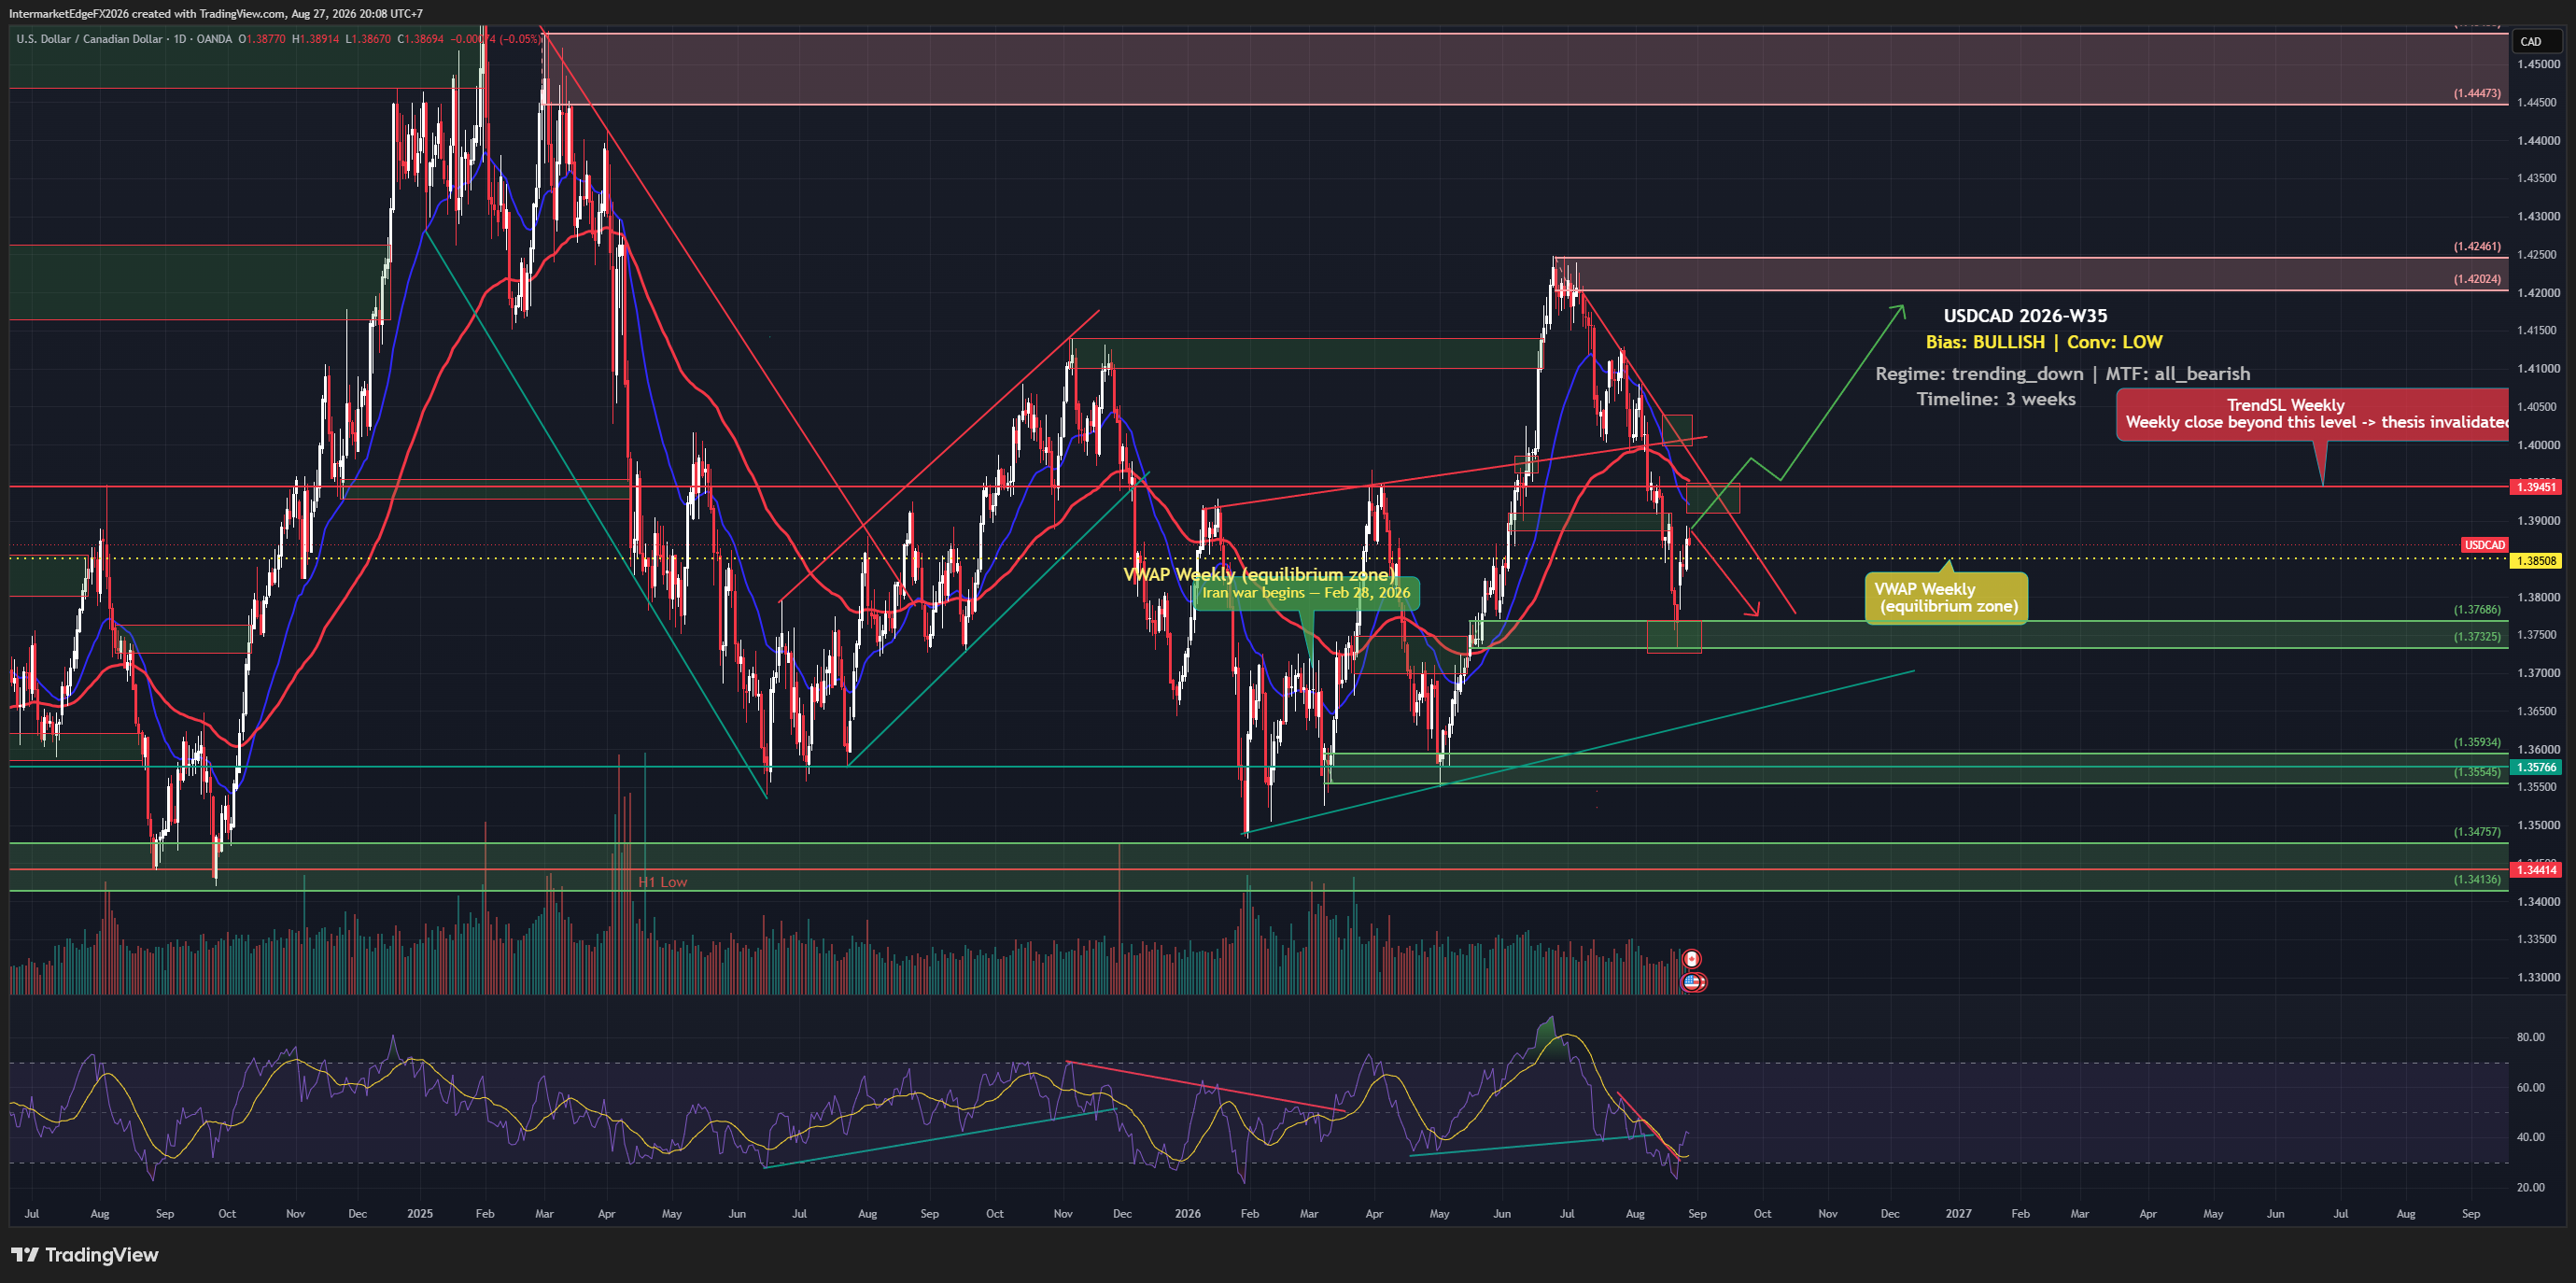
USDCAD - Wave 4 Recovers From a Deeper-Than-Expected Pullback, Price Retests the 1.4174 Decision Zone Ahead of Wave 5 Toward 1.4447-1.4540

USDCAD - Wave 4 Recovers From a Deeper-Than-Expected Pullback, Price Retests the 1.4174 Decision Zone Ahead of Wave 5 Toward 1.4447-1.4540

USDCAD - SUMMARY 09/07/2026 Regime: Wave 4 completed a deeper-than-expected correction (1.394-1.397 instead of 1.415-1.417), now recovering to retest the 1.415-1.417 pivot from above. Medium-High Bull unchanged. Bias: Medium-High Bull. New factors: sharp two-way oil volatility from Iran (detailed in the USOIL piece), down 2.85% today creating near-term weak-CAD pressure. VIX cooling for 3 straight days (18.4 → 17.47 → 16.45). BoC's Macklem shifted mixed-to-hawkish. Data corrections: US2Y 4.18% (not 3.693%); US CPI 4.2% (not 2.4%). D1 structure: wave (3) peaked ~1.42 on target, wave (4) fell deeper than expected to 1.394-1.397, now recovering to retest the 1.415-1.417 pivot. Wave (5) target: 1.4447 then 1.4540. Invalidation below 1.400. Scenarios: holds and continues toward 1.4447-1.4540 (40%); range 1.400-1.420 pending confirmation (40%); break below 1.400 invalidating the thesis (20%). No confirmed date/time yet for the FOMC minutes despite newsflow noting market attention. For informational purposes only, not investment advice.

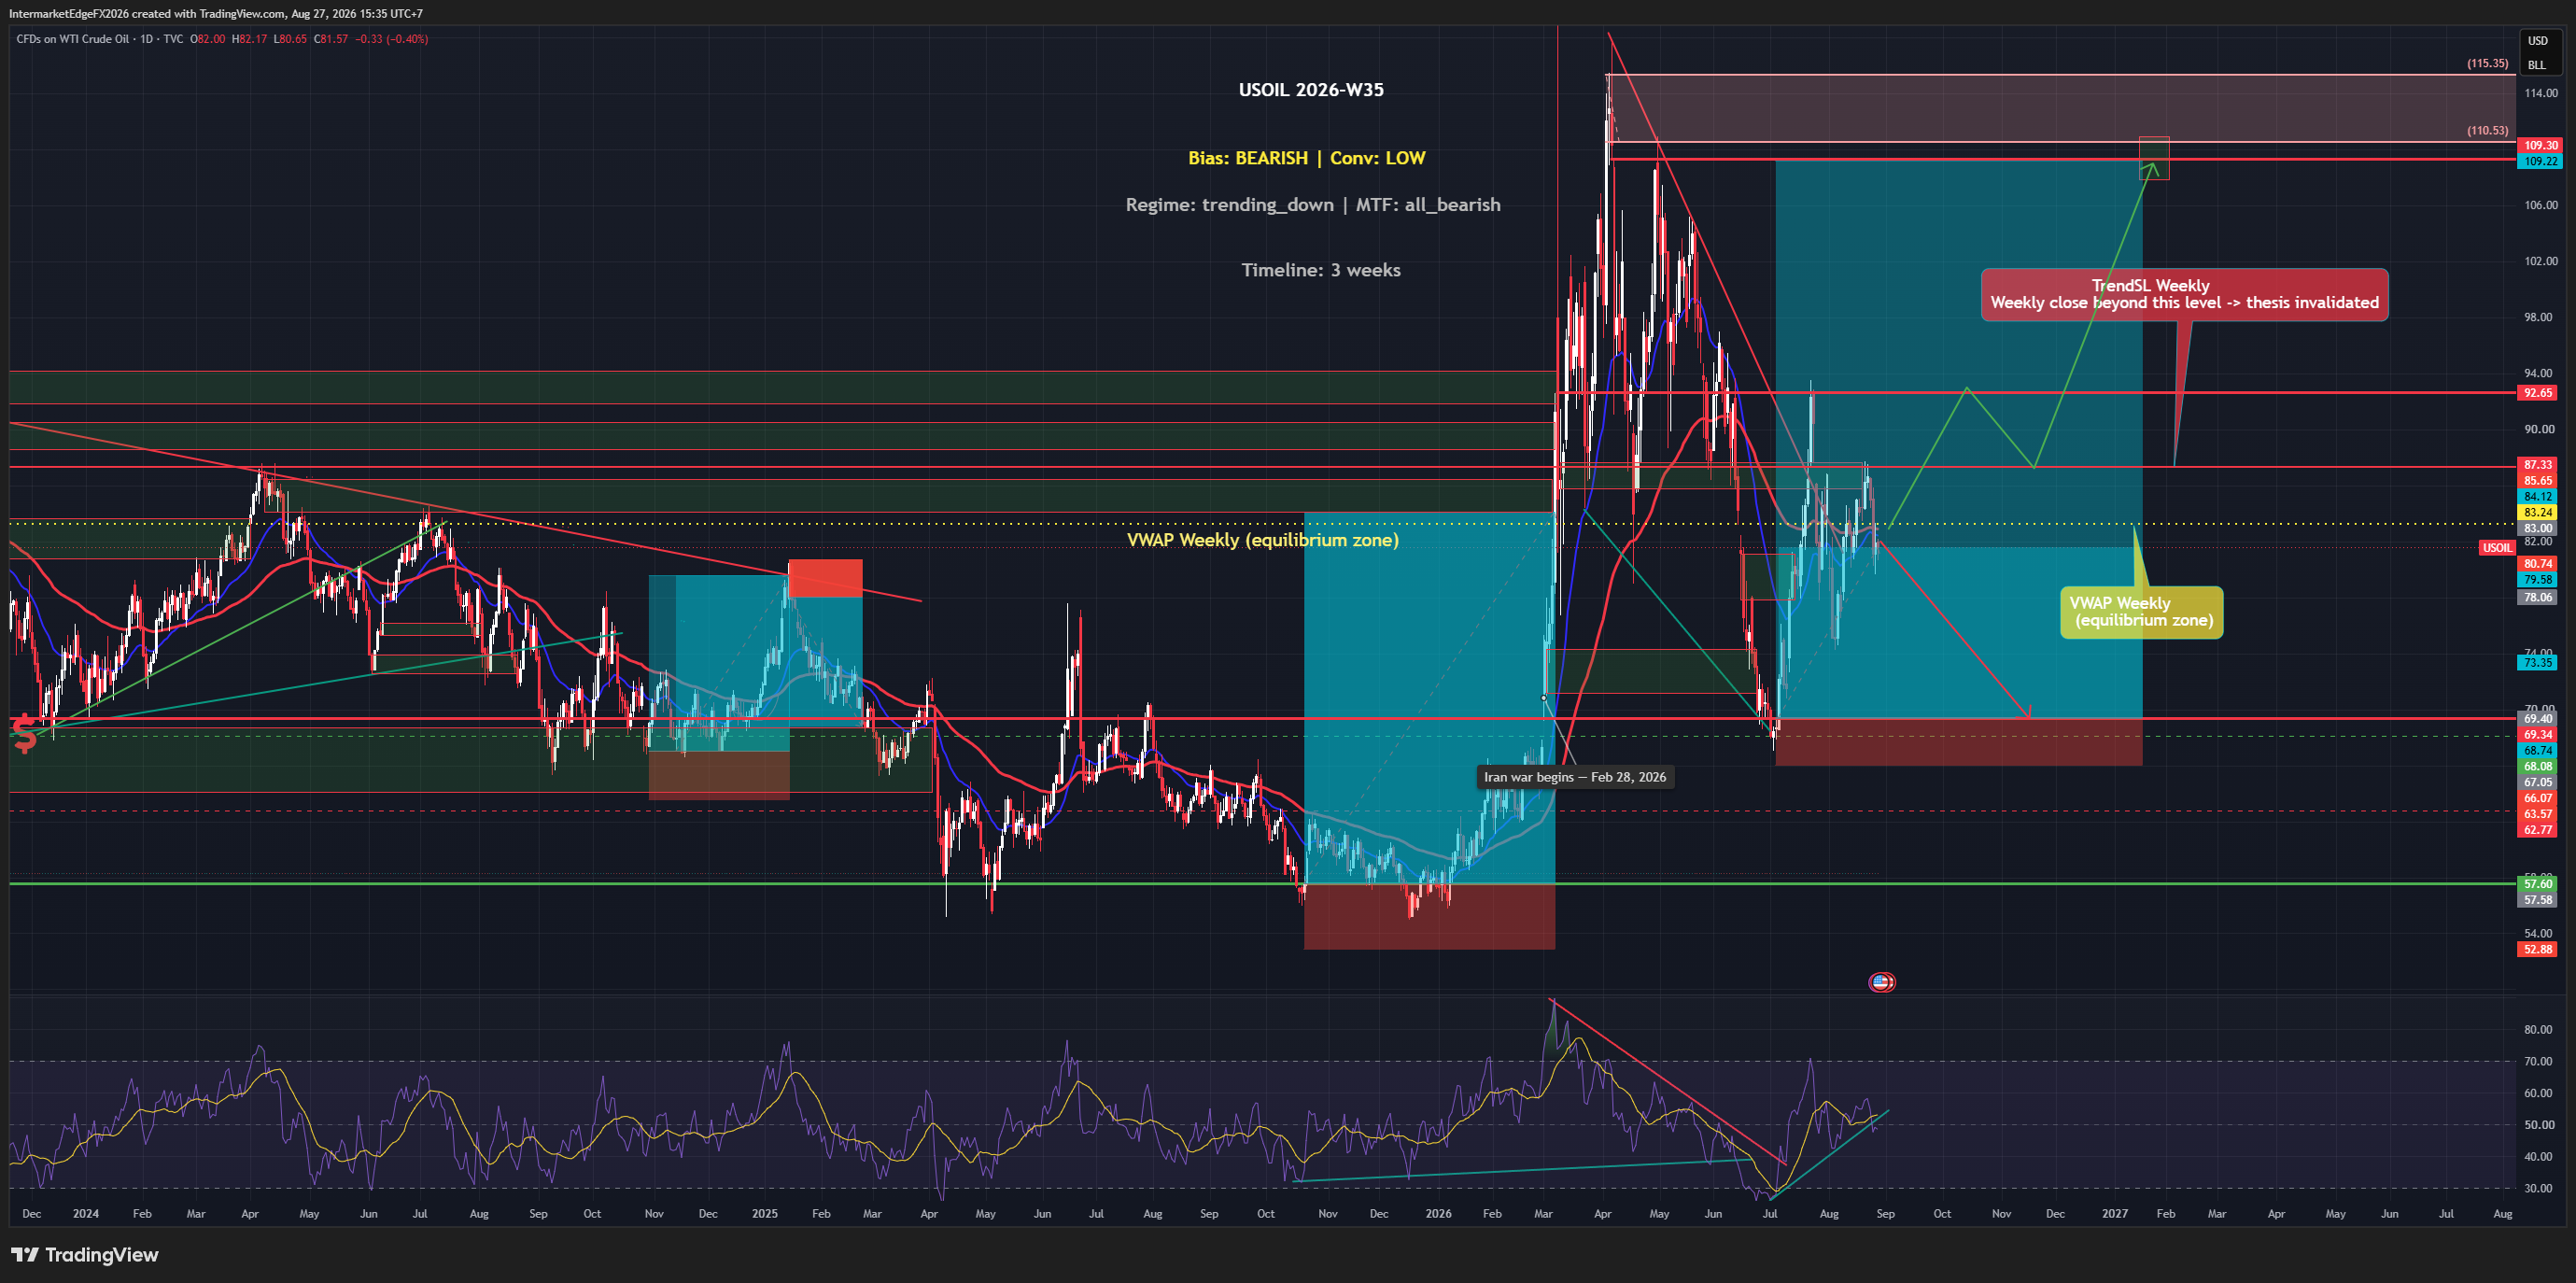
USOIL - Last Week's Bearish Thesis Invalidated as Price Clears 73.35, Iran War Escalation Reverses the Entire Oil-Glut Narrative

USOIL - Last Week's Bearish Thesis Invalidated as Price Clears 73.35, Iran War Escalation Reverses the Entire Oil-Glut Narrative

USOIL - SUMMARY 09/07/2026 Regime: Last week's High Bear thesis invalidated as price cleared the 73.35 invalidation level, due to Iran war escalation rather than analytical error. Shifted to Medium Bull (risk premium), moderate conviction. Bias: Medium Bull (risk premium), shifted from High Bear last week. New factors: US revoked Iran's oil sale authorization, struck 80+ targets, Iran retaliated against Bahrain and Kuwait, price surged as much as 7% in a session. Simultaneously, EIA reported a surprise inventory build of 2.998M, breaking an 8-week streak of draws -- a bearish fundamental signal being overwhelmed by risk premium. Key precedent: the Iran war's outbreak in February pushed Brent up 65% before fully reversing over 4 months. Caution warranted given this precedent could repeat. D1 structure: support 69-70, medium-term resistance 87.5-92.5. Upside target: 108-112. Downside target: 63.57-57.60. Scenarios: continued escalation toward 87.5-112 (35%); range 70-85 pending developments (40%); cooling as in the precedent, resuming the downtrend (25%). This is the hardest-to-forecast variable in the current 9-instrument basket; continuous monitoring of geopolitical developments is required. For informational purposes only, not investment advice.

EURUSD - Price Sits Right Beside the 1.138 Trigger as Iran Geopolitical Risk Keeps VIX Elevated, 1.119-1.120 Target Awaits Confirmation

EURUSD - Price Sits Right Beside the 1.138 Trigger as Iran Geopolitical Risk Keeps VIX Elevated, 1.119-1.120 Target Awaits Confirmation

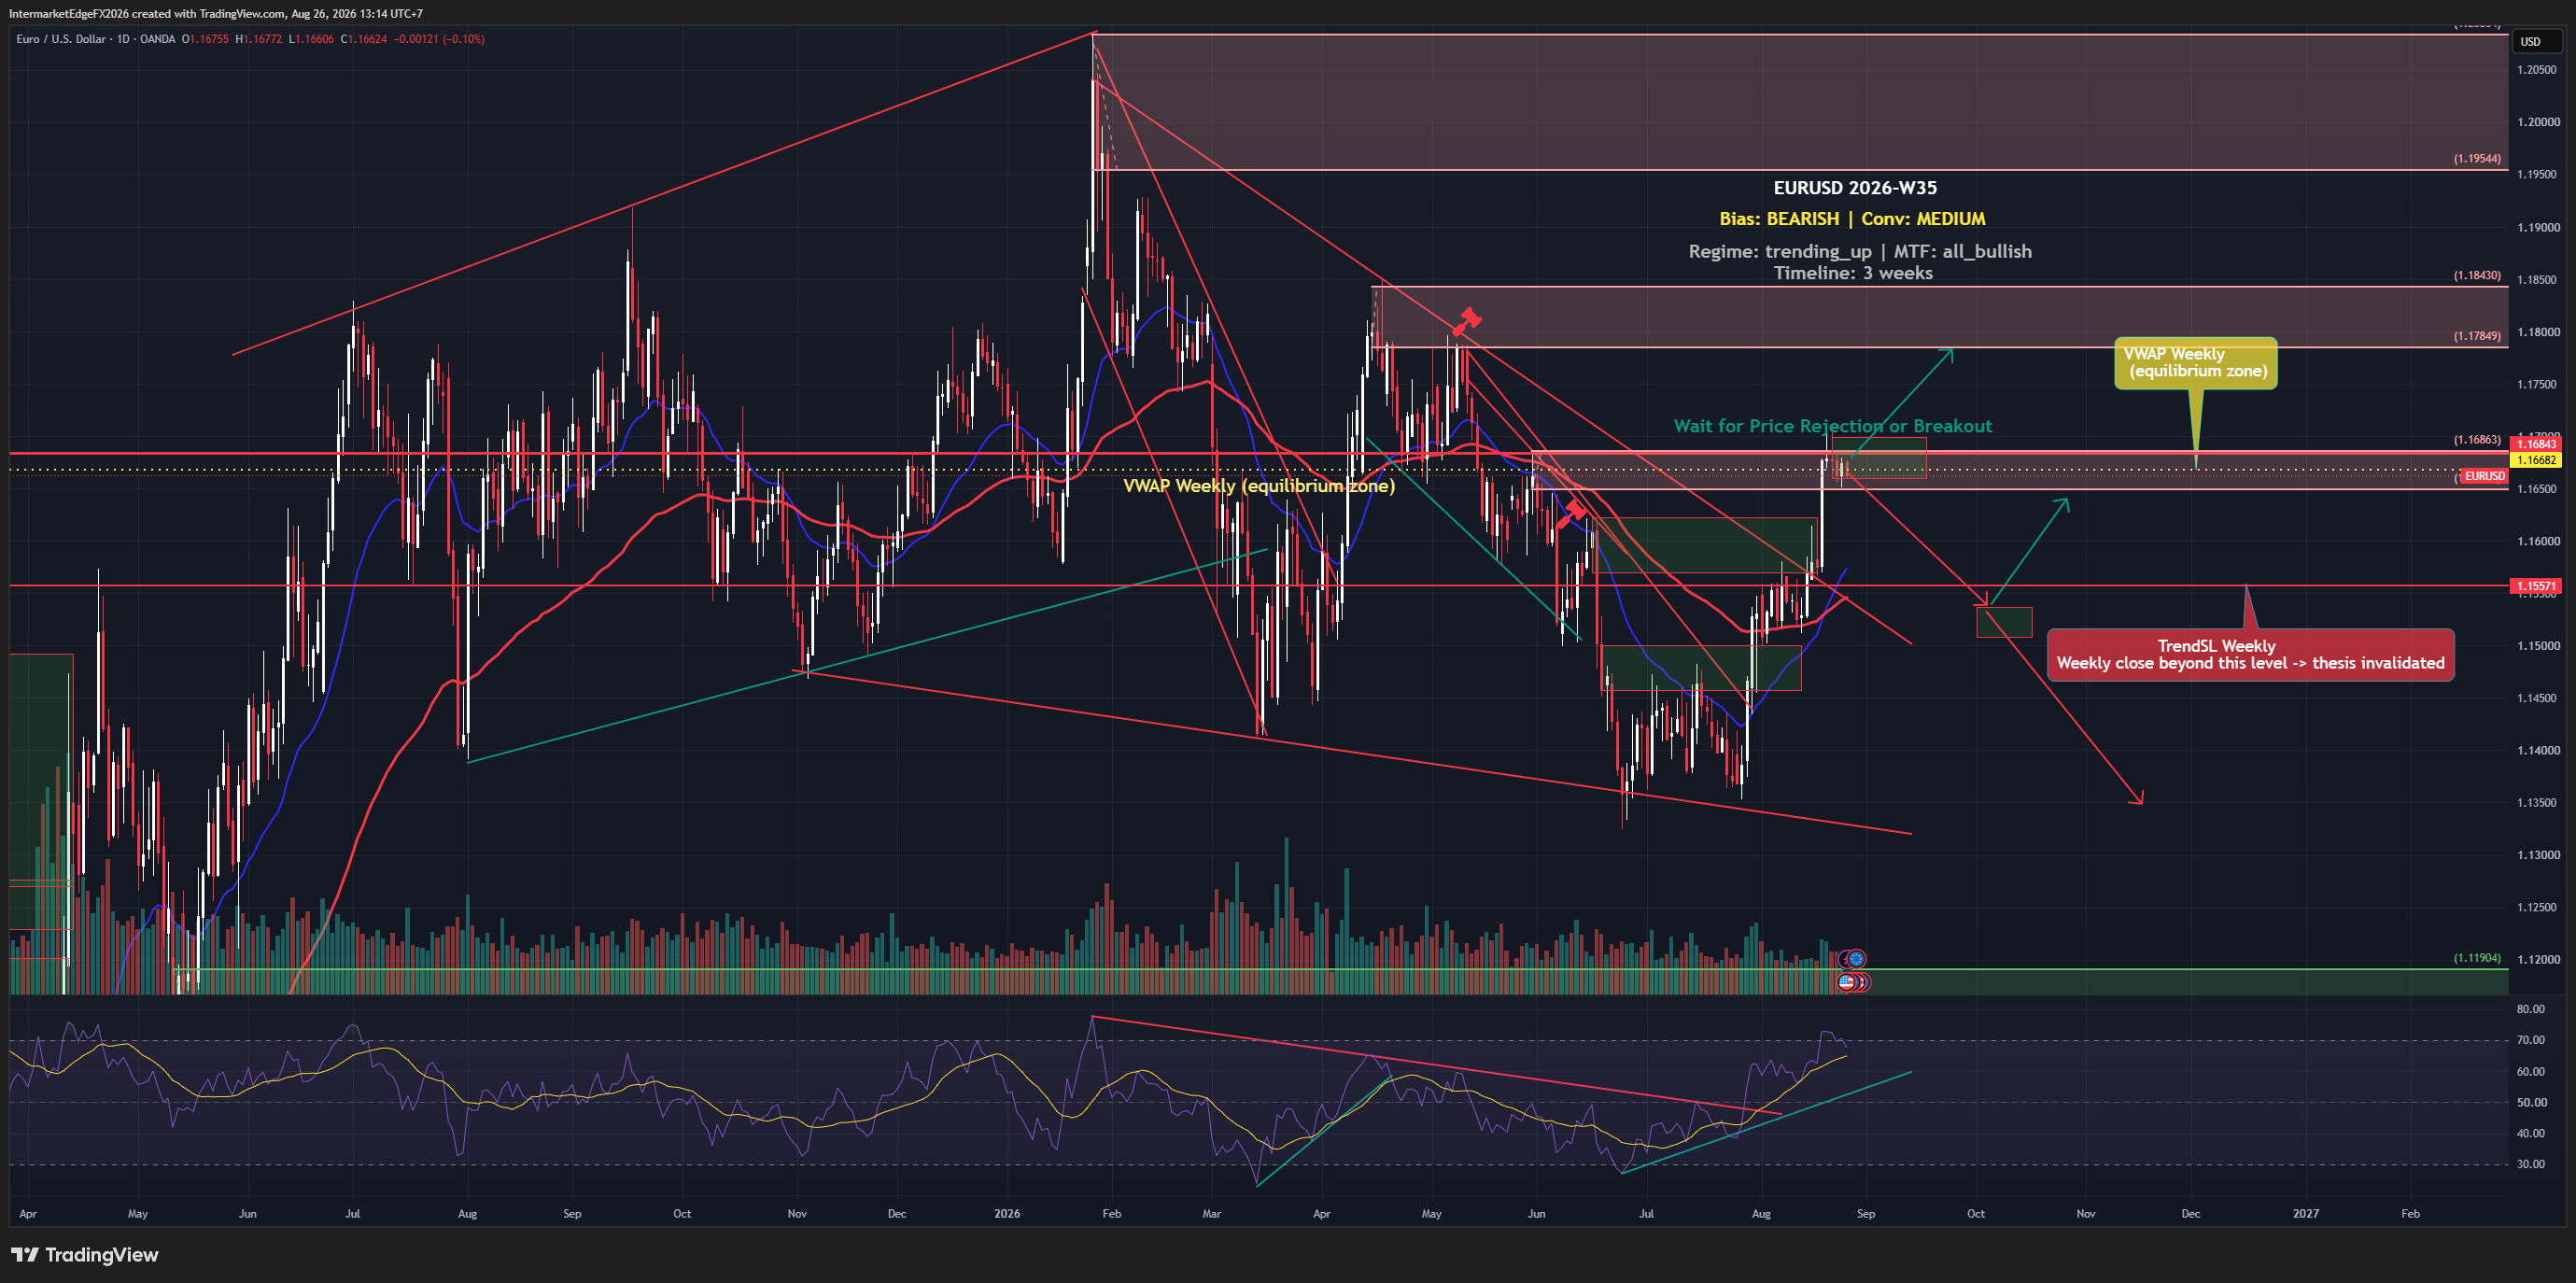
EURUSD - SUMMARY 08/07/2026 Regime: Price sits right at last week's identified 1.138 trigger, High Bear unchanged. Four aligned forces: DE-US spread -1.51%, Fed hawkish post-Warsh FOMC, ECB merely neutral, Iran geopolitical risk pushing VIX to 17.47 and oil sharply higher. Bias: High Bear, one of the highest-conviction theses in the 9-instrument basket. New factor: US-Iran geopolitical risk (full detail in the same-day EURJPY piece) adding energy-cost pressure on Europe. Data corrections: DE10Y 3.05%, DE-US spread -1.51% (not the pipeline's own -1.571%); US CPI 4.2% (not 2.4%). D1 structure: wave (c) in its final wave 5, declining from the wave 4 consolidation (1.155-1.160) to test the Battle Zone 1.138-1.155. A close below 1.138 confirms the move toward 1.119-1.120. Invalidation above 1.157. Scenarios: close below 1.138 toward 1.119-1.120 (45%); range 1.138-1.155 pending confirmation (35%); bounce testing 1.157-1.160 (15%); decisive break above 1.157 invalidating the thesis (5%). Close monitoring needed over the next 24-48 hours given unresolved geopolitical risk. For informational purposes only, not investment advice.

EURGBP - The -1.84% DE-GB Spread Remains the Main Drag, Price Tests a Wave (4) Zone Near 0.8544 Ahead of 0.841-0.846

EURGBP - The -1.84% DE-GB Spread Remains the Main Drag, Price Tests a Wave (4) Zone Near 0.8544 Ahead of 0.841-0.846

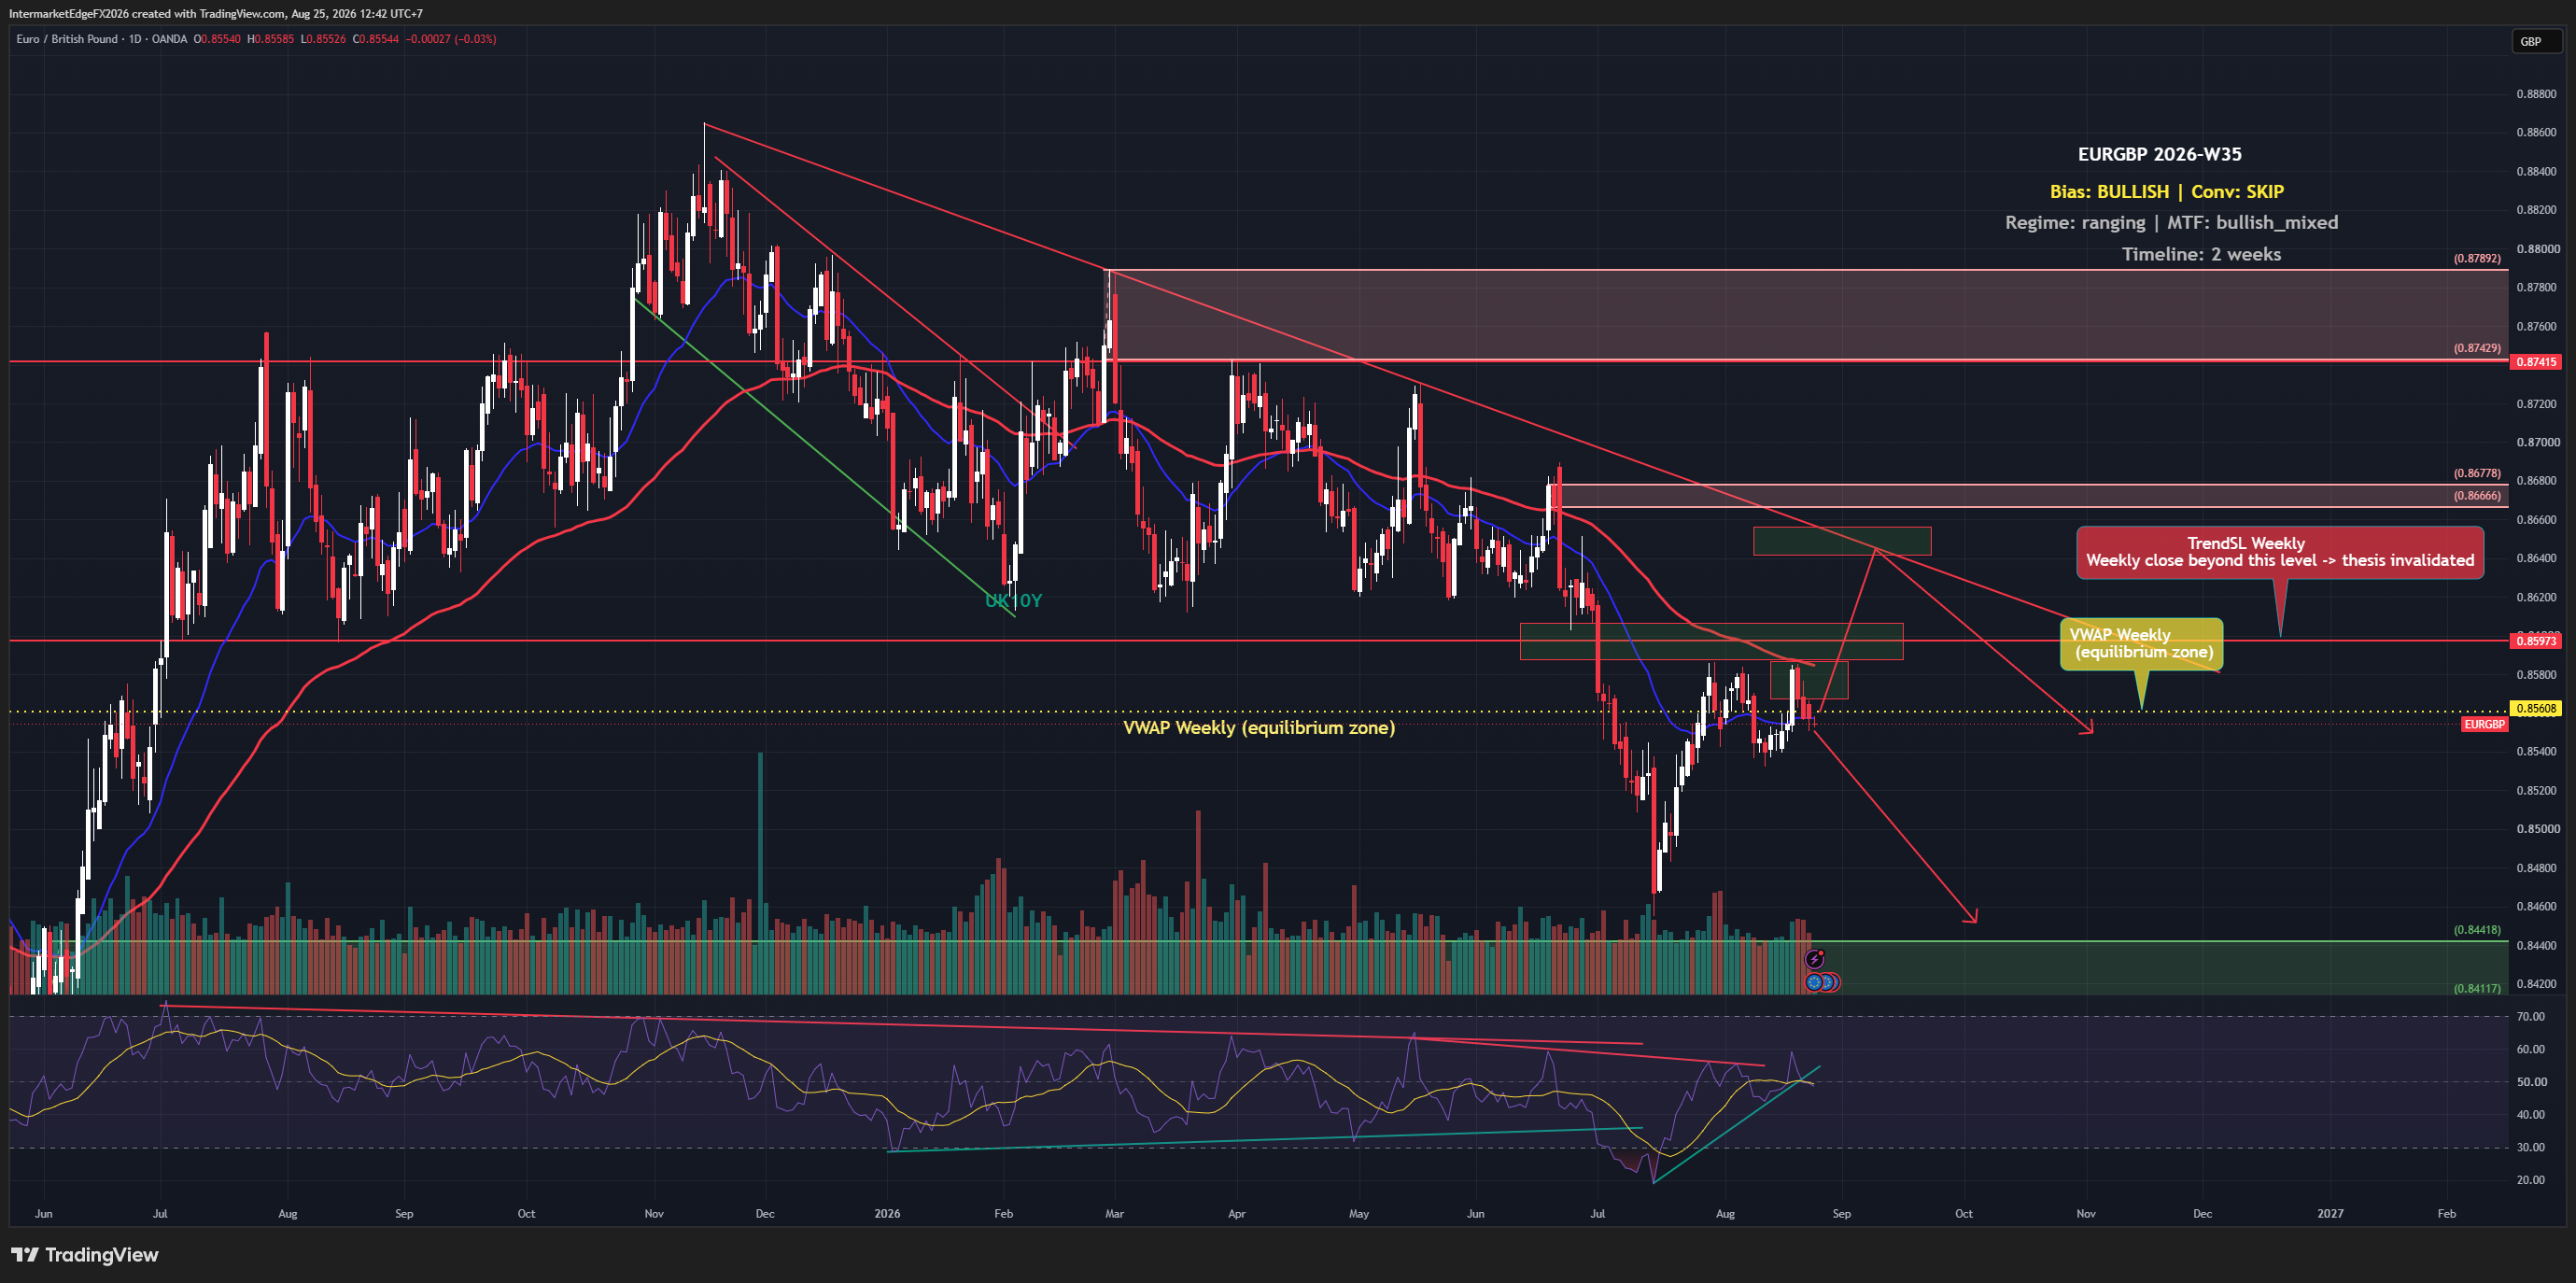
EURGBP - SUMMARY 07/07/2026 Regime: The -1.84% DE-GB spread unchanged from last week, still the main drag. Medium Bear (carry). Price tests a local low zone (wave 4) near 0.8540-0.8556 after a long decline from the 0.888 peak. Bias: Medium Bear (carry), unchanged from last week. New factors: sterling posted its best weekly gain in 12 weeks vs the dollar, reportedly easing political risk (details unconfirmed), reinforcing sterling's relative strength vs the euro. ECB's Wunsch made a more hawkish remark than expected but it's individual, not policy. Data corrections: DE10Y 2.96% (not 2.99%); UK10Y 4.80% (not 4.50%); ECB neutral hold 2.00% (not cutting cycle 2.50%). D1 structure: large peak at 0.888, decline breaking 0.874, 0.870, 0.8611, now testing wave (4) at 0.8540-0.8556. Target: 0.841-0.846. Invalidation above 0.870. Scenarios: continued decline toward 0.841-0.846 (45%); range 0.850-0.861 pending confirmation (35%); bounce above 0.861 testing 0.870 (15%); decisive break above 0.870 invalidating thesis (5%). For informational purposes only, not investment advice.

USDJPY - Resistance at 161.94 Still Unbroken After Repeated Tests, MoF Intervention Risk Rising, Wave (a) Correction Targets 155.2

USDJPY - Resistance at 161.94 Still Unbroken After Repeated Tests, MoF Intervention Risk Rising, Wave (a) Correction Targets 155.2

USDJPY - SUMMARY 03/07/2026 Regime: Wave (5) Exhaustion Confirmed, Medium Bear Near-Term. USDJPY 161.11 (0.00%), the 161.940 resistance has been tested repeatedly for over a week without breaking. Bias: Medium Bear near-term (not High given the wildcards). Three high-conviction bearish forces: (1) classic 161.940 resistance exhaustion, (2) actual US-JP carry spread only 1.71% (pipeline wrongly reports 3.015% using stale JP10Y 1.47%), (3) rising MoF intervention risk (Katayama remarks, confirmed "ambush tactics" per news). Additionally: NFP preview shows June expected to slow to 110K -- dovish risk if accurate. Further confirmation: VIX -2.65% risk-on today yet resistance still unbroken -- 161.940 is a genuine technical chokepoint. Data corrections: JP10Y 2.77% (not 1.47%); US-JP spread 1.71% (not 3.015%); US CPI 4.2% (not 2.4%); real yield +0.28% (not 2.085%); BoJ already hiked to 1.00% (not Hold). D1 structure: wave (a) correction expected along Fib 158.953 (0.382) → ~157 (0.5) → 155.207-154.539 (0.618, primary target). Scenarios: wave (a) confirmed toward 155.2 (45%); sideways awaiting NFP (25%); NFP strong, final breakout before correcting (15%); actual MoF intervention, sharp decline (15%). Do not chase long at resistance without confirmed breakout. Invalidation: daily close above 161.940. For informational purposes only. Not financial advice.

USOIL - Five Consecutive Weekly Draws and Price Keeps Falling: When the Market Ignores Inventory, the Supply Narrative Is Winning Absolutely

USOIL - Five Consecutive Weekly Draws and Price Keeps Falling: When the Market Ignores Inventory, the Supply Narrative Is Winning Absolutely

USOIL - SUMMARY 02/07/2026 Regime: High Bear Continues, Supply Narrative in Total Control. USOIL 67.85 (-0.34%), the 67 target from last week's analysis has been hit. Falling channel from the 117.50 war peak remains intact. Bias: High Bear. Core story: 5 consecutive weekly EIA draws totalling -33.3M barrels (1 July: -3.775M vs forecast -2.900M) -- the strongest destocking sequence this year -- and price still fell from 75 to 67.85. When a market ignores the most bullish data available, bulls have lost control. The strongest behavioural bearish signal that exists. Supply narrative: OPEC+ +411kbpd from June, Hormuz flows recovered (OCBC + UBS both cut forecasts), Iran-US talks progressing -- each round another leg lower. Data corrections: EIA -3.775M released (pipeline "awaiting" stale); CPI 4.2% (not 2.4%); real yield +0.28%. D1 structure: 69.34-73.35 support broken. Resistance: 69.34 / 73.35 (channel invalidation). Targets: 63.57 → 62.77 → 57.60 (major support Q4 2025 base -- where OPEC+ fiscal pressure peaks, production-cut intervention likely). Extension: 52.88. Scenarios: downtrend continues to 63.57 (50%); extends to 57.60 (25%); oversold bounce 69-73 then resumes (15%); Iran talks collapse, breakout 73-85 (10%). Event risk: NFP 3 July, EIA 8 July (sixth draw?), OPEC+ communique, Iran talks wildcard. Stops for shorts: above 69.34. For informational purposes only. Not financial advice.

EURJPY - Head & Shoulders Confirmed, DE-JP Spread Collapses to 0.25%, Neckline 181 Is the Trigger for Targets at 177 and 171

EURJPY - Head & Shoulders Confirmed, DE-JP Spread Collapses to 0.25%, Neckline 181 Is the Trigger for Targets at 177 and 171

EURJPY - SUMMARY 01/07/2026 Regime: H&S Confirmed, High Bear. EURJPY 185.058 (-0.35%), Right Shoulder 186.547 rejected, price declining toward neckline 181.018-181.047. Bias: High Bear. Most critical correction: actual DE-JP spread +0.25% (not pipeline's 1.52%). JP10Y 2.70% (not 1.47%), DE10Y 2.95% (not 2.99%). BoJ already hiked to 1.00% (not "Hold"). ECB neutral hold 2.00% (not cutting 2.50%). EUR/JPY carry trade has economically collapsed. Three high-conviction factors: carry collapsed to +0.25%, H&S complete (Head 188.012 / Right Shoulder 186.547 / Neckline 181.018), BoJ hawkish + June TANKAN support today. H&S measured target: neckline 181 → 177 (also Fib 1.618 extension -- confluence). Further support: 175.0-175.5. Invalidation: daily close above 186.547. Scenarios: neckline 181 breaks, wave (c) to 177 (55%); sideways 183-186 (25%); NFP bounce 186-187 then continues (15%); recovery above 186.547 (5%). Do not chase short before neckline 181 breaks. For informational purposes only. Not financial advice.

USDJPY - Wave (5) Exhaustion Confirmed as Price Failed to Break 161.94 for an Entire Week, Tokyo CPI Beat Gives the BoJ More Ammunition

USDJPY - Wave (5) Exhaustion Confirmed as Price Failed to Break 161.94 for an Entire Week, Tokyo CPI Beat Gives the BoJ More Ammunition

USDJPY 161.651 | Wave (5) exhaustion confirmed, Tokyo CPI beats | 26 June 2026 Last week: "Wave (5) exhaustion at the intervention ceiling, expect correction to 155-157." One week later: price stood at 161.6, unable to break 161.94 despite DXY at a 13-month high. Exhaustion is no longer speculation. Then Tokyo CPI June released today. Core-core 1.9% y/y, beat 1.8% forecast, up from 1.6%. The BoJ has fresh ammunition to hike again. Yen-supportive. DXY pulled back from 101.5 to 100.6. VIX jumped to 20.20 (+7.1%). Risk-off intensifying, carry-unwind pressure. Pipeline showed wrong numbers. JP10Y: 1.47% (actual 2.600%). US-JP spread: 2.924% (actual 1.790%). BoJ: "Hold" (actual: hiked to 1.00%). D1 structure: wave (5) at the 161.94 ceiling, failed to break after one full week. Correction targets: 158.953 (0.382), 155.244 (0.5), 153.5 (0.618). Extension if breaks 161.94: 164. Invalidation: below 152. Three scenarios: → Correction (a)(b)(c) to 155-157. Probability: 40% → MOF intervention, sharp drop to 155 then 152. Probability: 25% → DXY bounces, breaks 161.94, extension to 164. Probability: 20% The tell: one week at the ceiling, it didn't break. Then the BoJ's data came in hot. Exhaustion confirmed. Conviction: Medium Bear near-term (shifted from Med Bull correction lean). --- Intermarket Edge | Institutional Macro & Intermarket Analysis For informational purposes only. Not financial advice.

USDCAD - CAD Hits a 14-Month Low as Oil Breaks Below $70 and DXY Holds a 13-Month High, a Double Squeeze Drives Wave (3) Toward 1.4447

USDCAD - CAD Hits a 14-Month Low as Oil Breaks Below $70 and DXY Holds a 13-Month High, a Double Squeeze Drives Wave (3) Toward 1.4447

USDCAD 1.4232 | Double squeeze: 13-month DXY high + oil below $70 | 25 June 2026 CAD hits a 14-month low, pressured from both sides simultaneously. USD leg: 13-month high post-hawkish FOMC. CAD leg: oil broke below $70 and the pre-war 71.11 support. When both legs tilt the same way, this is the strongest bullish configuration. BoC Macklem today: not seeing spillovers from higher oil prices into CPI. Implicitly dovish, BoC in no hurry to hike. Canada benchmark yields slipping. CAD at a 14-month low as tech selloff drives safe-haven into USD. AUDUSD at 0.691, broad commodity FX weakness. CAD weakness is not idiosyncratic. D1 structure: wave (3) impulse running. Target 1.4447 then 1.4540. Support 1.4100 then 1.3993. Invalidation: below 1.3476. Three scenarios: → Wave (3) continues to 1.4447 then 1.4540. Probability: 45% → Sub-wave 4 correction to 1.40 then resumes. Probability: 25% → Oil bounces + dovish Fed, drops to 1.39. Probability: 15% The tell: both legs tilting simultaneously. DXY strongest in 13 months, CAD weakest in 14. Not a coincidence. A double squeeze. Conviction: High Bull (upgraded from Med-High). --- Intermarket Edge | Institutional Macro & Intermarket Analysis For informational purposes only. Not financial advice.

InterMarketEdge

© 2026 InterMarketEdge. Financial intelligence for inter-market traders.