Tag: OIL — InterMarketEdge

Tag: OIL

USOIL - Last Week's Bearish Thesis Invalidated as Price Clears 73.35, Iran War Escalation Reverses the Entire Oil-Glut Narrative

USOIL - Last Week's Bearish Thesis Invalidated as Price Clears 73.35, Iran War Escalation Reverses the Entire Oil-Glut Narrative

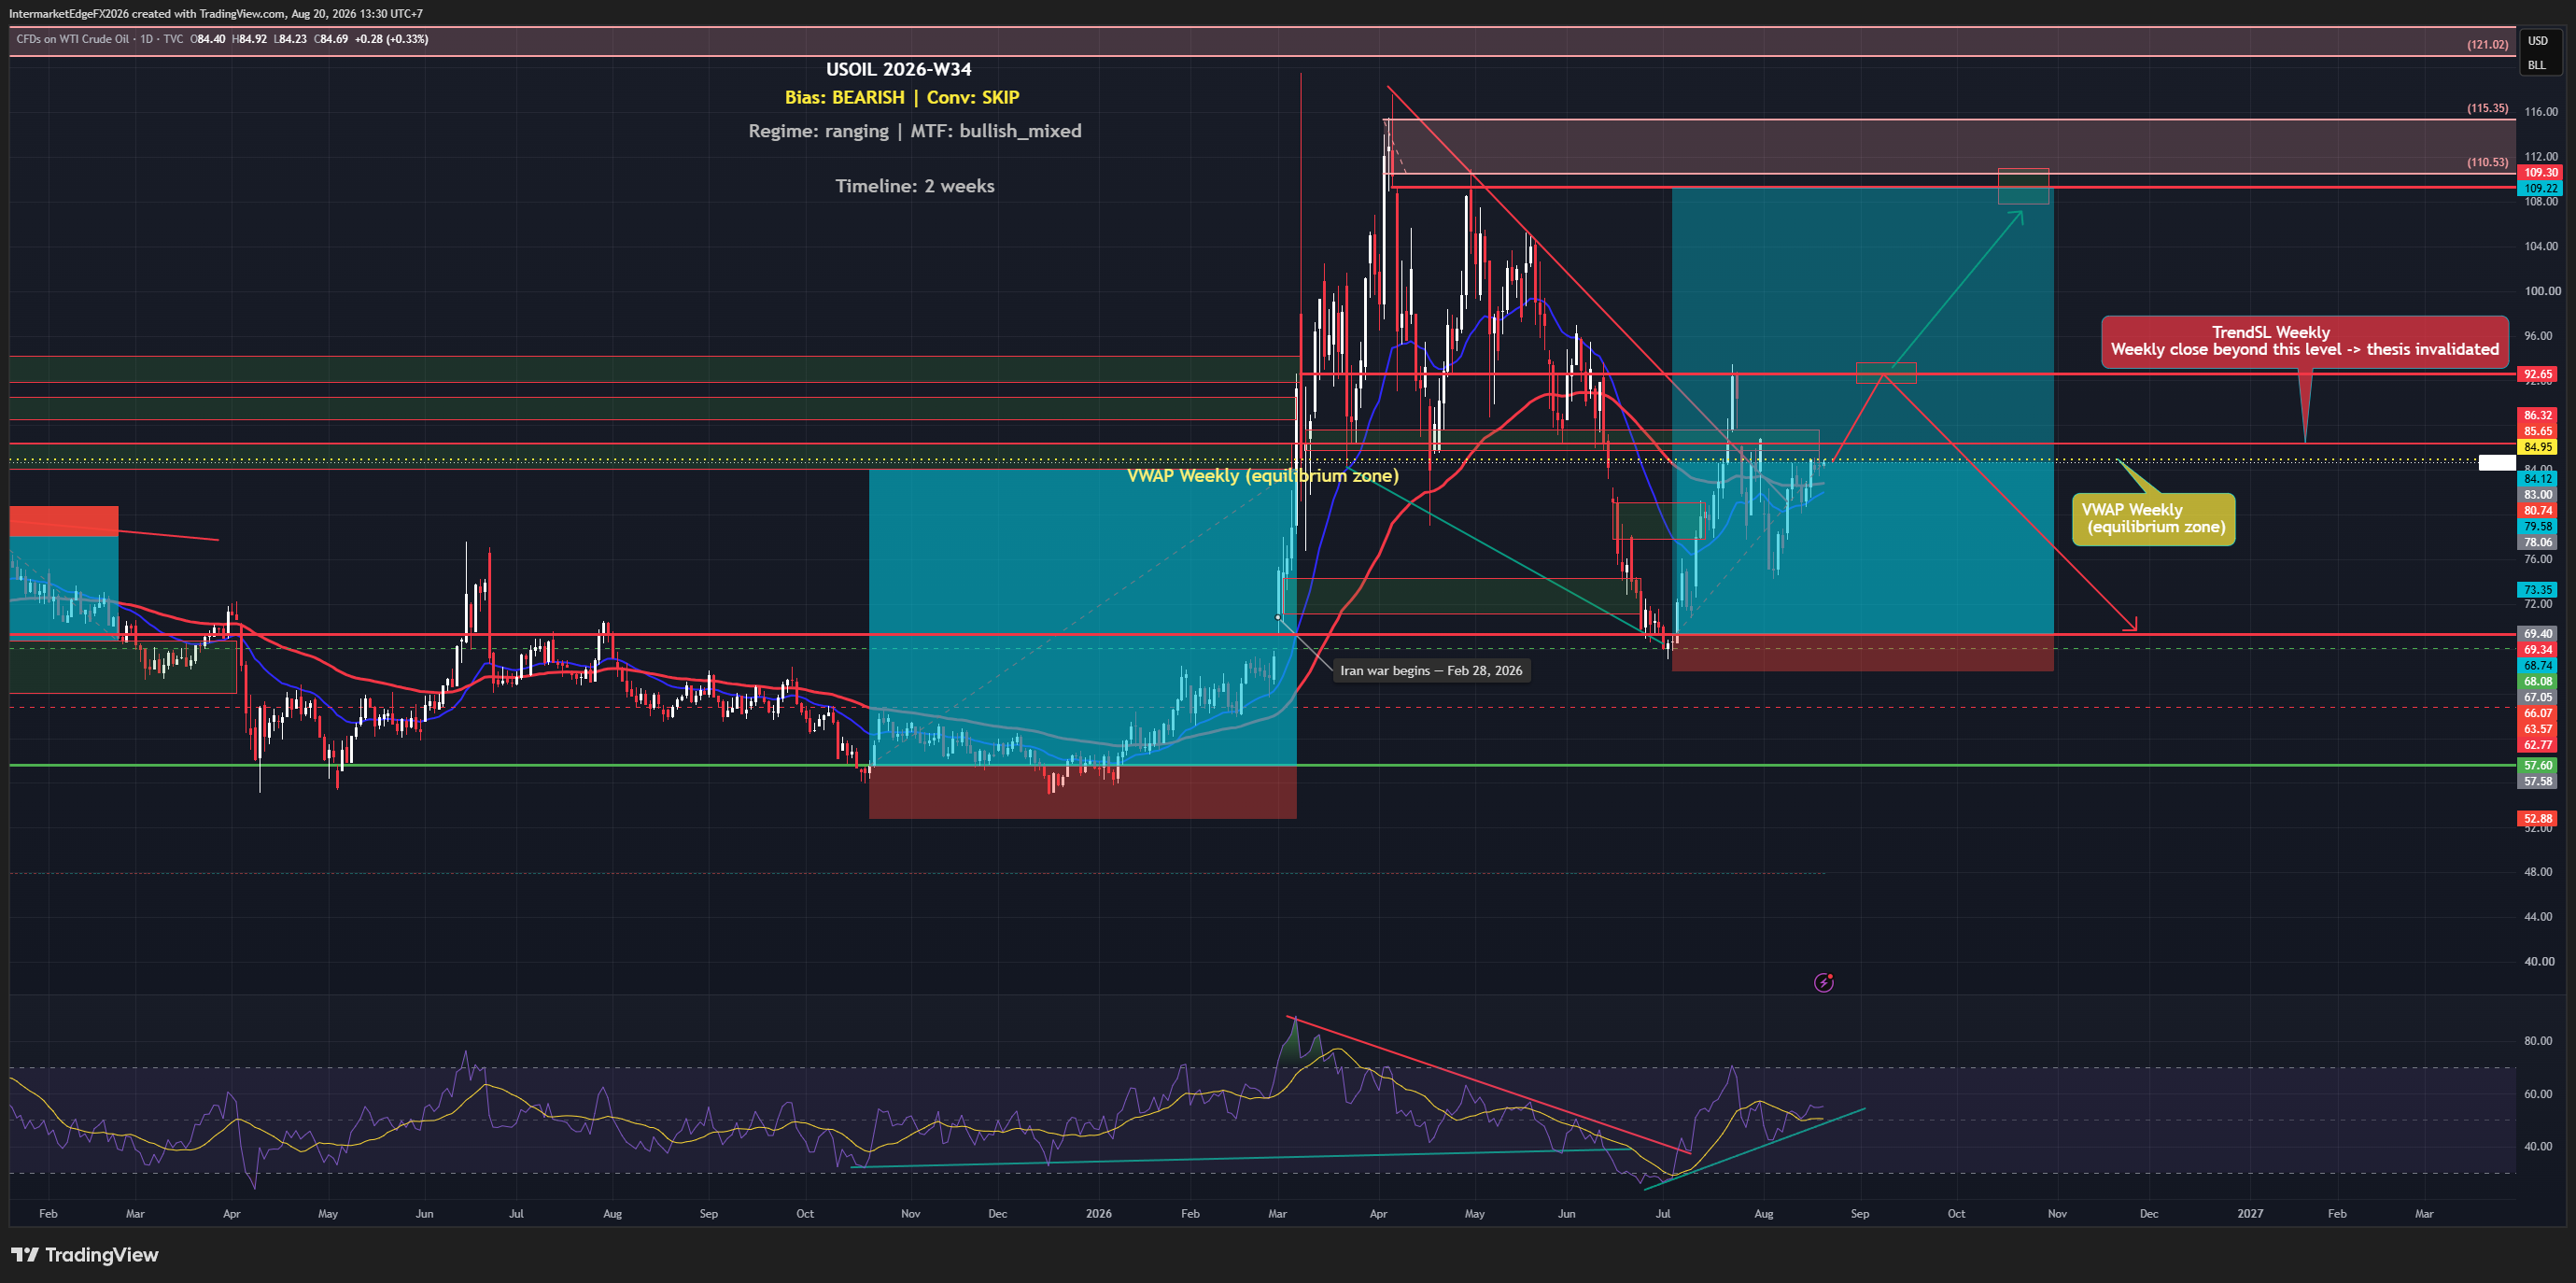
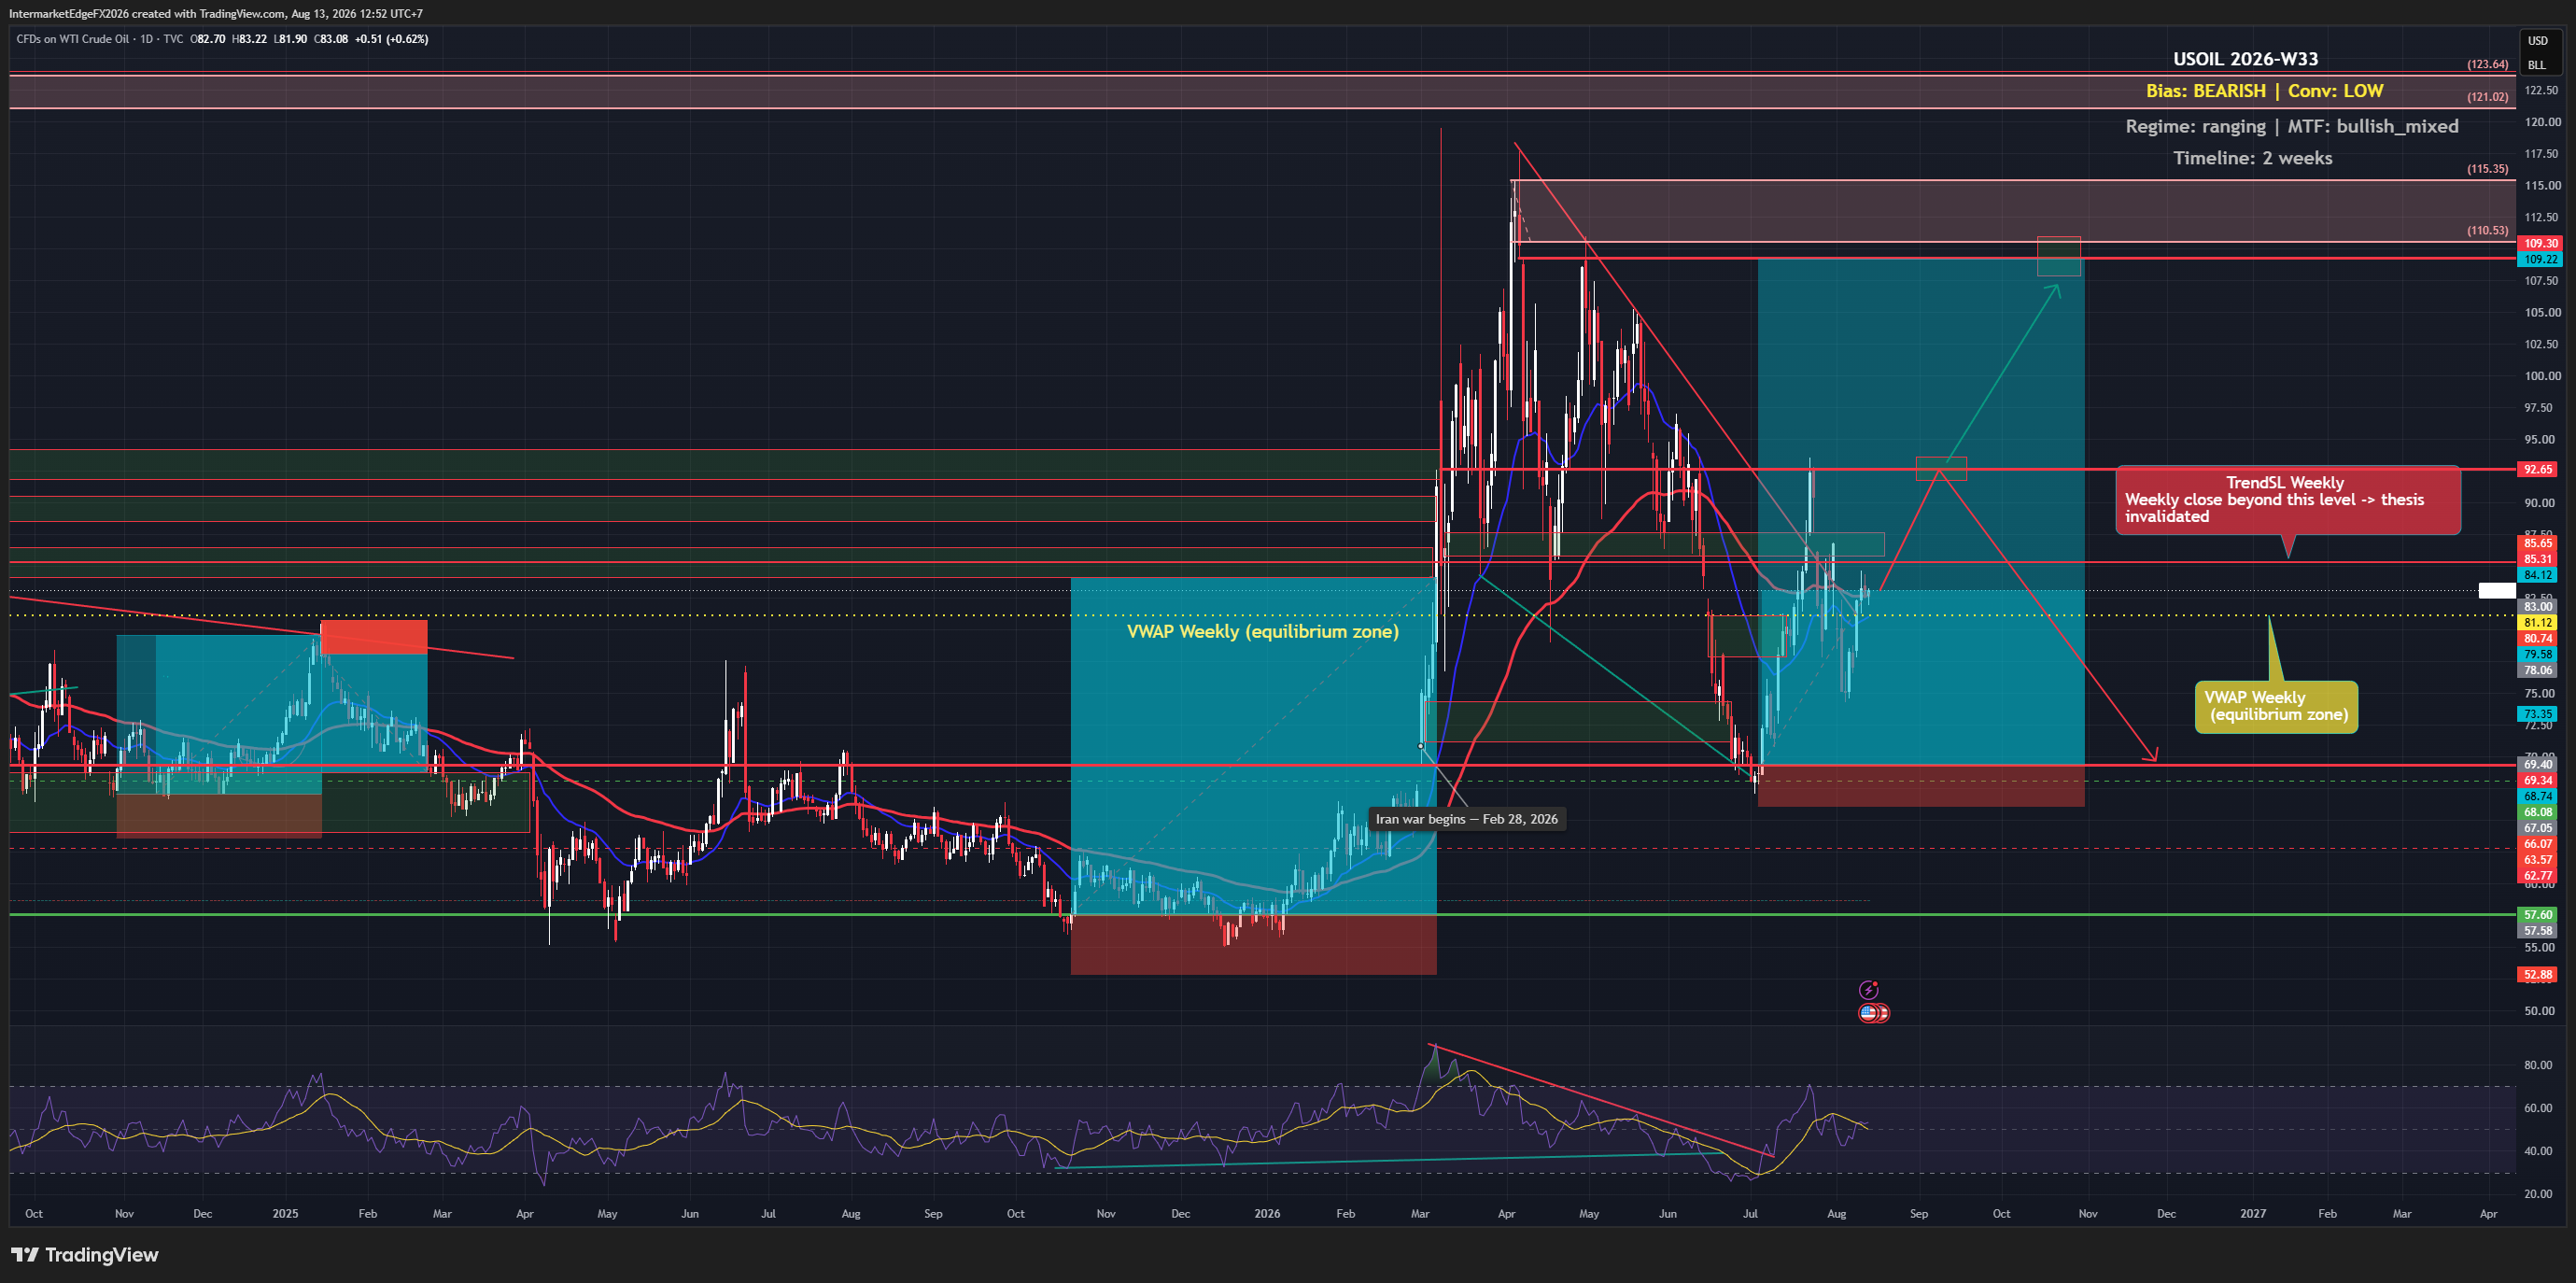
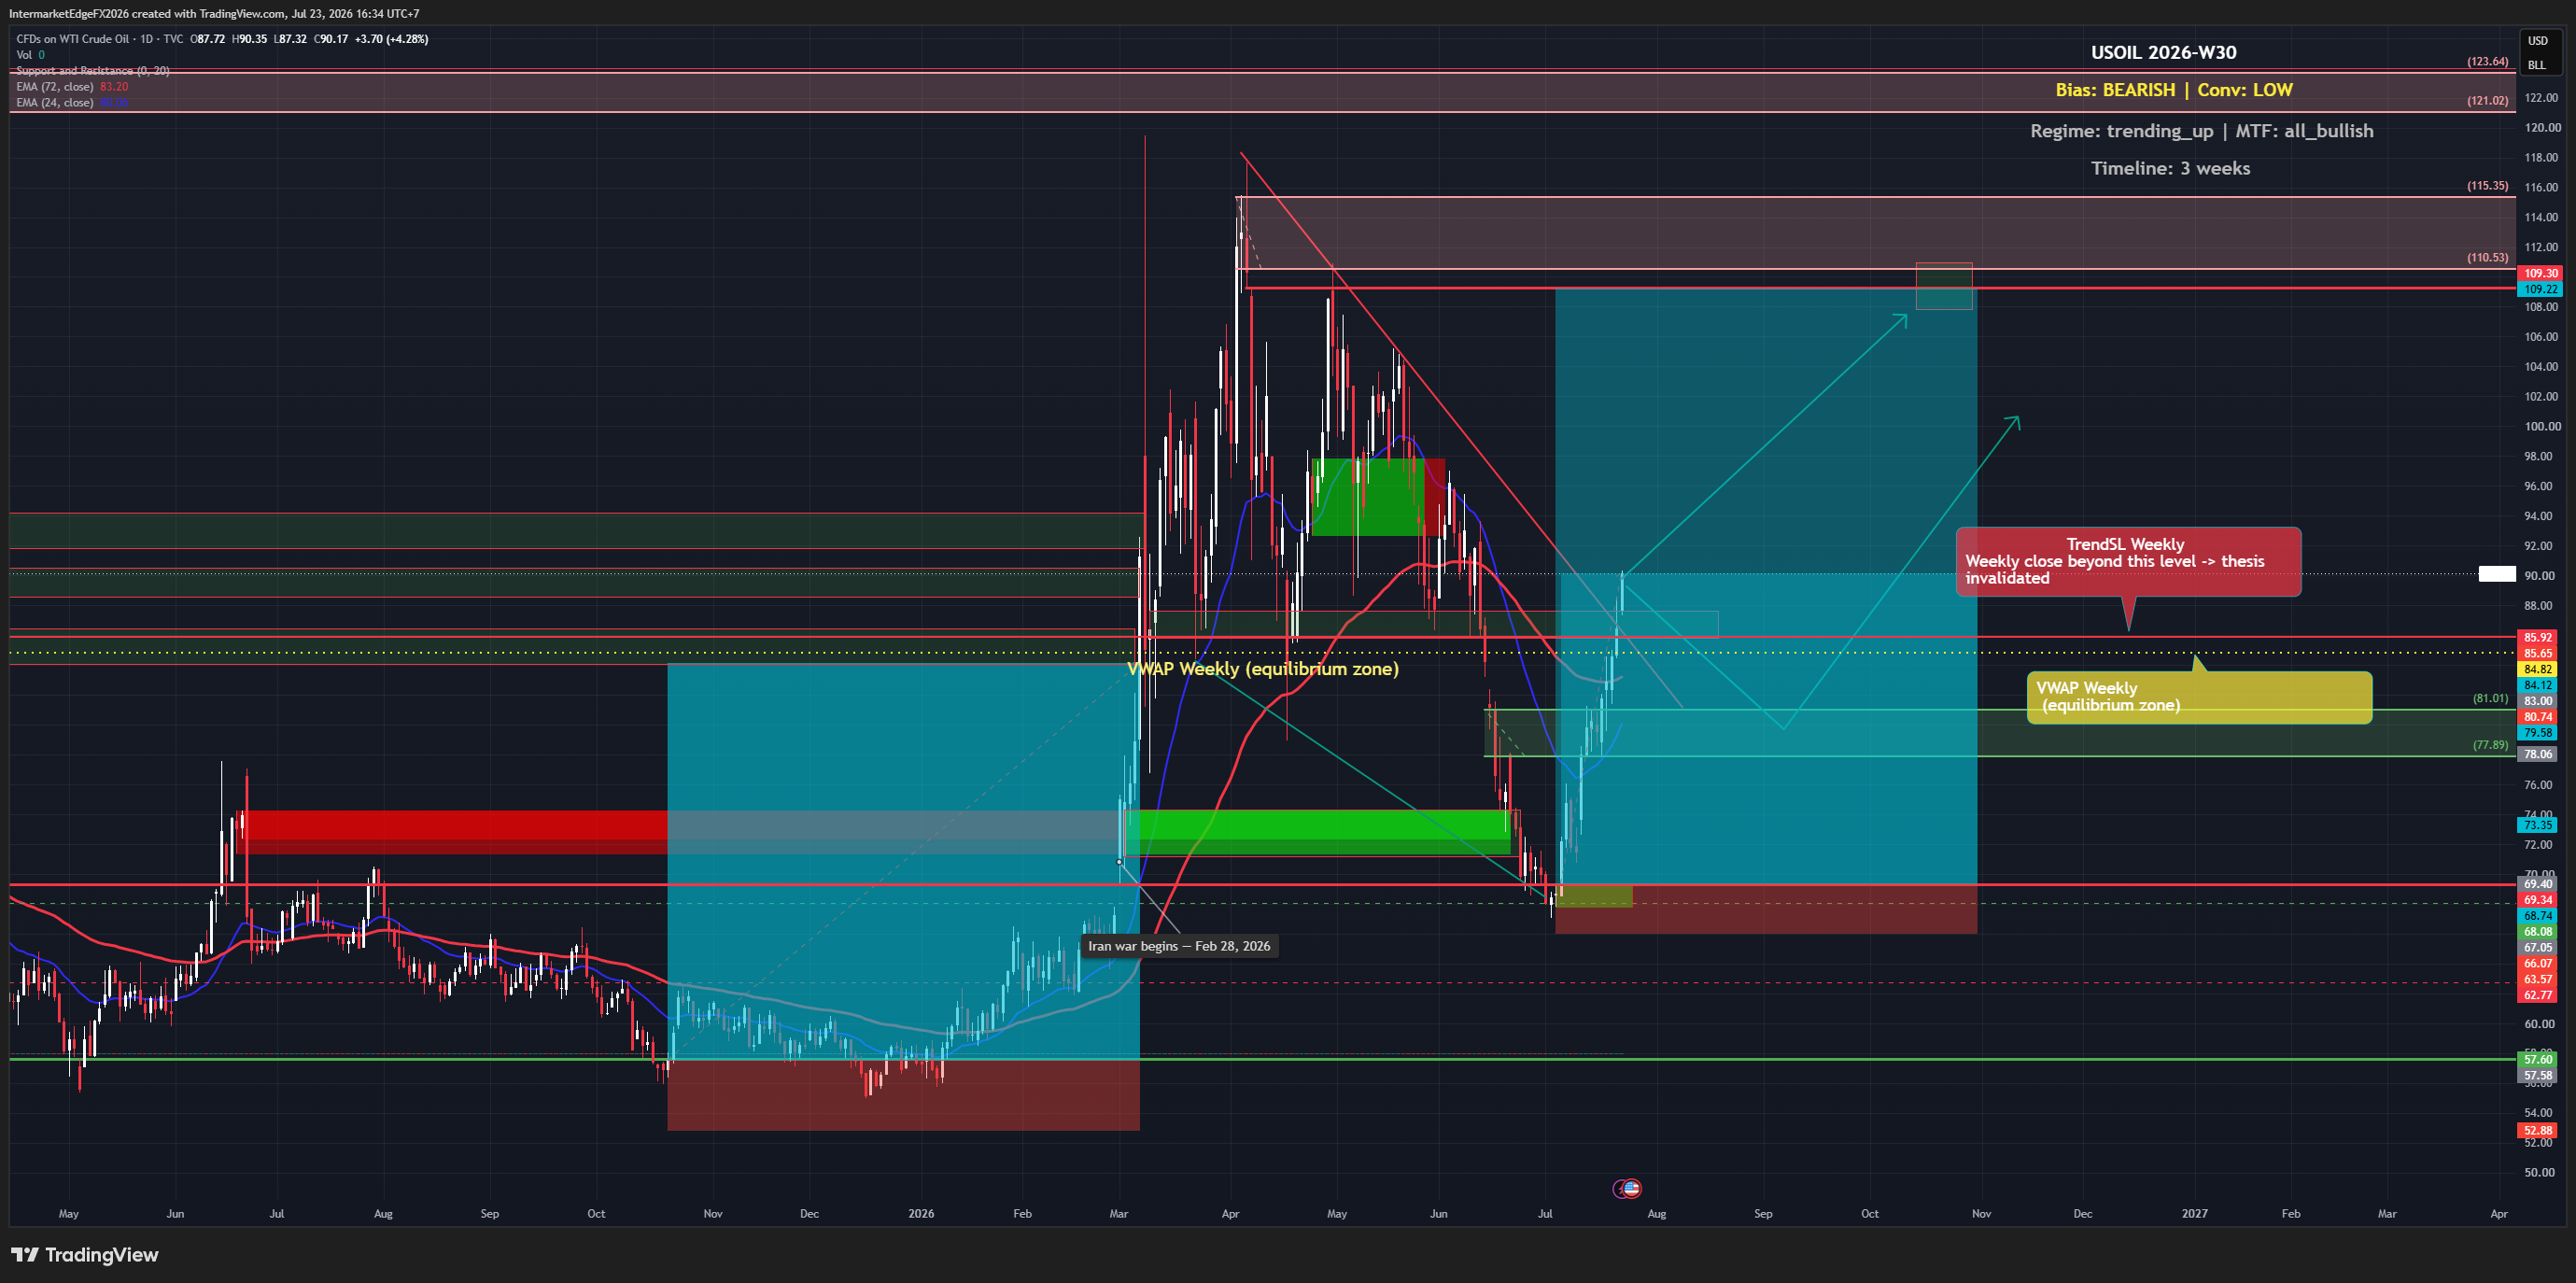
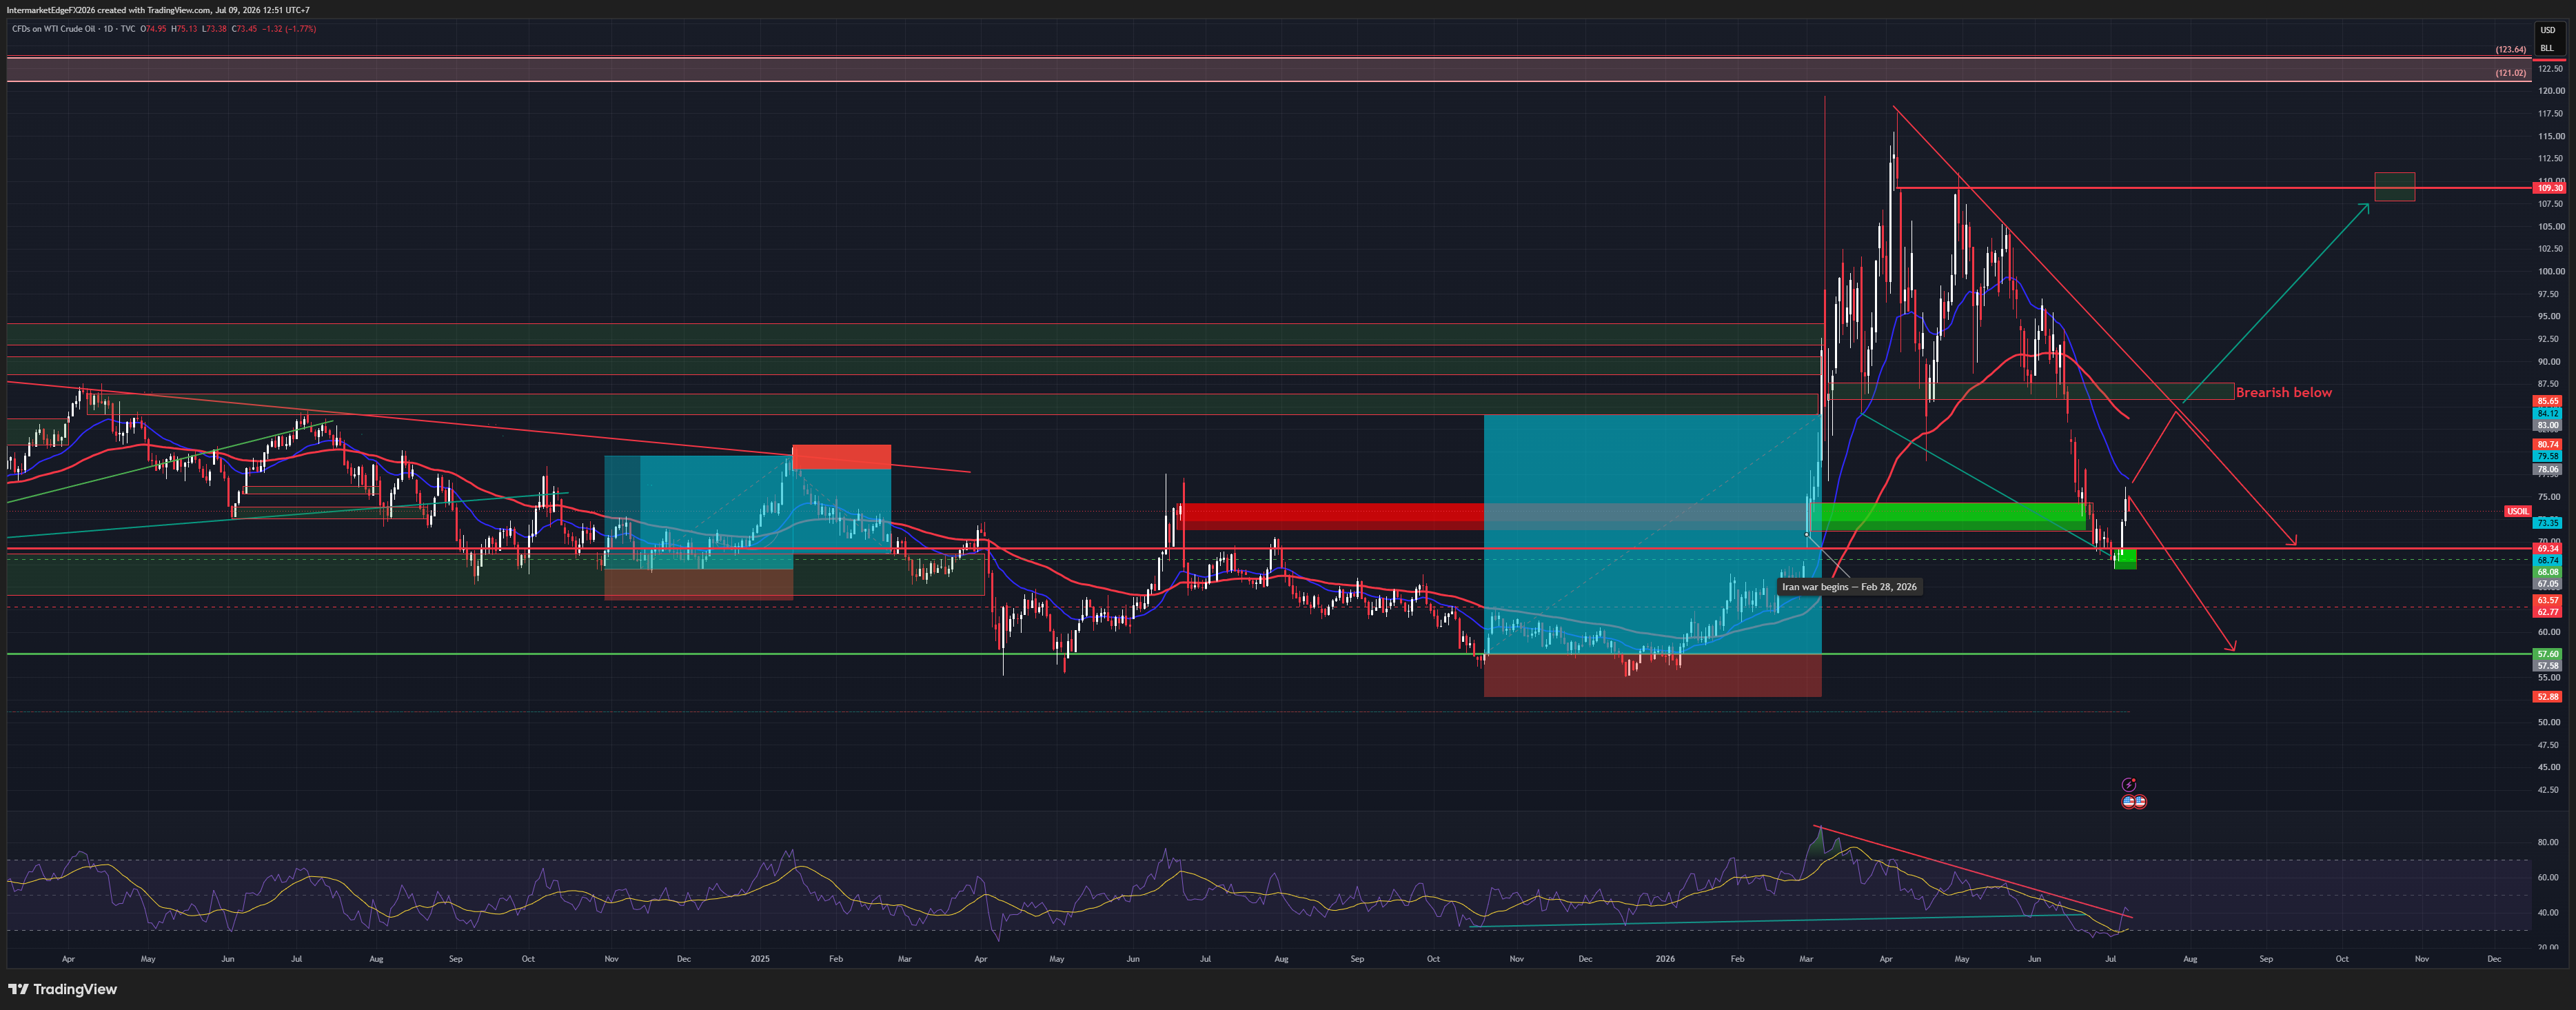
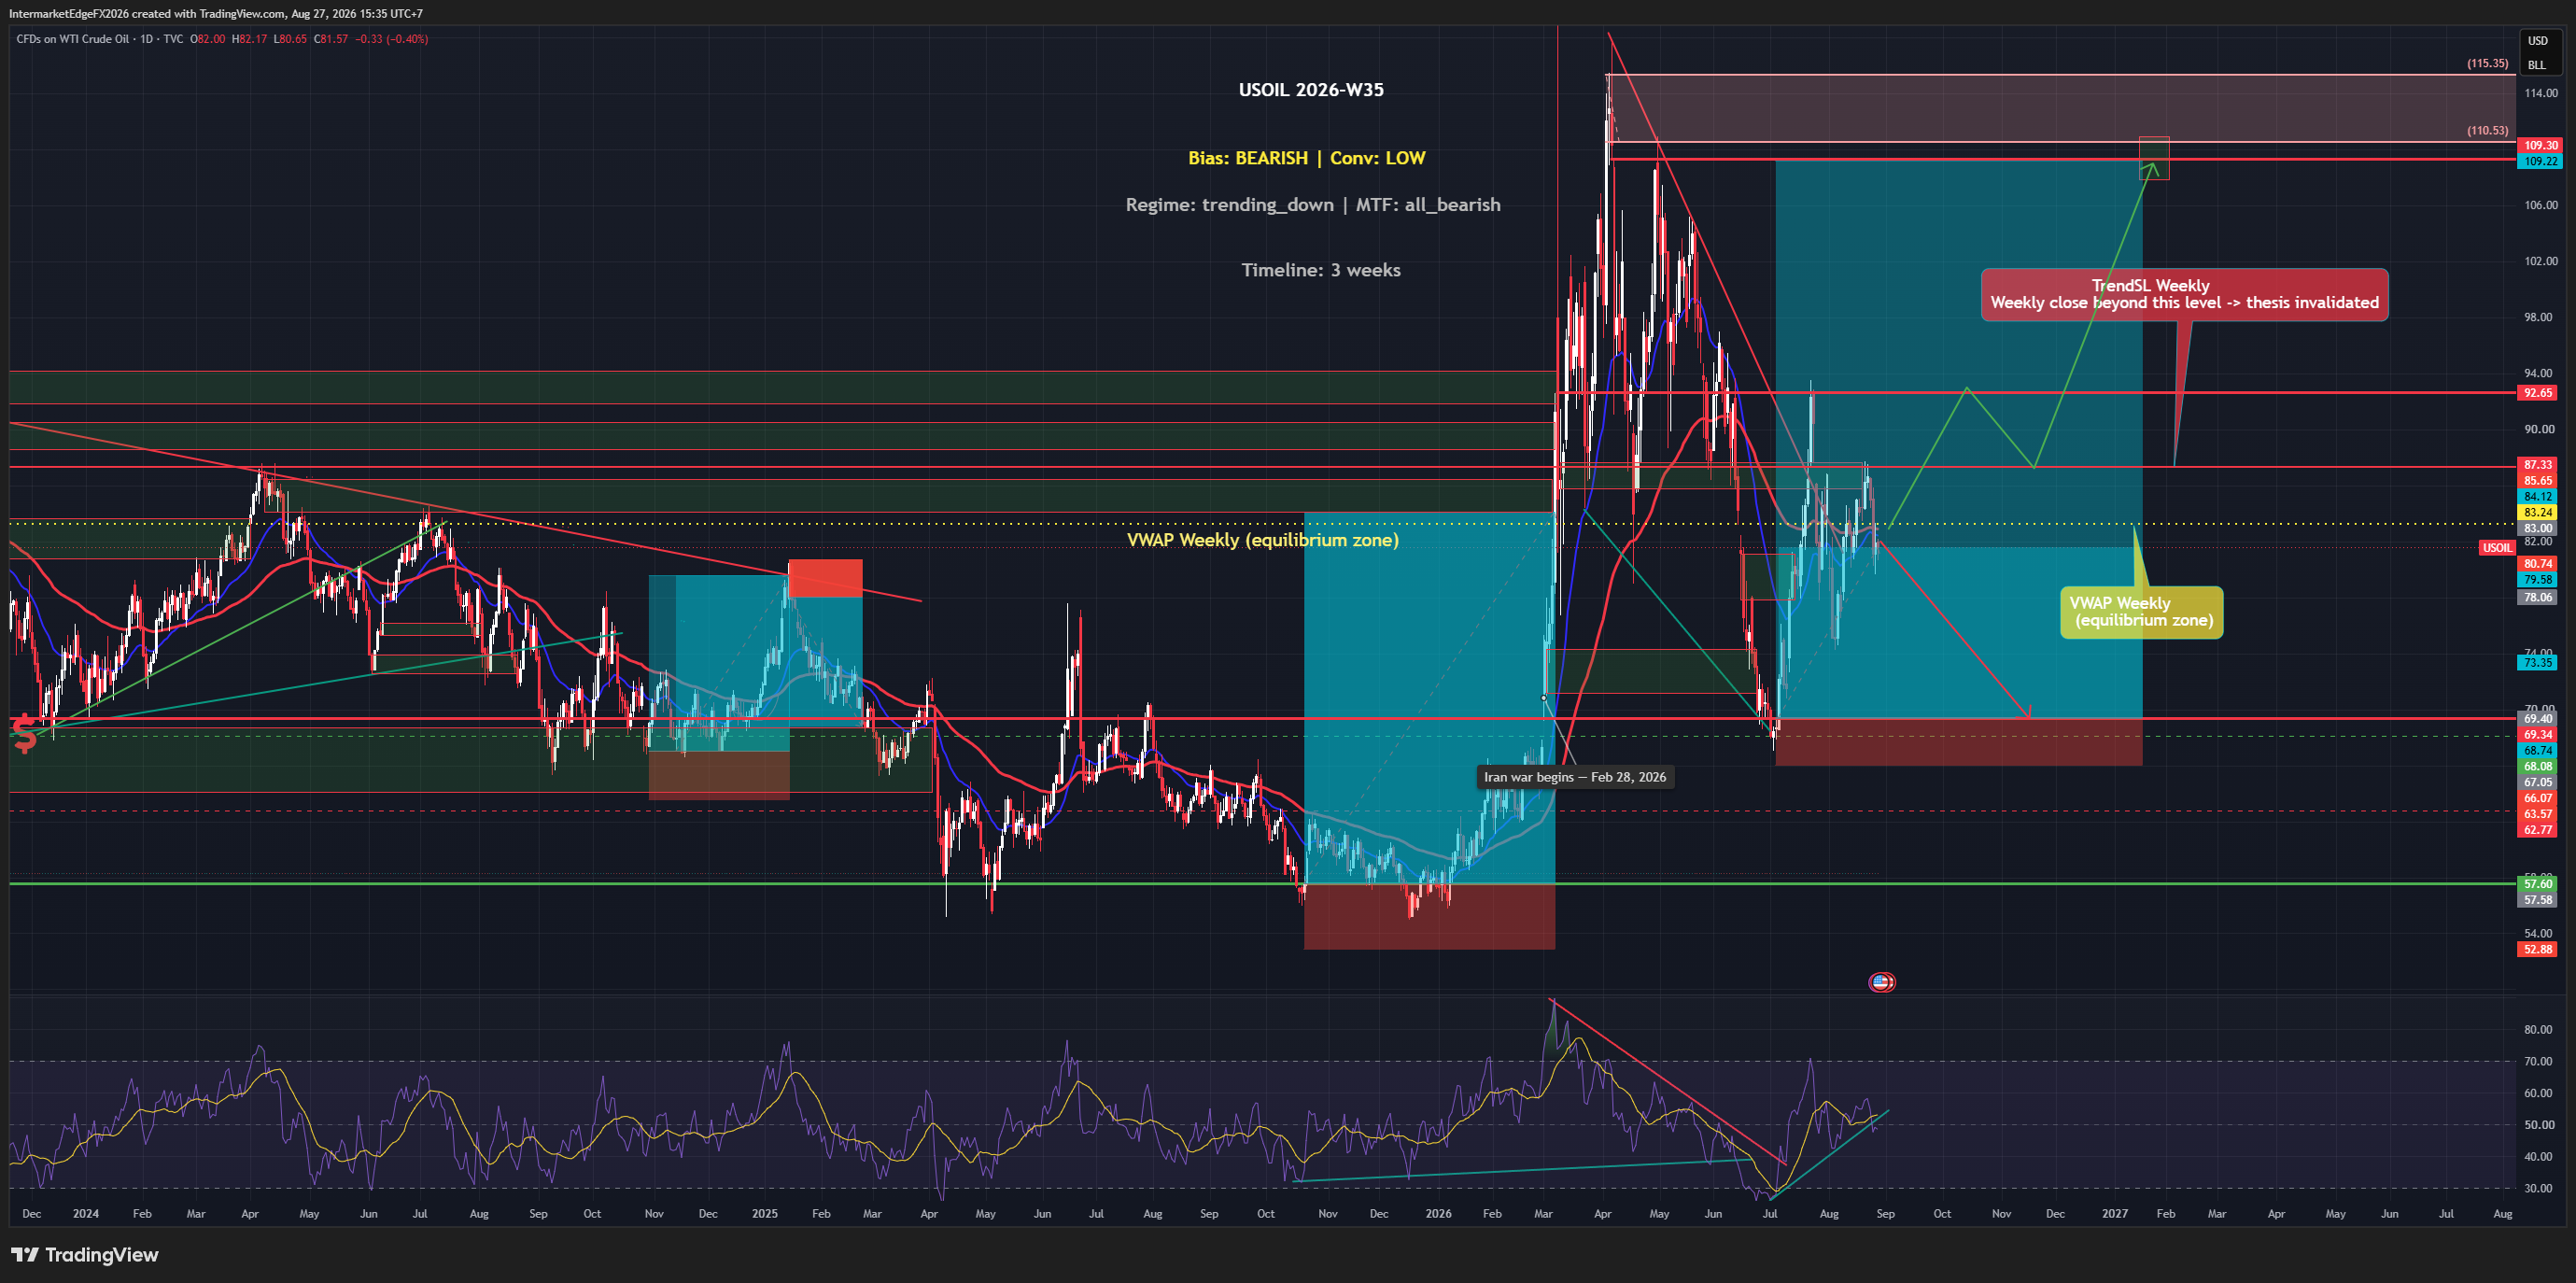
USOIL - SUMMARY 09/07/2026 Regime: Last week's High Bear thesis invalidated as price cleared the 73.35 invalidation level, due to Iran war escalation rather than analytical error. Shifted to Medium Bull (risk premium), moderate conviction. Bias: Medium Bull (risk premium), shifted from High Bear last week. New factors: US revoked Iran's oil sale authorization, struck 80+ targets, Iran retaliated against Bahrain and Kuwait, price surged as much as 7% in a session. Simultaneously, EIA reported a surprise inventory build of 2.998M, breaking an 8-week streak of draws -- a bearish fundamental signal being overwhelmed by risk premium. Key precedent: the Iran war's outbreak in February pushed Brent up 65% before fully reversing over 4 months. Caution warranted given this precedent could repeat. D1 structure: support 69-70, medium-term resistance 87.5-92.5. Upside target: 108-112. Downside target: 63.57-57.60. Scenarios: continued escalation toward 87.5-112 (35%); range 70-85 pending developments (40%); cooling as in the precedent, resuming the downtrend (25%). This is the hardest-to-forecast variable in the current 9-instrument basket; continuous monitoring of geopolitical developments is required. For informational purposes only, not investment advice.

USOIL - Five Consecutive Weekly Draws and Price Keeps Falling: When the Market Ignores Inventory, the Supply Narrative Is Winning Absolutely

USOIL - Five Consecutive Weekly Draws and Price Keeps Falling: When the Market Ignores Inventory, the Supply Narrative Is Winning Absolutely

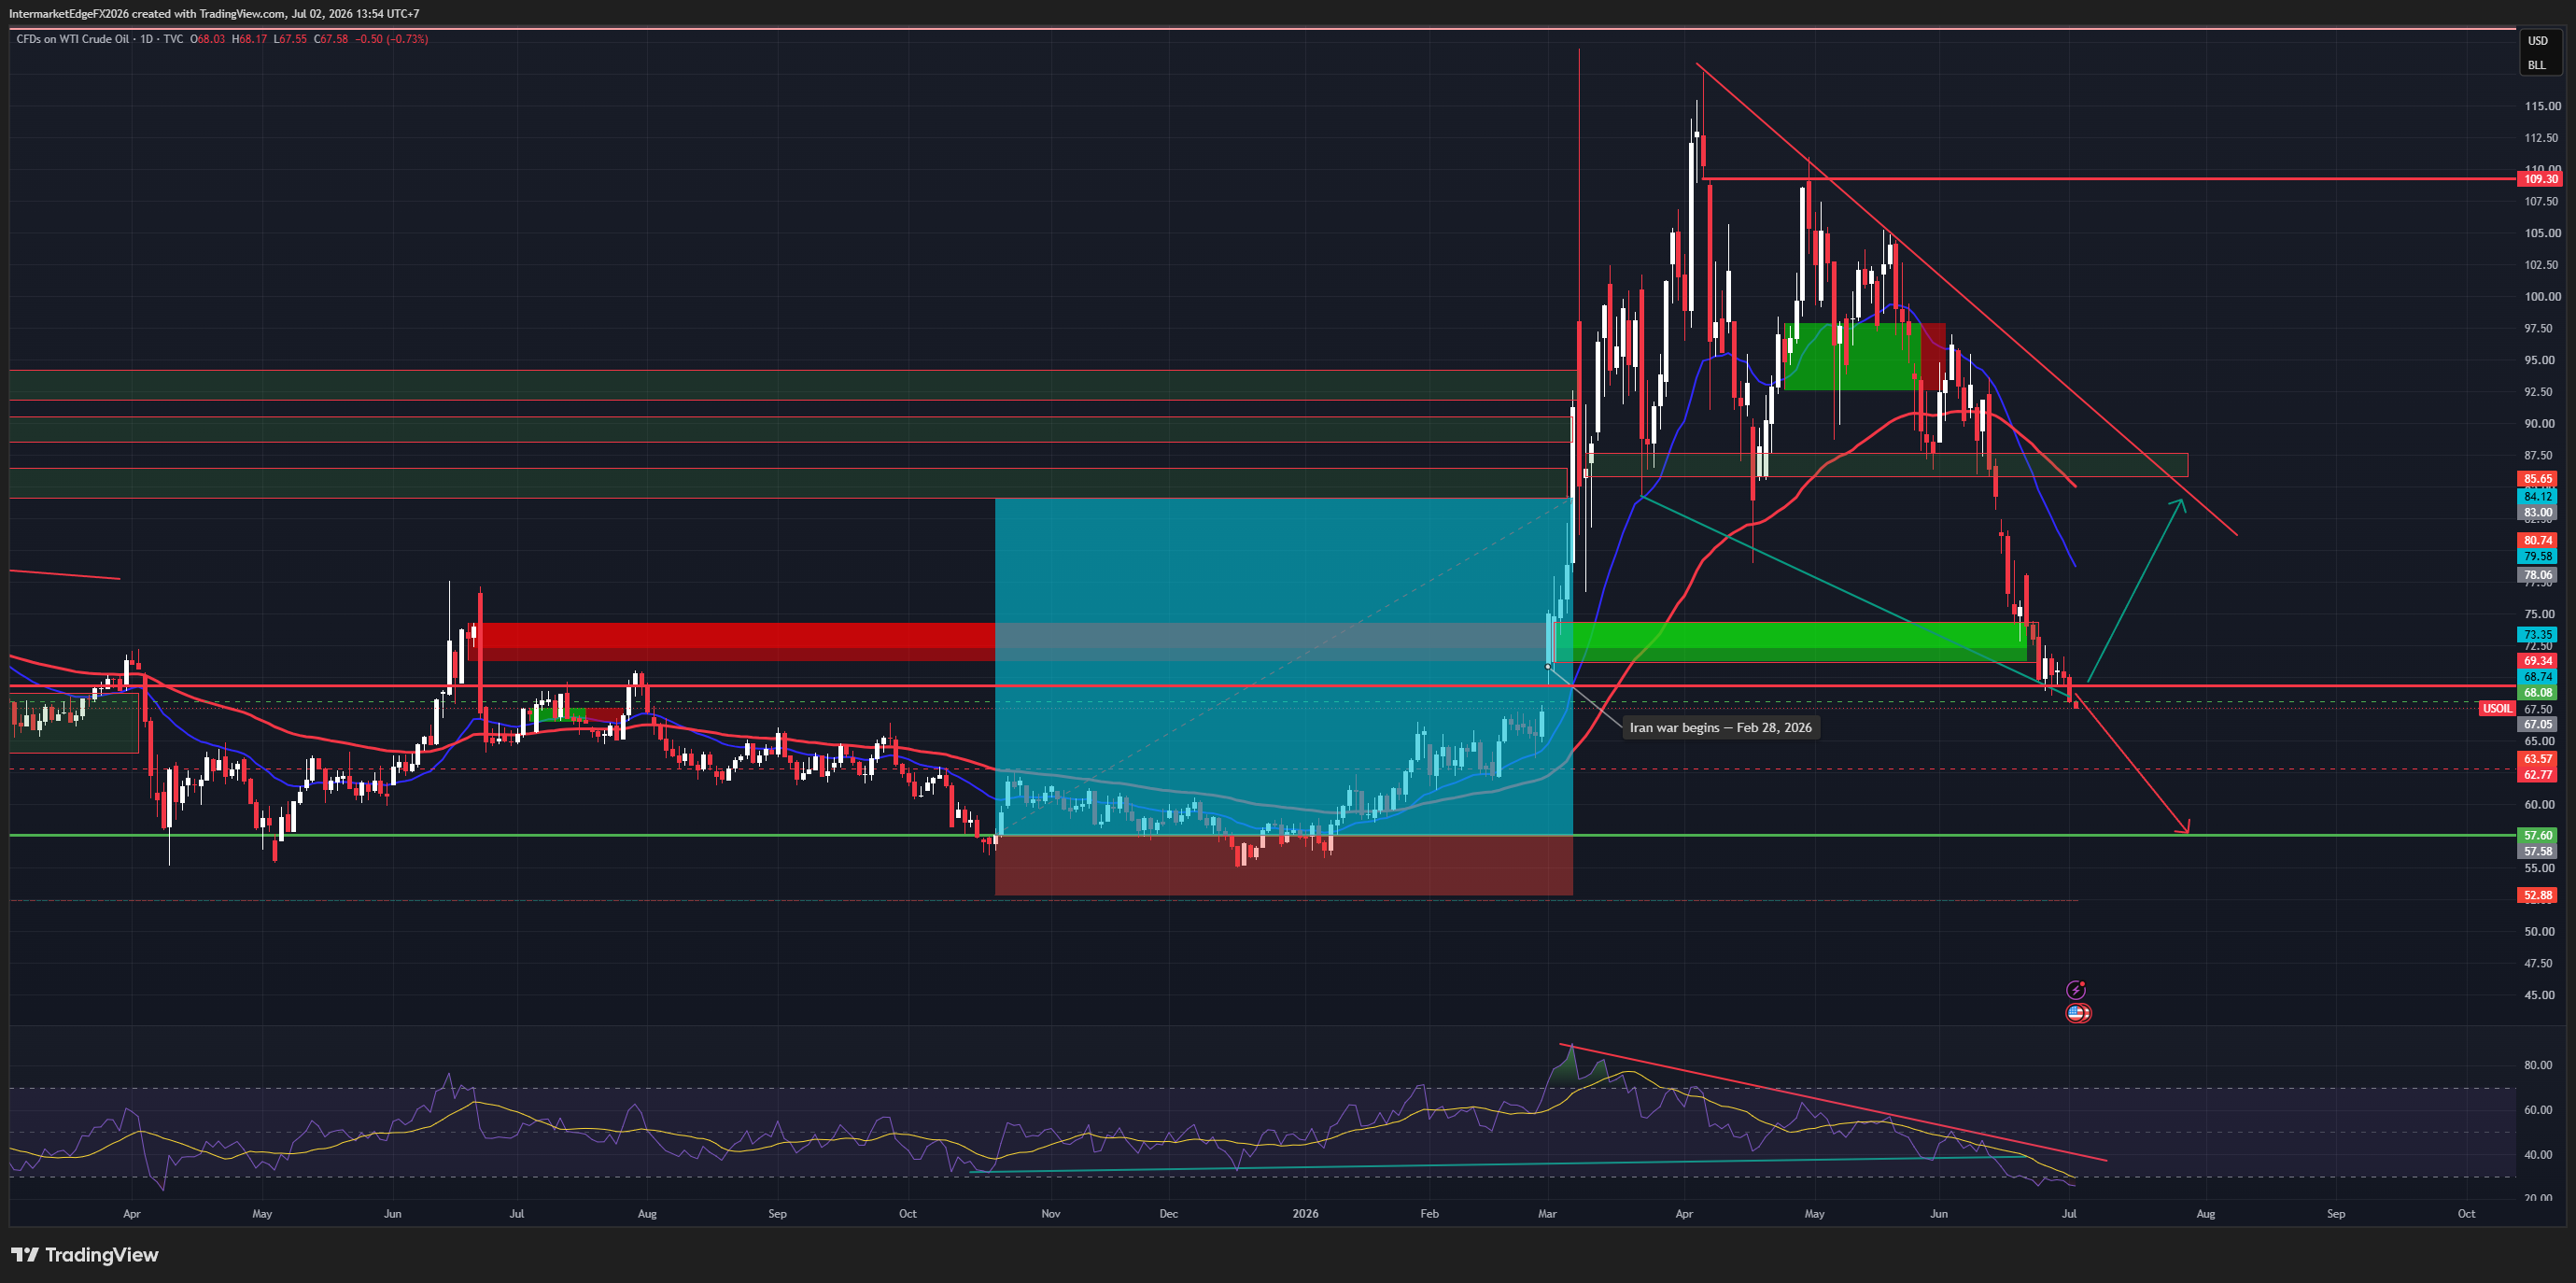
USOIL - SUMMARY 02/07/2026 Regime: High Bear Continues, Supply Narrative in Total Control. USOIL 67.85 (-0.34%), the 67 target from last week's analysis has been hit. Falling channel from the 117.50 war peak remains intact. Bias: High Bear. Core story: 5 consecutive weekly EIA draws totalling -33.3M barrels (1 July: -3.775M vs forecast -2.900M) -- the strongest destocking sequence this year -- and price still fell from 75 to 67.85. When a market ignores the most bullish data available, bulls have lost control. The strongest behavioural bearish signal that exists. Supply narrative: OPEC+ +411kbpd from June, Hormuz flows recovered (OCBC + UBS both cut forecasts), Iran-US talks progressing -- each round another leg lower. Data corrections: EIA -3.775M released (pipeline "awaiting" stale); CPI 4.2% (not 2.4%); real yield +0.28%. D1 structure: 69.34-73.35 support broken. Resistance: 69.34 / 73.35 (channel invalidation). Targets: 63.57 → 62.77 → 57.60 (major support Q4 2025 base -- where OPEC+ fiscal pressure peaks, production-cut intervention likely). Extension: 52.88. Scenarios: downtrend continues to 63.57 (50%); extends to 57.60 (25%); oversold bounce 69-73 then resumes (15%); Iran talks collapse, breakout 73-85 (10%). Event risk: NFP 3 July, EIA 8 July (sixth draw?), OPEC+ communique, Iran talks wildcard. Stops for shorts: above 69.34. For informational purposes only. Not financial advice.

USOIL - Below $71 Confirms the War Premium Fully Erased, Persian Gulf Flows Accelerate as the Market Shrugs Off a -6M Draw

USOIL - Below $71 Confirms the War Premium Fully Erased, Persian Gulf Flows Accelerate as the Market Shrugs Off a -6M Draw

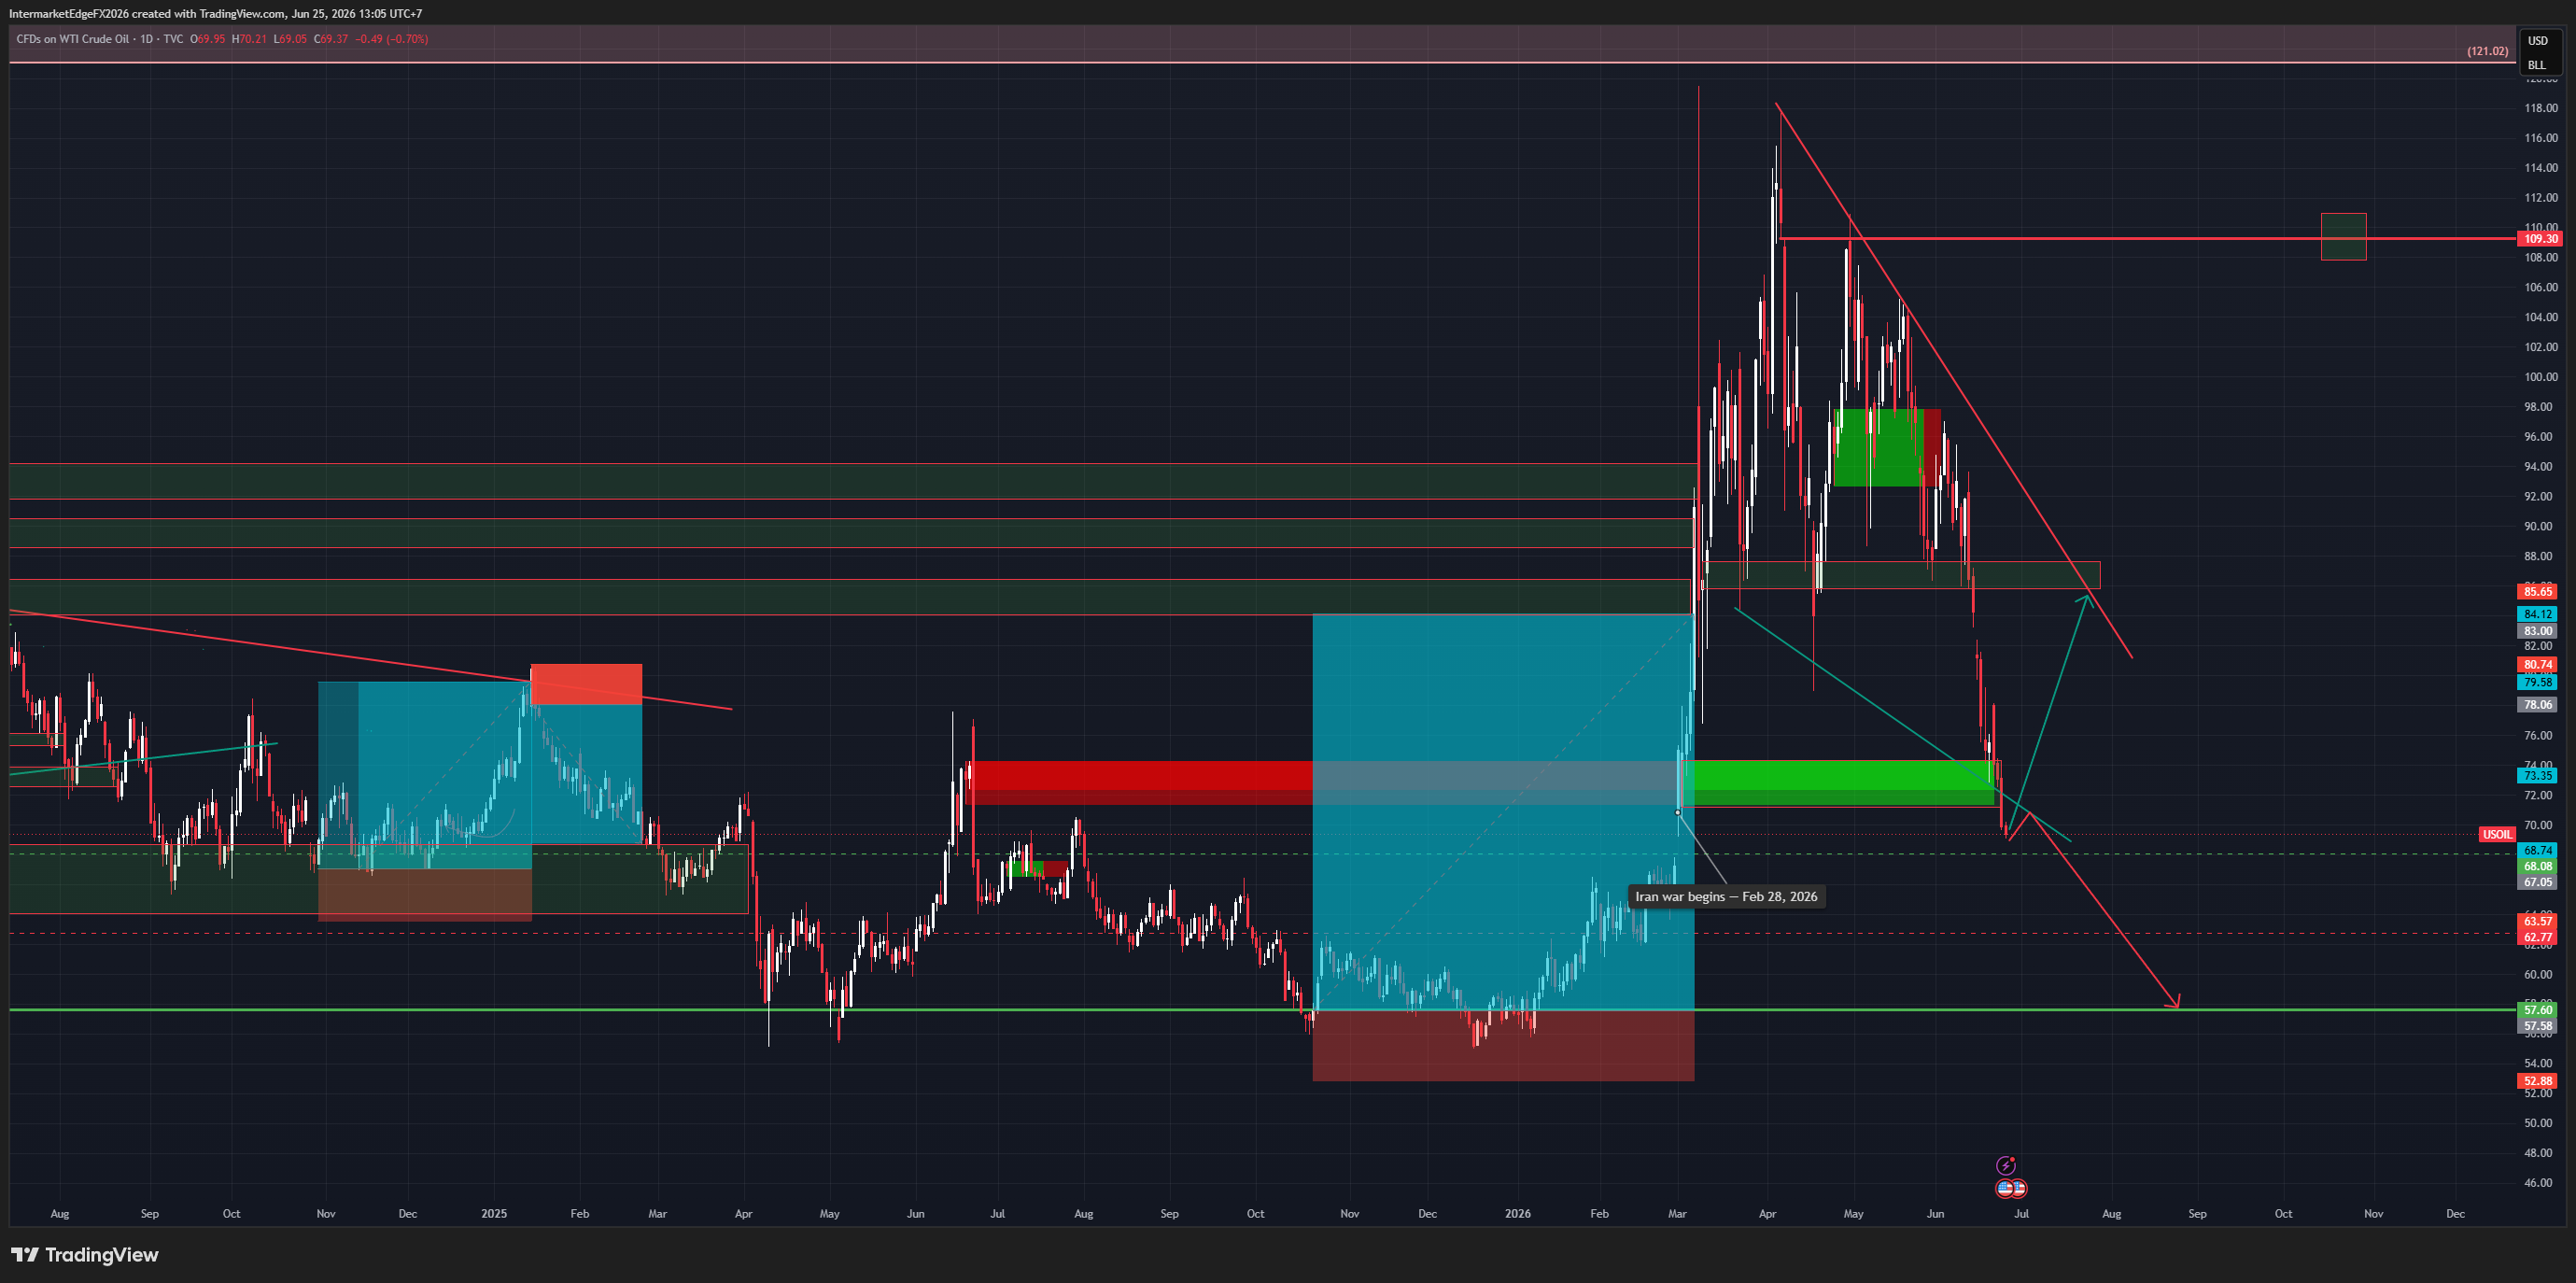
USOIL $69.36 | Below $71, war premium fully erased | 25 June 2026 Last week: "Do not chase shorts into 71.11. A break confirms a further leg, target 67 then 63." It broke. Oil now $69.36, below the pre-war starting point. The most notable signal: the EIA drew 6.088M (forecast just 3.9M), the second consecutive larger-than-expected draw. The market shrugged it off entirely. Oil kept falling. When good news is ignored, the selling force dominates. Three forces: Persian Gulf flows accelerating as Hormuz reopens; global supply recovering + OPEC+ +411kbpd; DXY 101 at a 13-month high. Leading headlines: "Oil Sinks Toward Pre-War Levels", "Crude Oil Falls Below $70", "Oil Market Shrugs Off Large Crude Stock Draw." D1 structure: 71.11 broken (now resistance). Nearby support 67.05 then 63.57 then 62.77. Deep: 57.60 (pre-war bottom). Invalidation: daily close above 74.49. Three scenarios: → Continued decline to 67.05 then 63.57. Probability: 45% → Hormuz fully reopens, accelerates to 57.60. Probability: 25% → Technical bounce to test 71.11 (broken support), resumes lower. Probability: 20% The tell: two consecutive bullish draws, price still falls. The market has answered. Conviction: High Bear (upgraded from Medium Bear). --- Intermarket Edge | Institutional Macro & Intermarket Analysis For informational purposes only. Not financial advice.

USOIL - The War Premium Fully Unwound to Pre-War Support, a Post-FOMC Bearish Tide Meets a Bullish -8.263M Draw

USOIL - The War Premium Fully Unwound to Pre-War Support, a Post-FOMC Bearish Tide Meets a Bullish -8.263M Draw

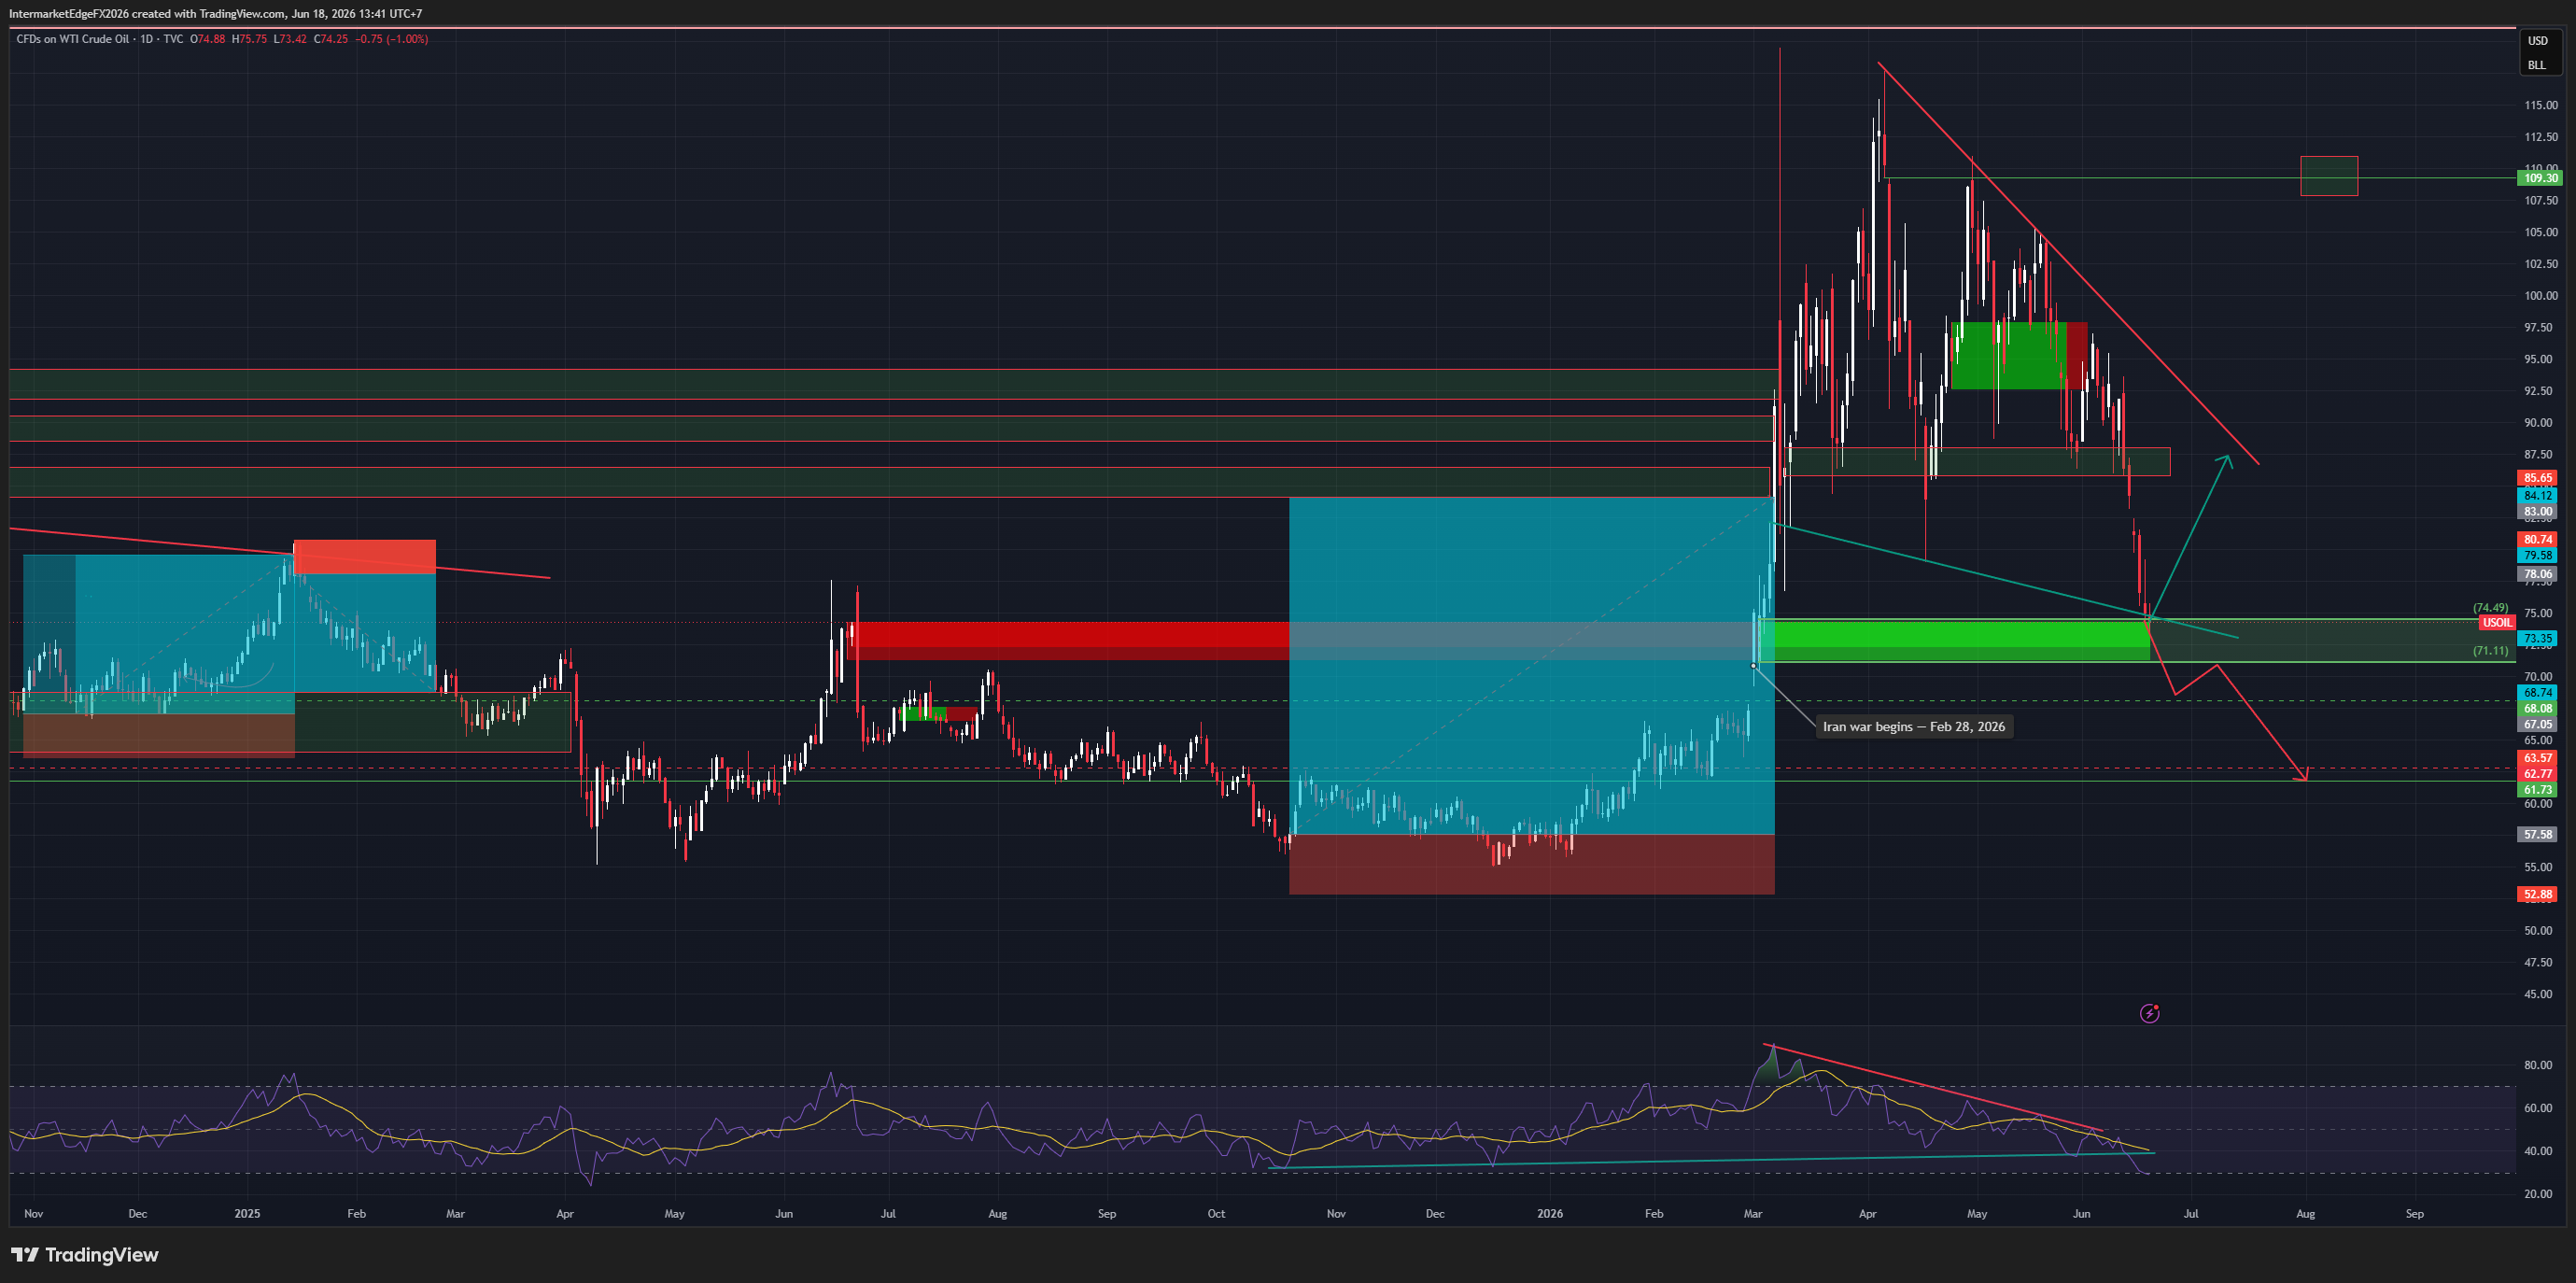
USOIL $73.58 | War premium fully unwound to pre-war support | 18 June 2026 Oil has handed back nearly the entire Iran-war rally and returned to where it started. Here, a bearish tide meets a bullish draw. The Iran war broke out Feb 28, lifting oil from ~57-70 to a 120 peak (April). The peace deal and the prospect of a Hormuz reopening have drained the haven premium steadily. Now 73.58, back in the pre-war zone. Last night's hawkish FOMC lifted DXY to ~100, VIX to 18.43, equities lower. A strong dollar plus demand risk is another bearish layer for oil. Add OPEC+ raising +411kbpd. But against the tide: the EIA draw was -8.263M (forecast just -3.6M, prior -7.227M). US supply is tightening -- a real support. The newsfeed agrees: "Tightness in US Crude Supplies Supports Prices." The pipeline showed you the wrong field. Pipeline EIA: "awaiting release." Actual: -8.263M. DXY now ~100 (jumped post-FOMC). D1 structure: key support 74.49-71.11 (pre-war zone). Resistance 78.06 → 80.74. A break of 71.11 opens 67-68 → 63.57. Three scenarios: → Hold 71.11 + inventory tightness: technical bounce toward 78-80. Probability: 35% → Break 71.11 (Hormuz fully reopens + OPEC + strong dollar): toward 67 then 63. Probability: 35% → Standoff, bearish macro vs bullish draw: 71-78. Probability: 30% Invalidation: daily close above 80.74. The tell: the 71.11 support against the inventory draws. A break with Hormuz fully reopening sends oil to 67; a hold on tightness bounces it to 78. Do not chase shorts into 71.11. Conviction: Medium Bear at support, two-sided. Intermarket Edge | Institutional Macro & Intermarket Analysis For informational purposes only. Not financial advice.

USDCAD — Canadian Dollar at Eight-Week Low, BoC Holds June 10, Oil Slides, and USMCA Risk Keeps the Loonie Trapped

USDCAD — Canadian Dollar at Eight-Week Low, BoC Holds June 10, Oil Slides, and USMCA Risk Keeps the Loonie Trapped

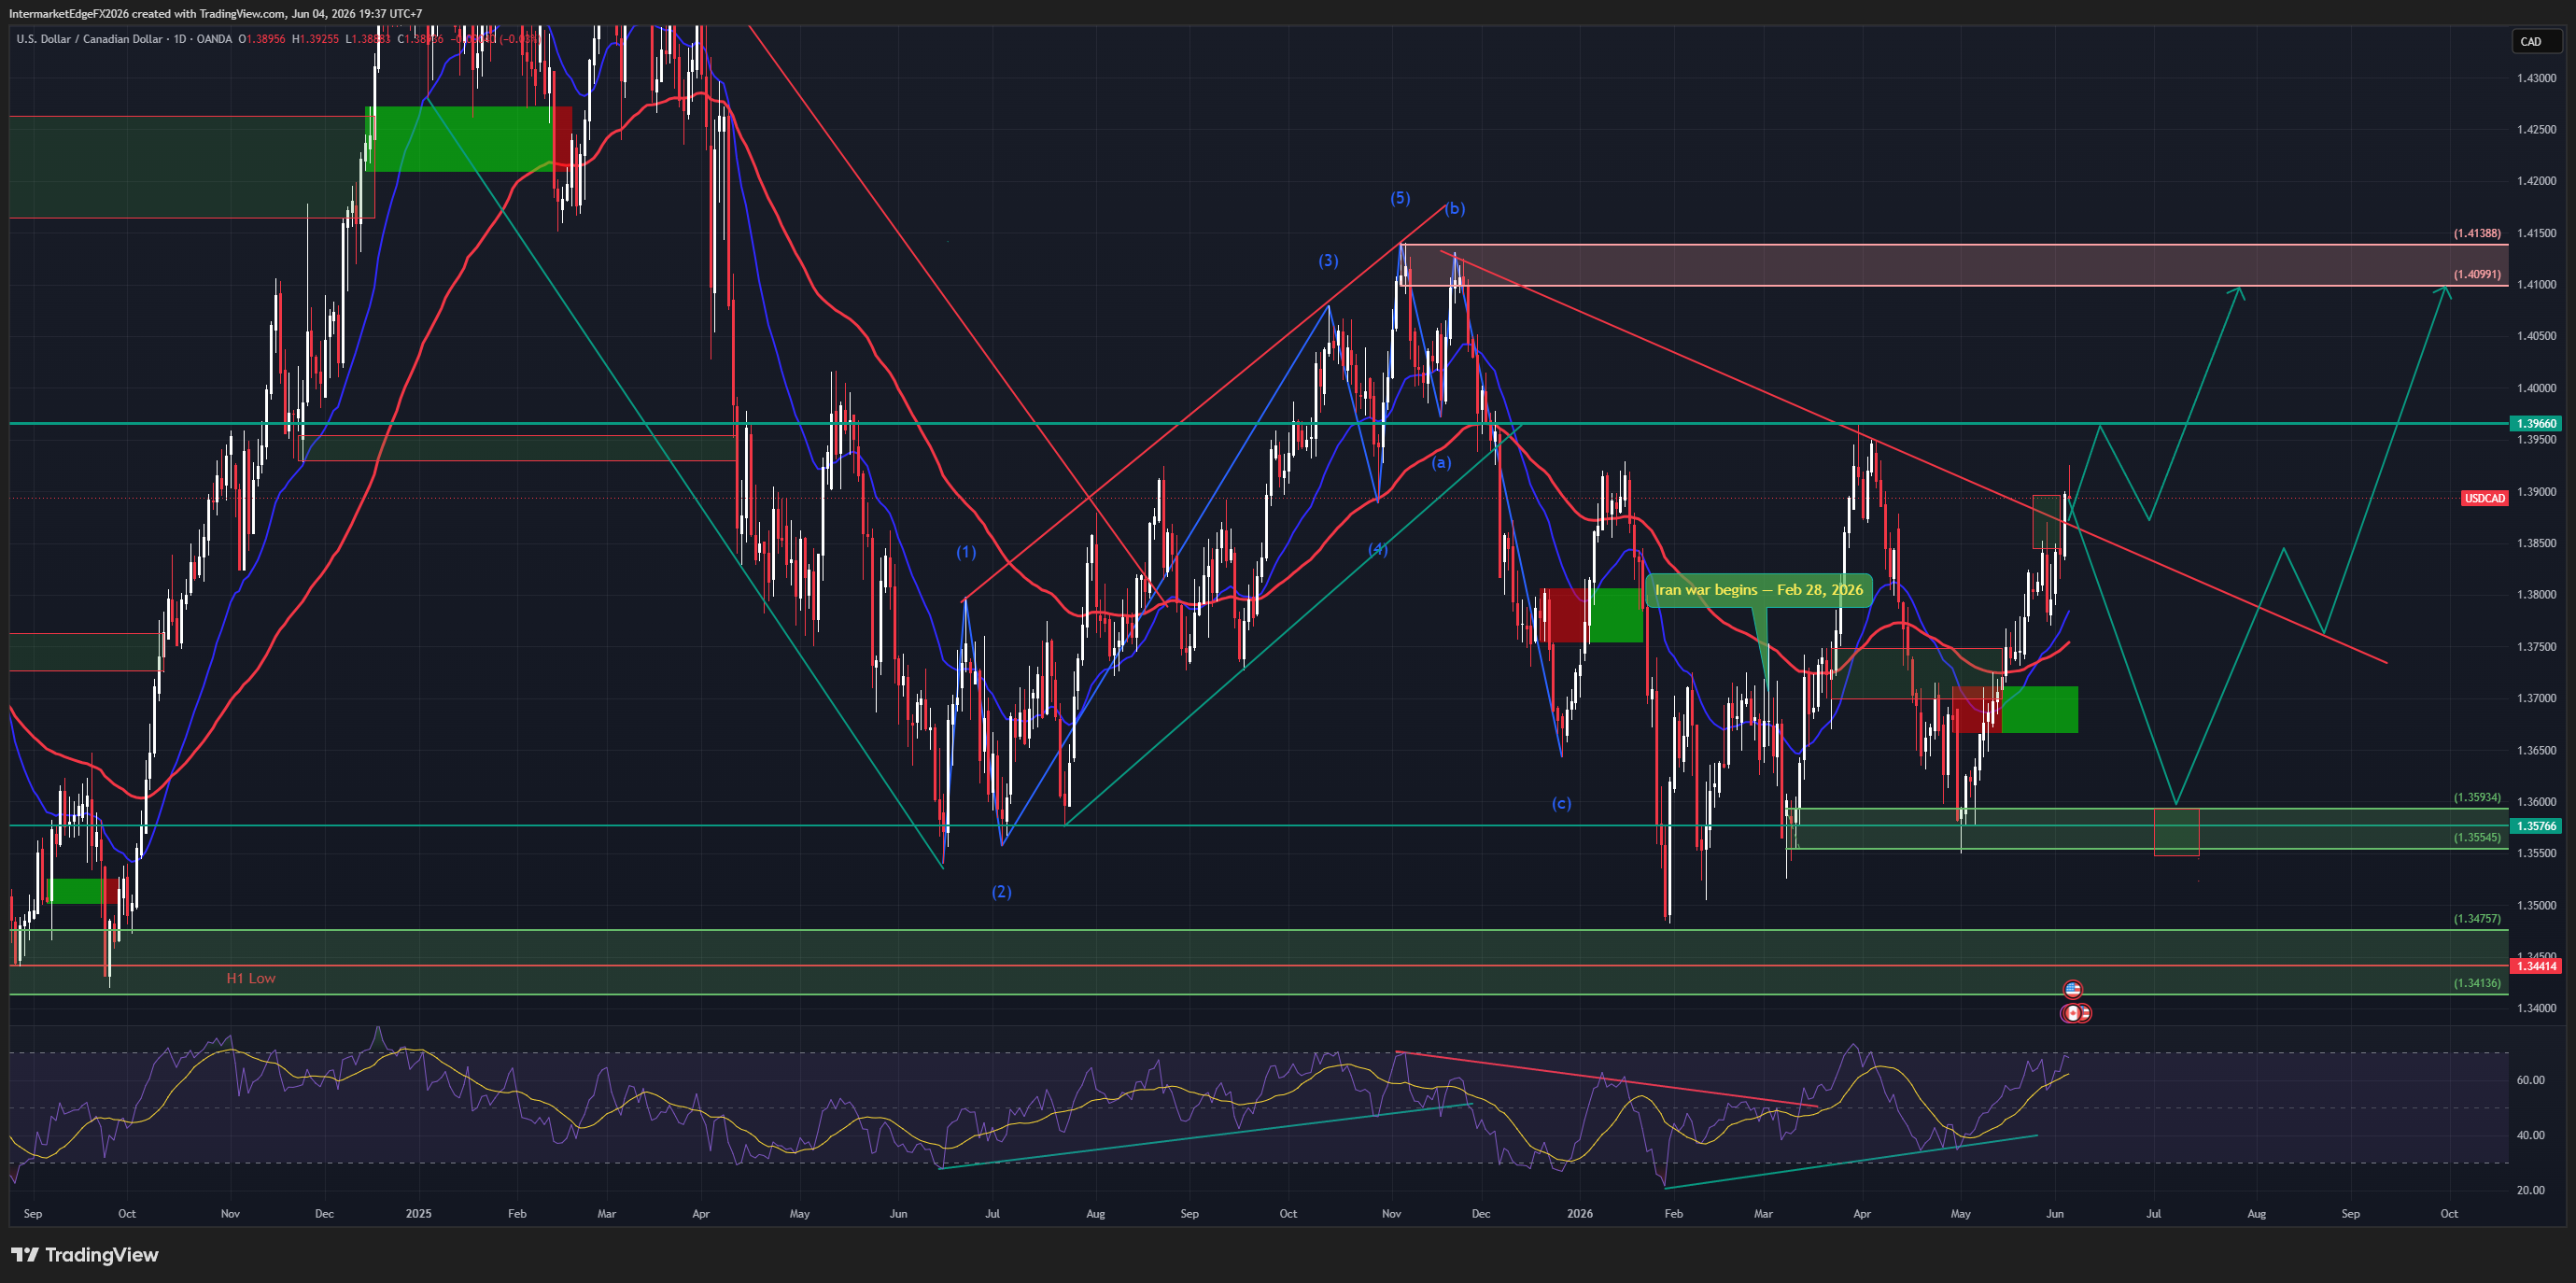
USDCAD 1.3893 | Canadian Dollar 8-week low | 04 June 2026 The Canadian dollar is at its weakest in eight weeks, and three forces are keeping it there simultaneously. First, oil. WTI has declined from $95.33 this morning to $92.61 — a $2.72 drop in a single session on Iran deal optimism. Canada is the largest crude exporter to the US. The oil-CAD channel is among the most stable relationships in FX, and it is working against the loonie today. The counterintuitive implication: if the Iran deal completes and oil falls toward $80-85, CAD gets weaker, not stronger. USDCAD could test 1.4099 resistance on deal completion. Second, domestic weakness. Canada's Q1 2026 GDP contracted for a second consecutive quarter. BoC core inflation measures slowed to five-year lows. The Bank of Canada meets June 10 and is expected to hold at 3.25% — but a dovish tone acknowledging the growth weakness would push USDCAD toward 1.4000-1.4050. Third, USMCA risk. AUDCAD at 0.9920 — below the 1.000 parity level — confirms the structural CAD discount from trade uncertainty is still live. Until AUDCAD holds above 1.000, CAD carries a structural discount that cannot be removed by oil alone. On the chart, price is approaching the 1.4099-1.4139 resistance zone. A daily close above 1.4099 confirms the bull move. A daily close below 1.3593 activates wave (c) lower toward 1.3477 then 1.3400. BoC June 10 is the gating event. Conviction: Medium, Mildly Bullish.

USOIL — Sixth Consecutive Draw, Iran Fires Missiles, Lebanon Complicates the Deal, and $92 Is the Floor That Matters

USOIL — Sixth Consecutive Draw, Iran Fires Missiles, Lebanon Complicates the Deal, and $92 Is the Floor That Matters

USOIL $95.33 | EIA -7.974M bbl | 04 June 2026 The most bullish EIA print of the current cycle just dropped. Six consecutive weekly draws. Distillates at a 23-year low. The supply picture is unambiguously tightening. And WTI is falling anyway. That is the paradox defining the oil market today — and understanding it is the key to positioning correctly. The EIA draw of -7.974 million barrels for the week ending May 30 was nearly three times the forecast of -2.900M. At current draw rates, US crude stockpiles approach the five-year minimum range within four to six weeks. This is the fundamental floor argument for WTI holding $90-92: the supply picture does not support a rapid decline to the bear targets of $74-71 without either a demand collapse or a full Hormuz reopening. The reason prices are falling despite this data is the Iran-Lebanon nexus. Tehran has conditioned any deal progress on a halt to Israeli operations in Lebanon. Israel has continued strikes despite Trump personally asking Netanyahu to hold back. Iran launched ballistic missiles. US forces struck Qeshm Island in retaliation. Iranian state media says message exchanges with Washington have been suspended. The deal is not dead — Trump insists talks are active — but it is in its most fragile phase since the April 8 ceasefire. The $100-102 resistance has failed twice this week. The $92-97 consolidation zone is the current equilibrium. The $88-92 floor is where supply fundamentals provide genuine structural support. Bear targets if deal completes and Hormuz reopens: $74.49 → $71.11. Invalidation: daily close above $102. Conviction: Medium, Neutral-to-Mild Bear. Timeline extended 2-4 weeks by Lebanon complication.

EURJPY at the Ceiling — ECB Cuts Into BoJ Normalization, Oil Rebounds, and 187.936 Is the Line That Cannot Hold

EURJPY at the Ceiling — ECB Cuts Into BoJ Normalization, Oil Rebounds, and 187.936 Is the Line That Cannot Hold

EURJPY 186.063 | 02 June 2026 EURJPY is sitting inside the red resistance zone at 186.00–188.012, and the bear case here is the highest-conviction position in this week's entire instrument coverage. Three structural forces are aligned in the same direction. The ECB is cutting. The June 5 decision — two days away — takes the deposit rate from 2.50% to 2.25%. The rate differential between the ECB and BoJ is compressing, and it will compress further with every subsequent cut. A cutting central bank does not produce a strong currency. The euro is the structurally weaker leg of this cross. The BoJ is normalizing. The pipeline's JP10Y reads 1.47% — stale, last updated May 9. The chart sidebar shows 2.563%. That 110 basis point gap is not a rounding error; it reflects a Japanese bond market that is pricing significantly more BoJ tightening than the pipeline implies. The yen leg of EURJPY has structural support the data pipeline is obscuring. The intervention ceiling is live. USDJPY at 159.852 is 15 pips from 160.00 — the threshold that triggered verbal and physical BoJ intervention in 2024 and that the market universally treats as the current line. A physical intervention would produce a 3–5% yen rally and drive EURJPY down 500–700 pips rapidly. The asymmetry is severe: upside above 160 is capped, downside from intervention is sharp. The single countervailing factor is today's Brent rebound from $91.69 to $98 on Iran deal uncertainty. Japan is the world's fourth-largest oil importer — oil up means yen weakens mechanically. This is why EURJPY is holding near 186 rather than already declining. It is transitional noise, not a structural reversal. Invalidation: daily close above 187.936. Bear confirmation: daily close below 184.00. Wave (c) targets: 171.047 → 169.867. ECB June 5 is the trigger. Conviction: Medium-High Bear.

USOIL: Iran Deal Decompression Meets OPEC+ Supply Unlock - EIA Crude Draw of 7.9M bbl Confirms: Today's Bounce Is Fundamental

USOIL: Iran Deal Decompression Meets OPEC+ Supply Unlock - EIA Crude Draw of 7.9M bbl Confirms: Today's Bounce Is Fundamental

WTI is up 3% today. The reason is not what you think. Everyone is calling it a "deal waver" bounce. They are partially right. But there is a more important number underneath that headline. EIA crude draw: -7.9M bbl. Week ending May 15. That is not a technical bounce. That is demand outpacing supply by a significant margin even as Iran deal decompression has been pulling prices lower for 10 straight days. Here is what that number means in context: Brent fell from $111.27 on May 18 to $93.23 yesterday. That is $18.04 in 9 days - the market was aggressively pricing a deal. But demand never blinked. Commercial crude stocks at 445.0M bbl, down from 452.9M. Gasoline also drew down 1.5M bbl. Consumer demand intact. This changes the bear thesis. Not the direction - still bearish toward $74-71 when the deal materializes. But the timeline. Strong demand means WTI will not collapse in one day after a deal signing. The $88-92 demand zone is a real floor, not just a technical level. The battle for Q2-Q3 2026 oil price is now clear: Bear side: Iran deal + OPEC+ adding +411kbpd from June = double supply pressure Bull side: EIA draws showing demand running well above pre-war equilibrium Neither side wins cleanly. Which is why WTI oscillates rather than trends. The one level that matters above everything else: $88. Hold above it and the bounce targets $97-100. Break below it - which requires both a large EIA build AND confirmed deal progress - and $74.49 is next. Tonight at 23:30 GMT+7, EIA releases week ending May 22 data. That is the tell. Large draw again = demand floor is structural = bounce is real. Large build = prior week was seasonal = bear resumes. This is the anchor instrument for the entire macro series this week. Oil is not a consequence of the macro regime. Oil is the cause. Conviction: Medium-High bounce near-term. Medium bear medium-term. #USOIL #WTI #CrudeOil #IranDeal #EIAInventory #OilPrice #MacroAnalysis #OPEC #Stagflation #IntermarketAnalysis

USOIL | May 21, 2026 The Oil Market's Most Important Week - What the $5 Swing Tells You About Hormuz

USOIL | May 21, 2026 The Oil Market's Most Important Week - What the $5 Swing Tells You About Hormuz

**USOIL | May 21, 2026** WTI at $101.13. Brent at $107.40. This is the instrument that drove every other analysis published this week. The Brent sequence from May 18 to May 21 is the story of the week in a single column of numbers. From $111.27 on Monday to $106.09 Thursday morning, then bouncing to $107.40 by evening. A $5 decline and partial recovery across four trading days - not noise, but the market pricing and partially repricing Hormuz reopening probability in real time. The structural picture is unambiguous. This is still the largest oil supply shock in market history by some measures. Hormuz remains largely restricted. Three supertankers transited the Strait on Wednesday - in a market accustomed to hundreds per week. That is not normalization. US crude inventories fell for a fourth consecutive week, confirming demand is holding and the supply shortage is genuine. OPEC+ adding +411kbpd from June is a gesture in a market facing a daily shortfall estimated at 14+ million barrels. But the Iran deal probability introduces a binary outcome that overrides the structural argument in the short term. A deal confirmed sends WTI toward $74-82 as the war premium exits - gradually, not instantly, because physical infrastructure takes months to normalize. A deal collapse sends WTI back toward $109-115. Wednesday's EIA data is the supporting variable. The Iran headline is the primary driver. The intermarket confirmation is clear. Gold at $4,515 recovered alongside oil today. EURUSD held above 1.15. USDJPY stayed below 160. Every currency pair analyzed this week - USDCAD, EURUSD, DXY, GBPUSD, EURGBP, EURJPY, USDJPY - moved because of this number. The structural tell is not a diplomatic announcement. It is tanker tracking data. Watch three supertankers become thirty. When that happens, Brent flips from backwardation to contango - and the war premium exits. Conviction: Medium. Structurally bullish. Directionally binary on Iran.

InterMarketEdge

© 2026 InterMarketEdge. Financial intelligence for inter-market traders.