Tag: USMCA — InterMarketEdge

Tag: USMCA

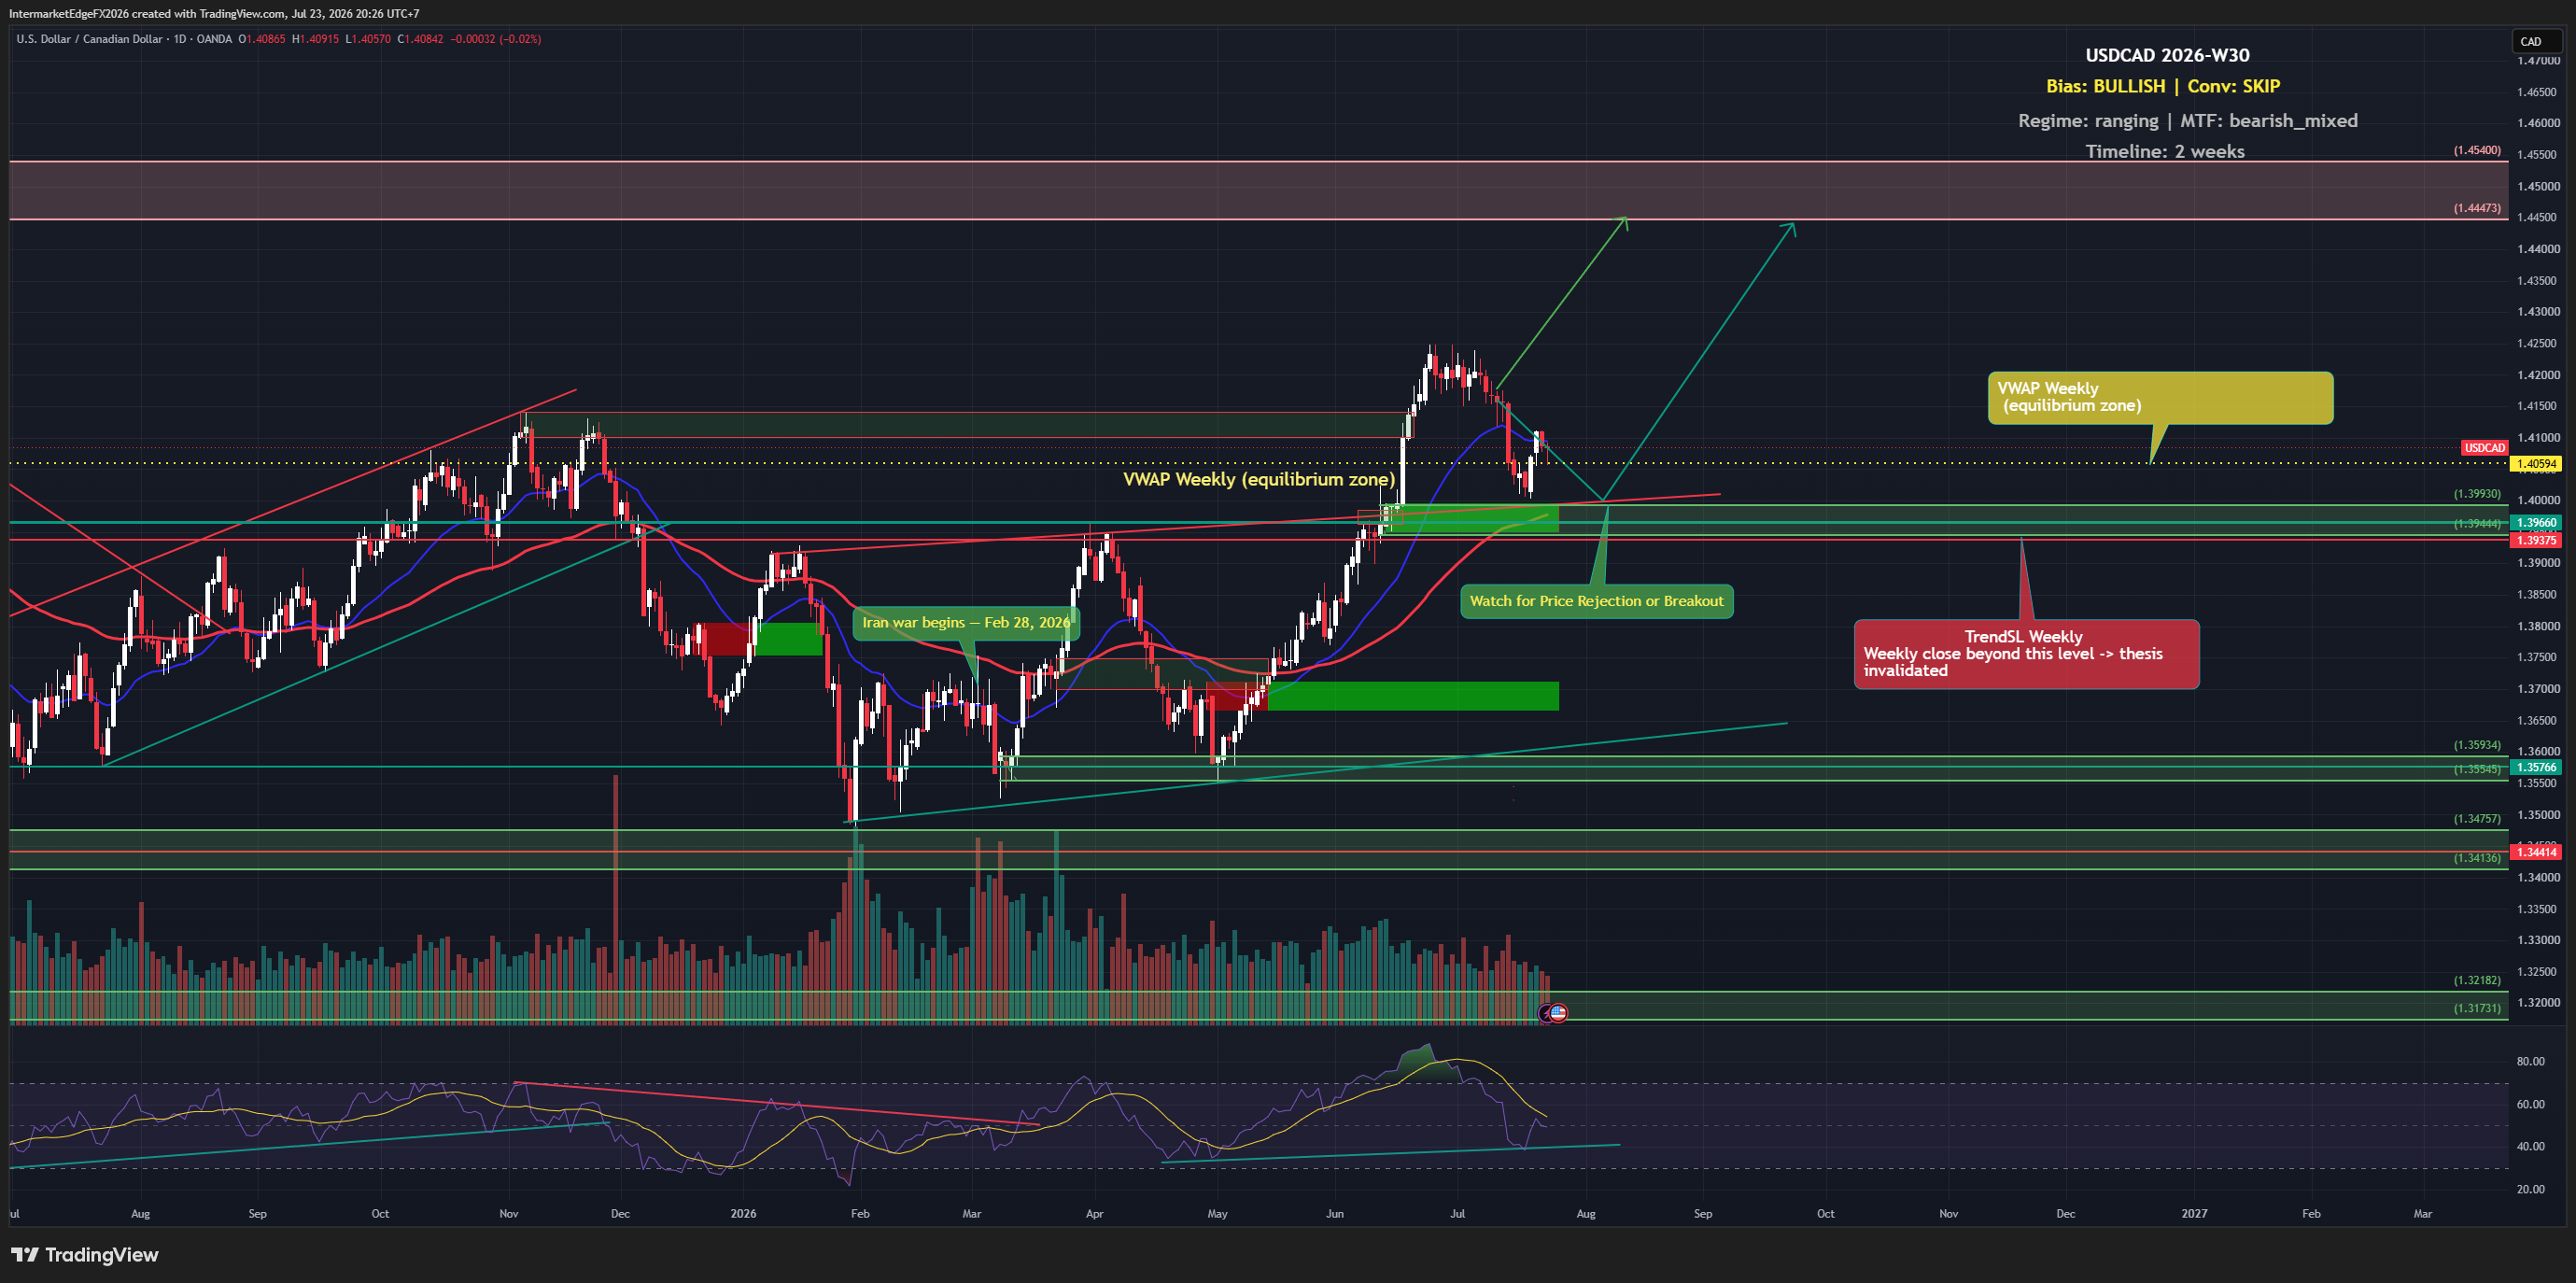
USDCAD - Wave 4 Recovers From a Deeper-Than-Expected Pullback, Price Retests the 1.4174 Decision Zone Ahead of Wave 5 Toward 1.4447-1.4540

USDCAD - Wave 4 Recovers From a Deeper-Than-Expected Pullback, Price Retests the 1.4174 Decision Zone Ahead of Wave 5 Toward 1.4447-1.4540

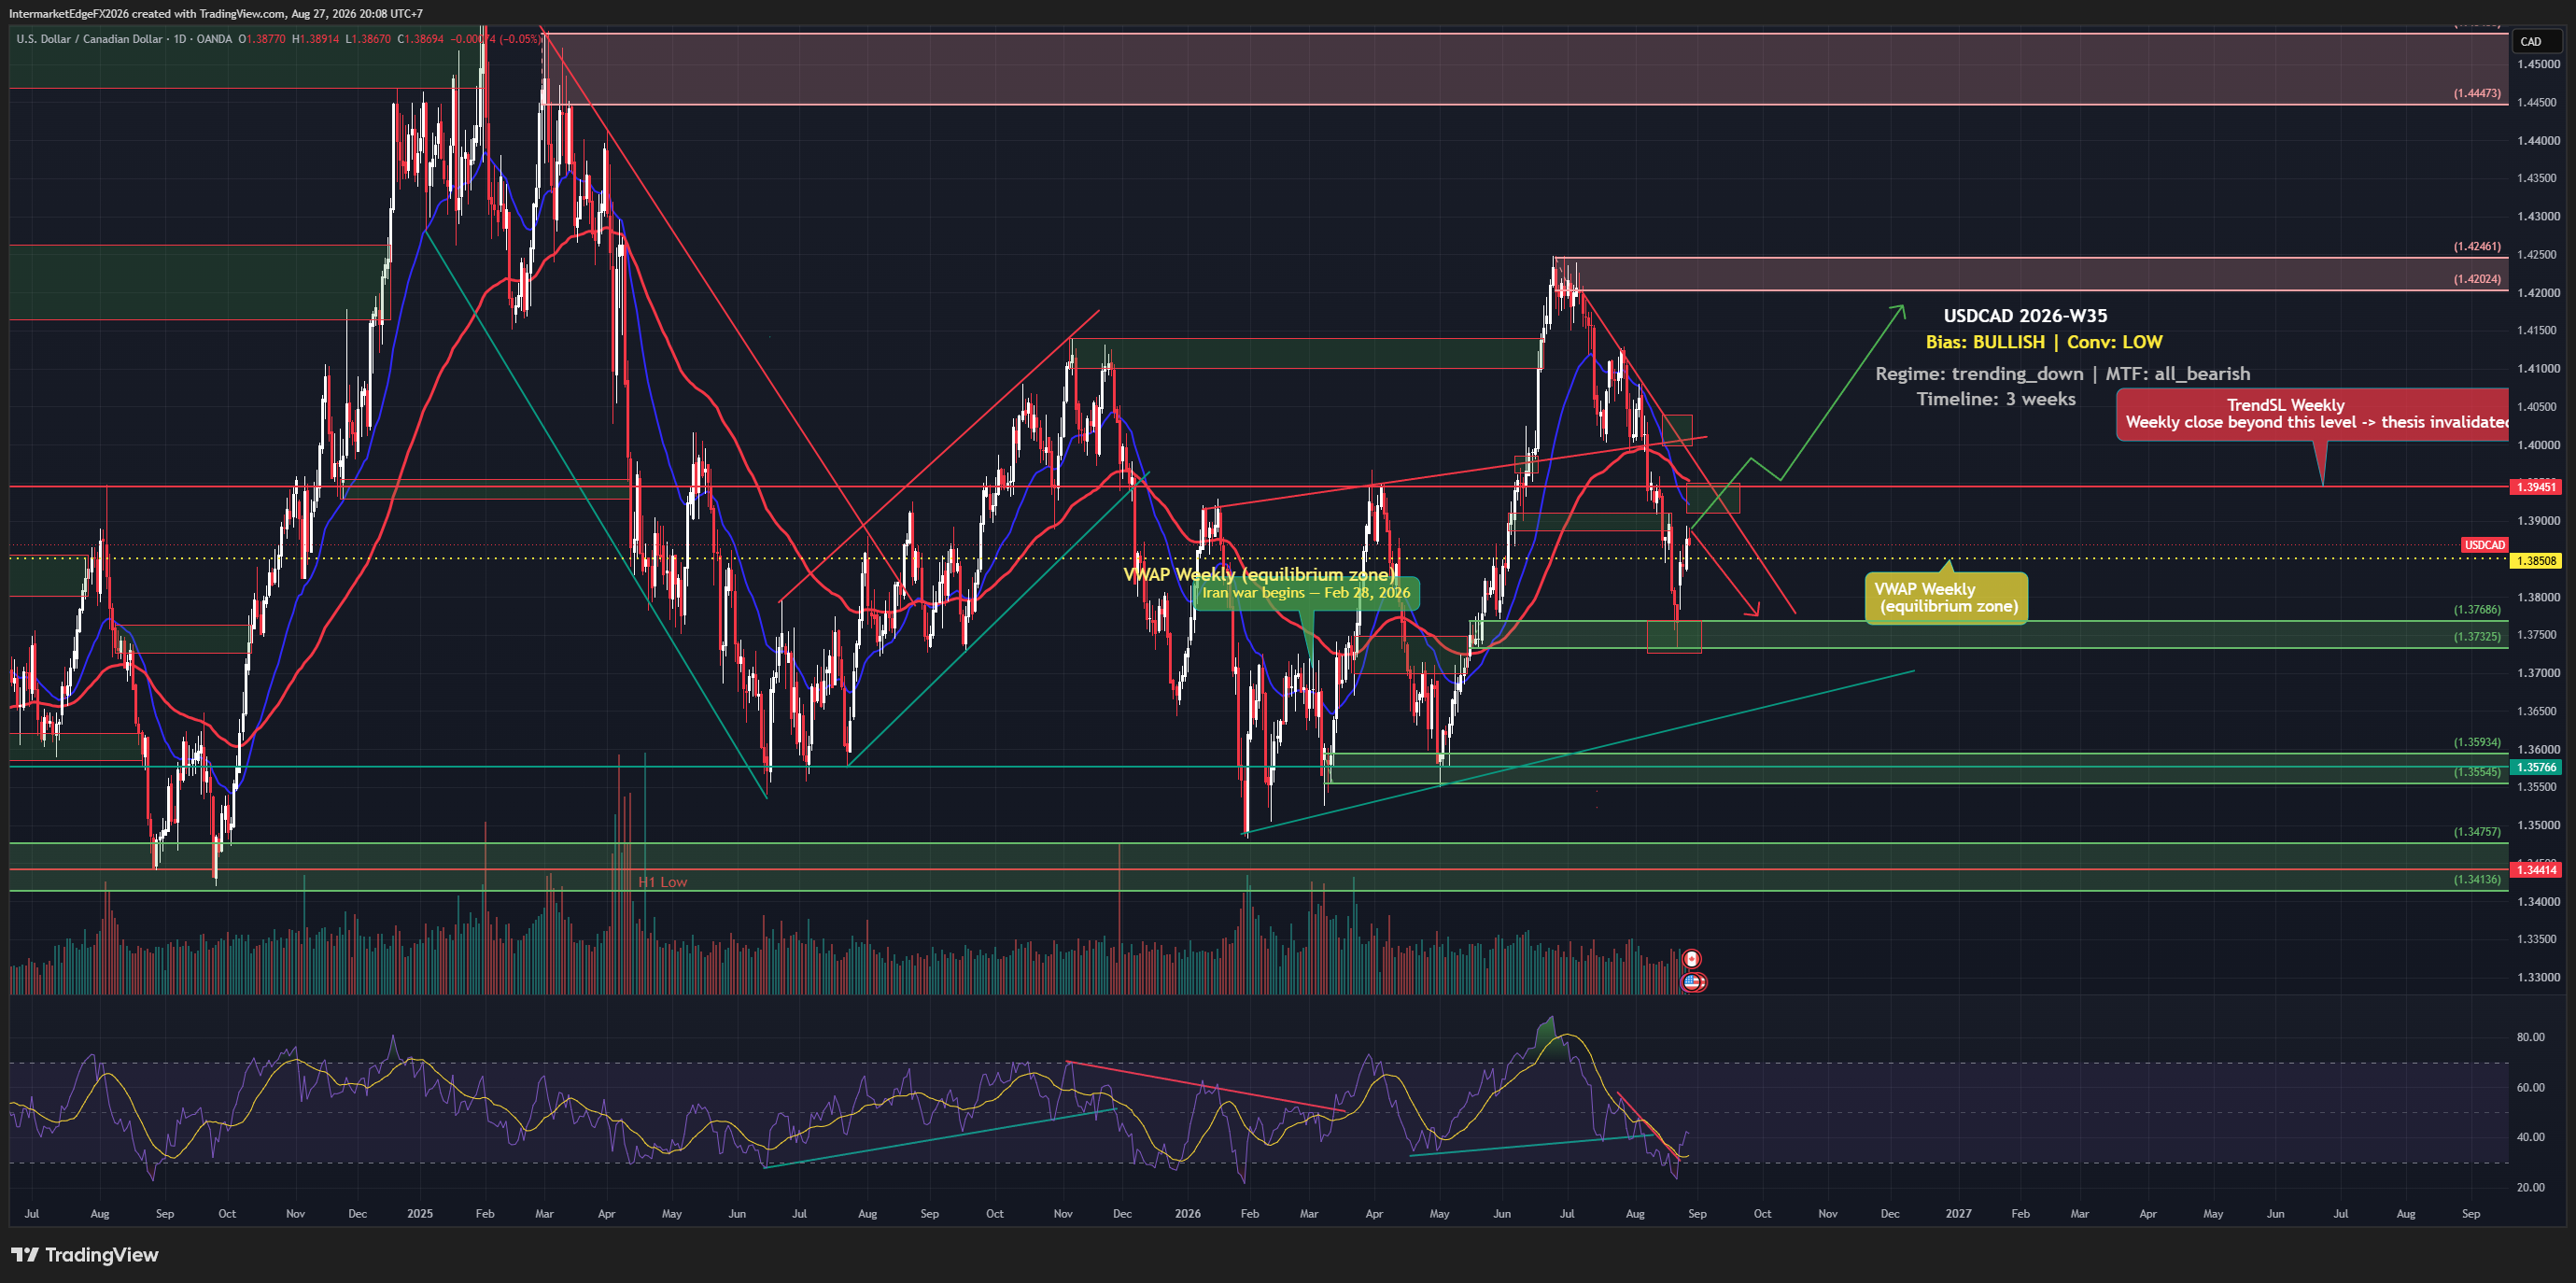
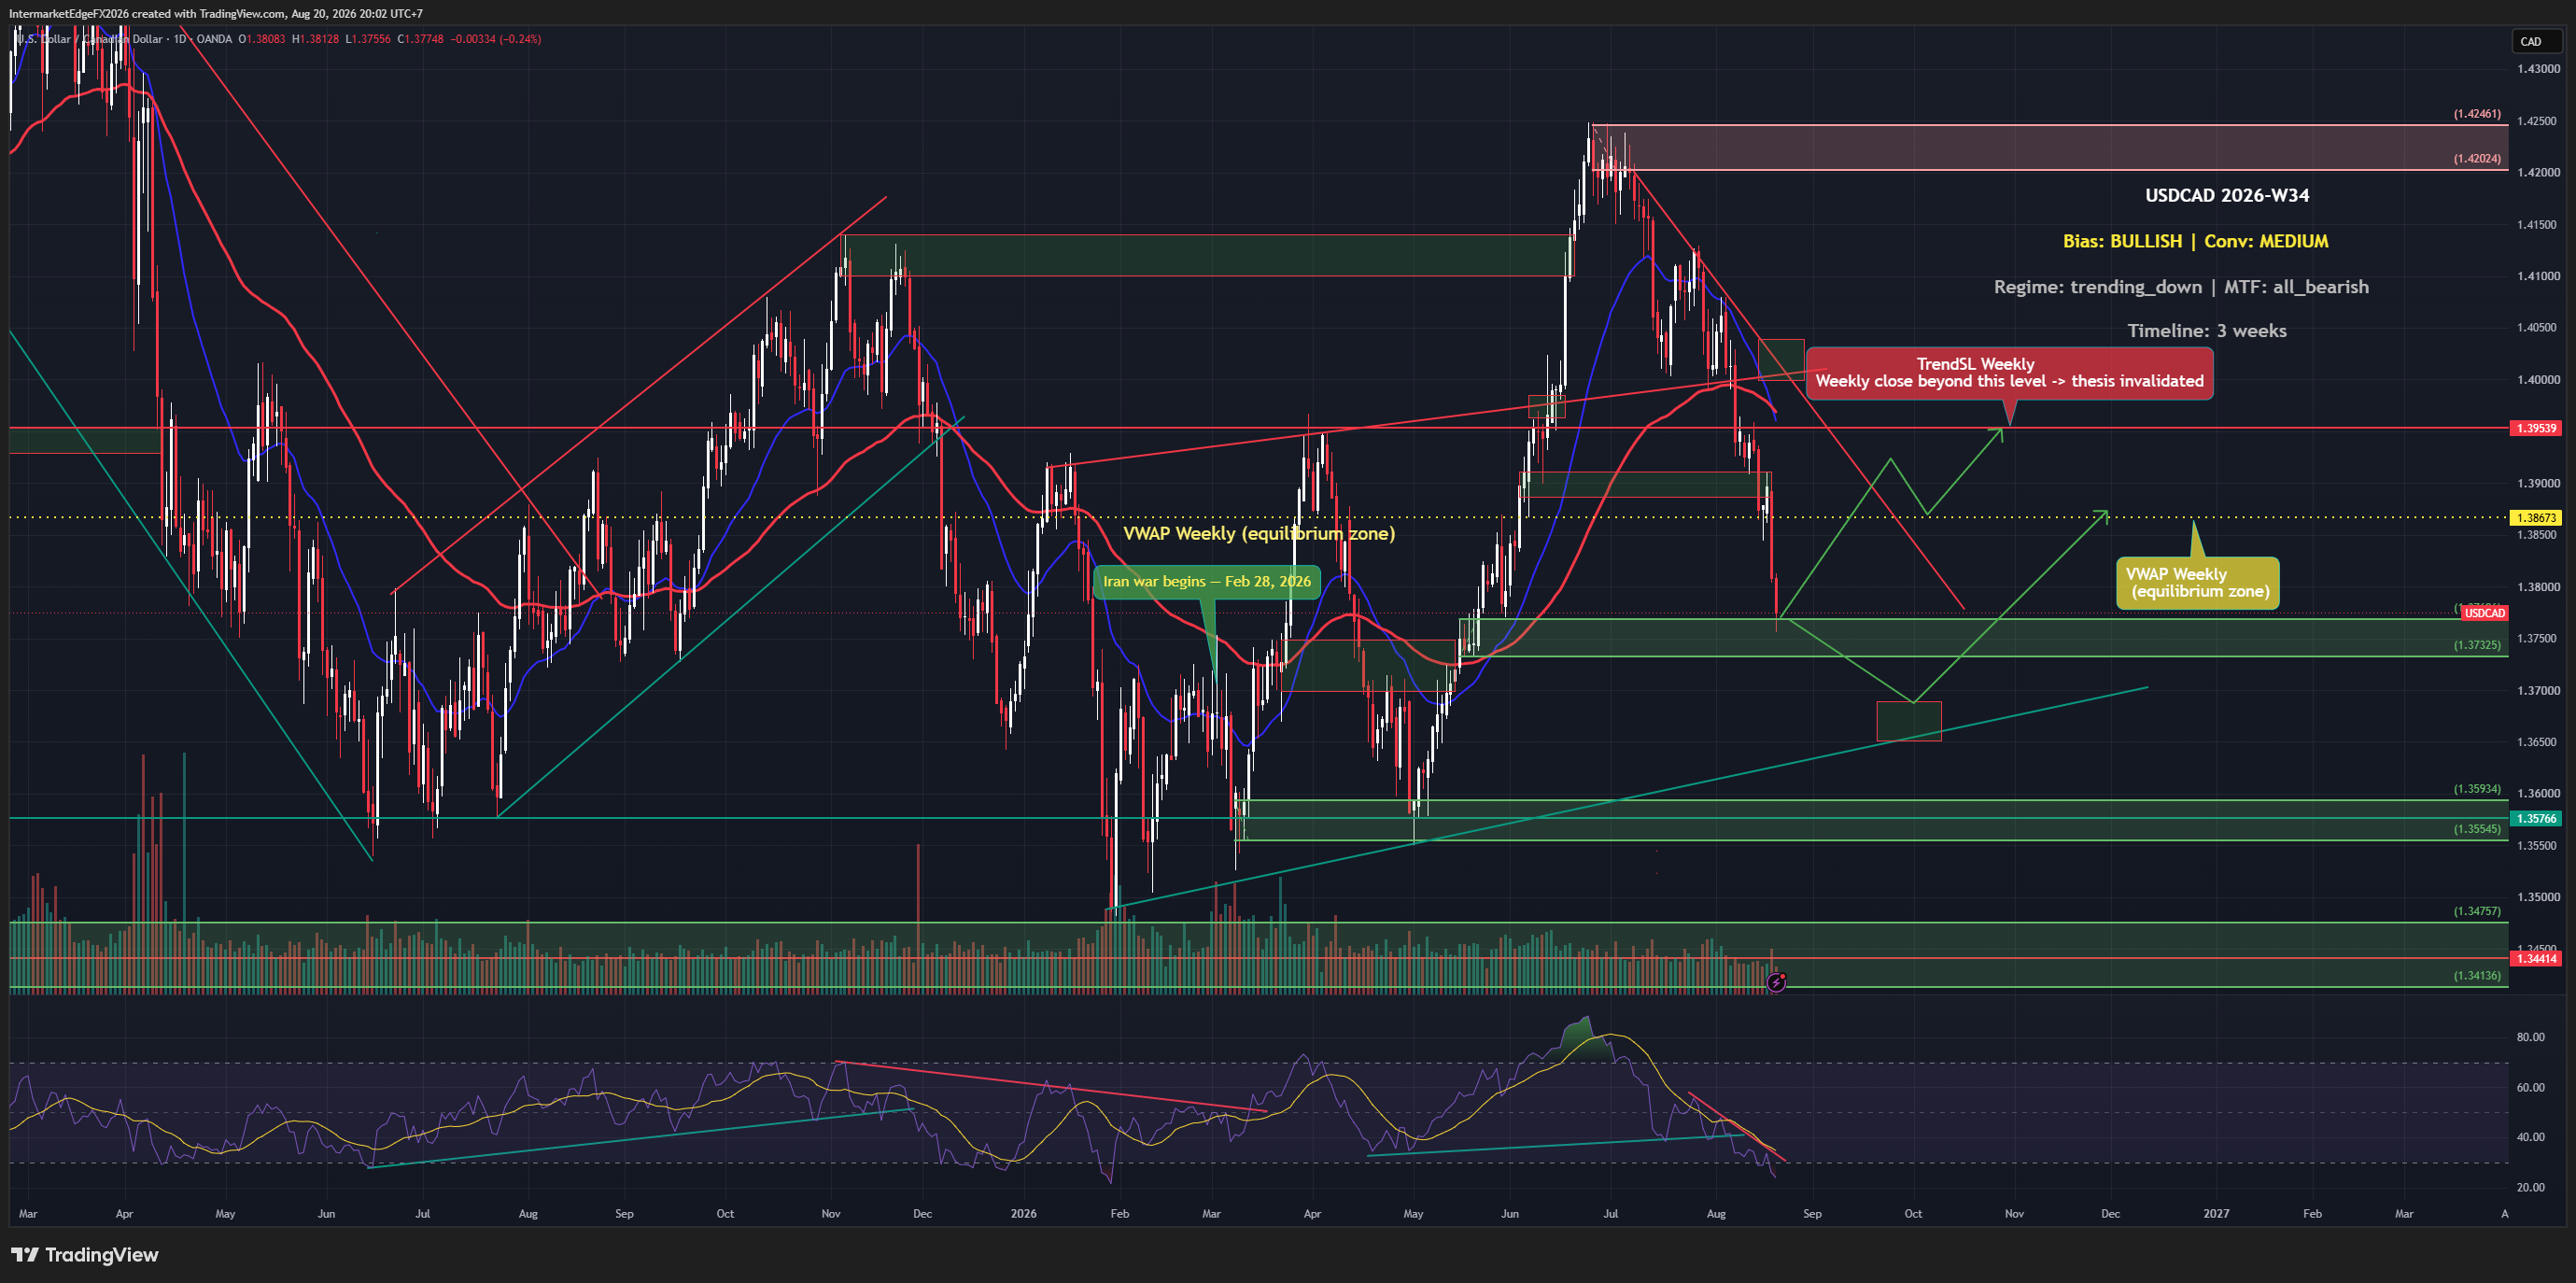
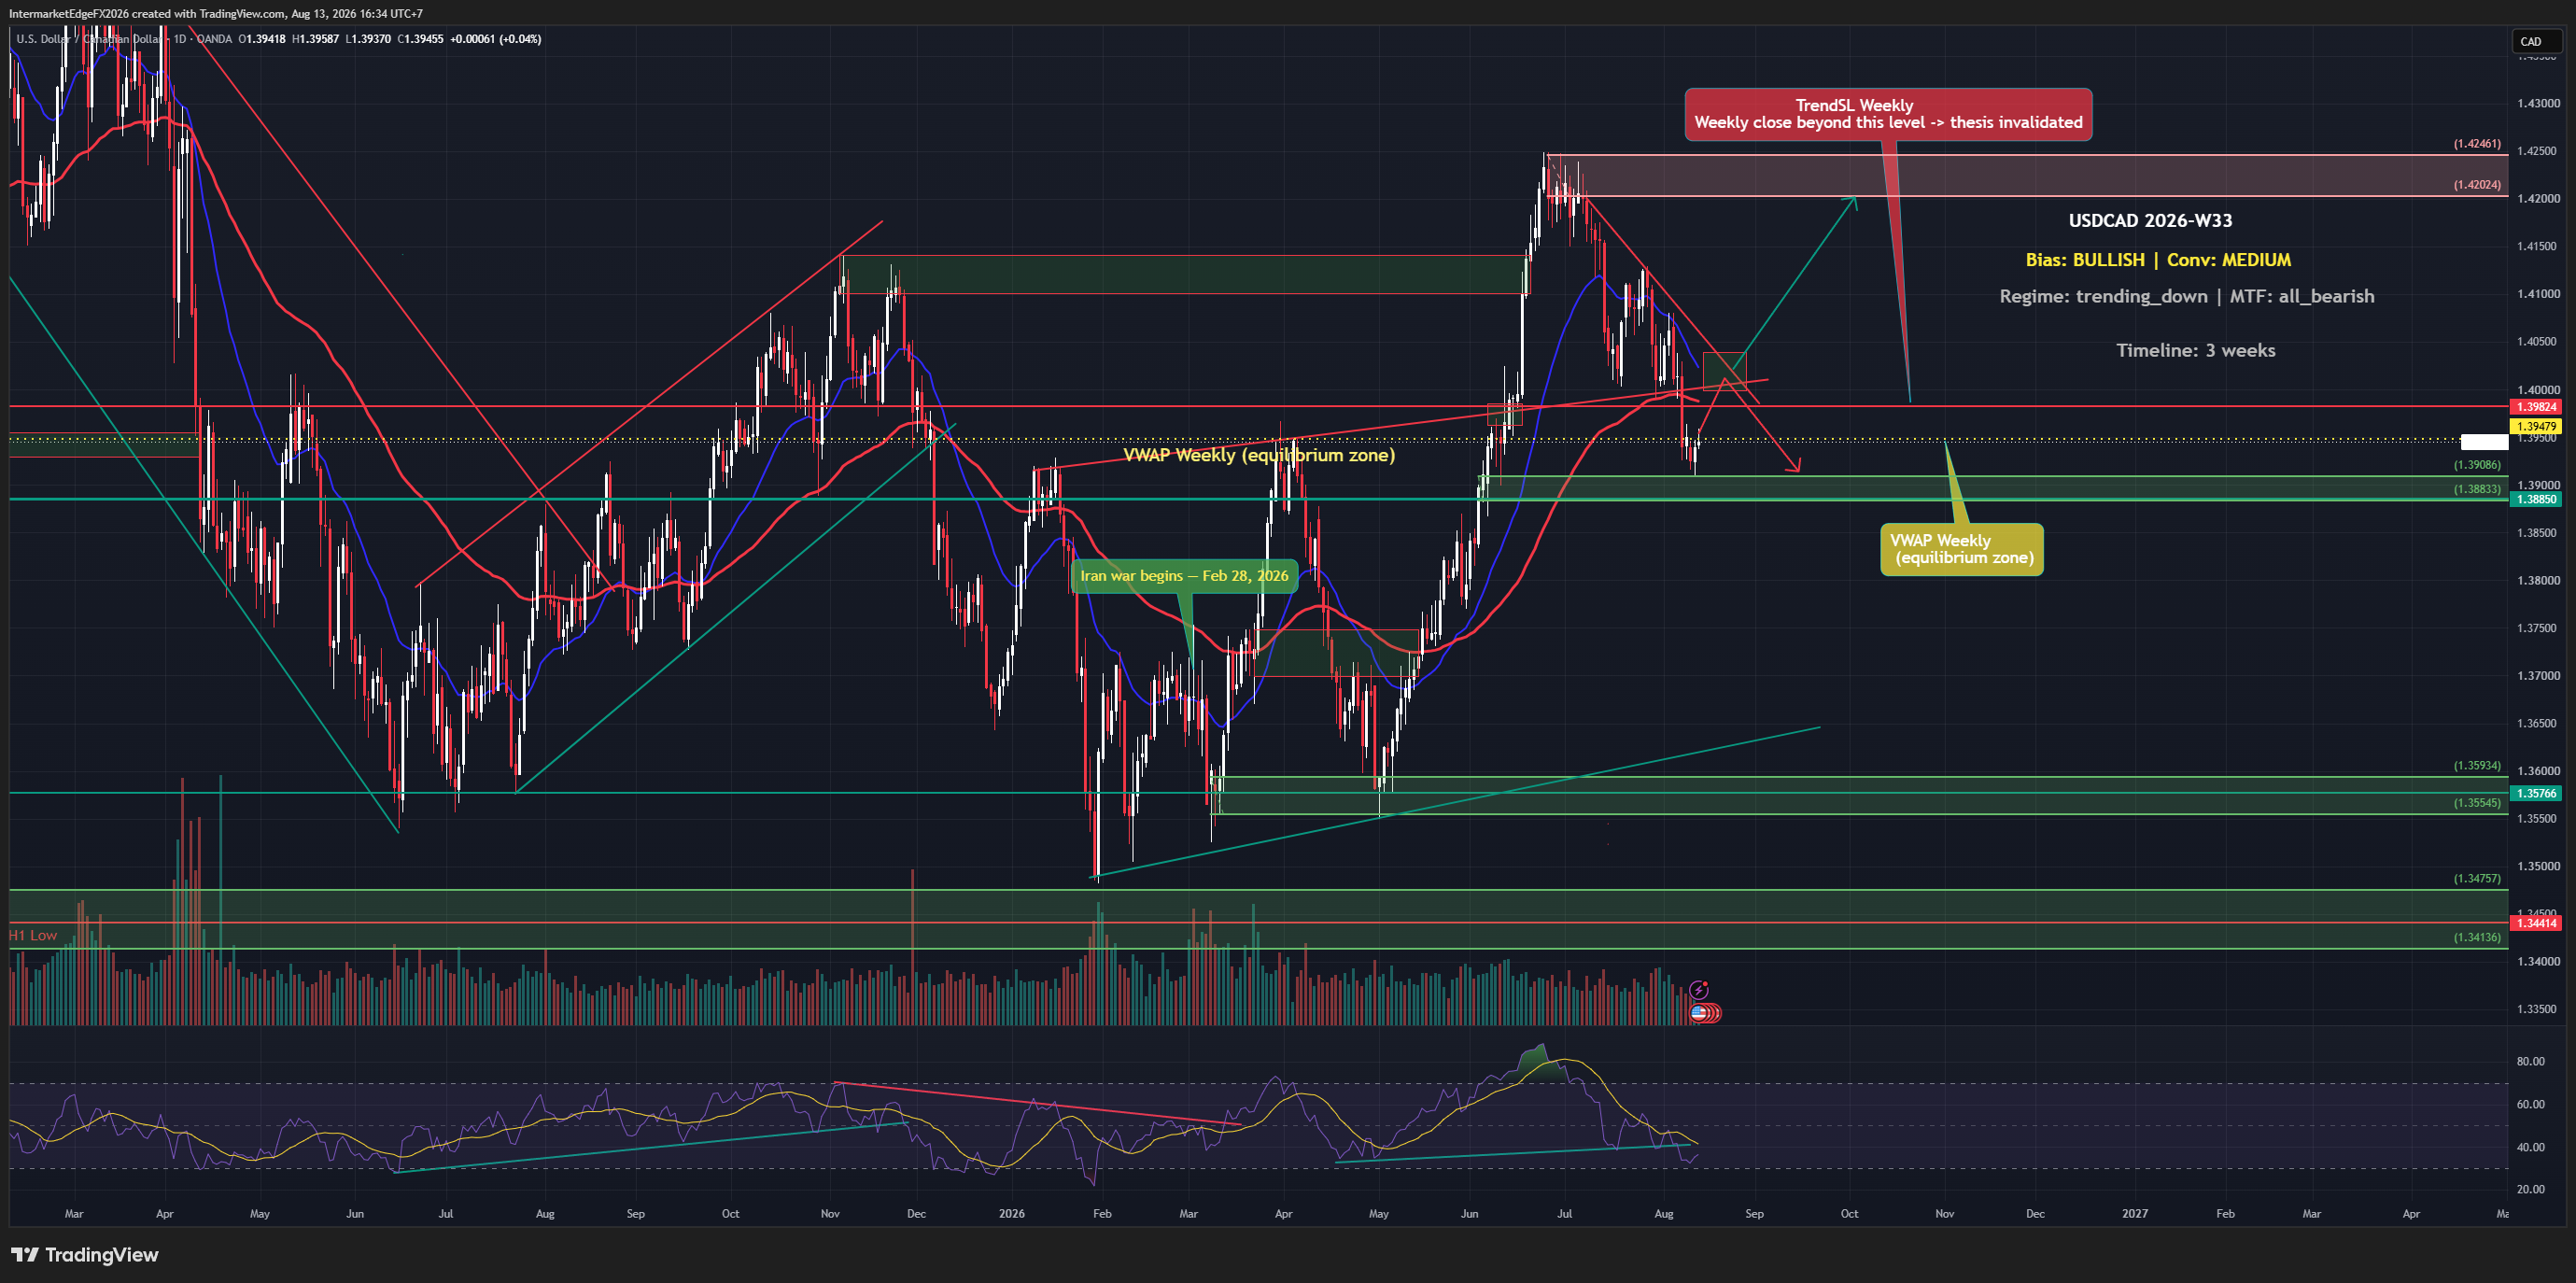
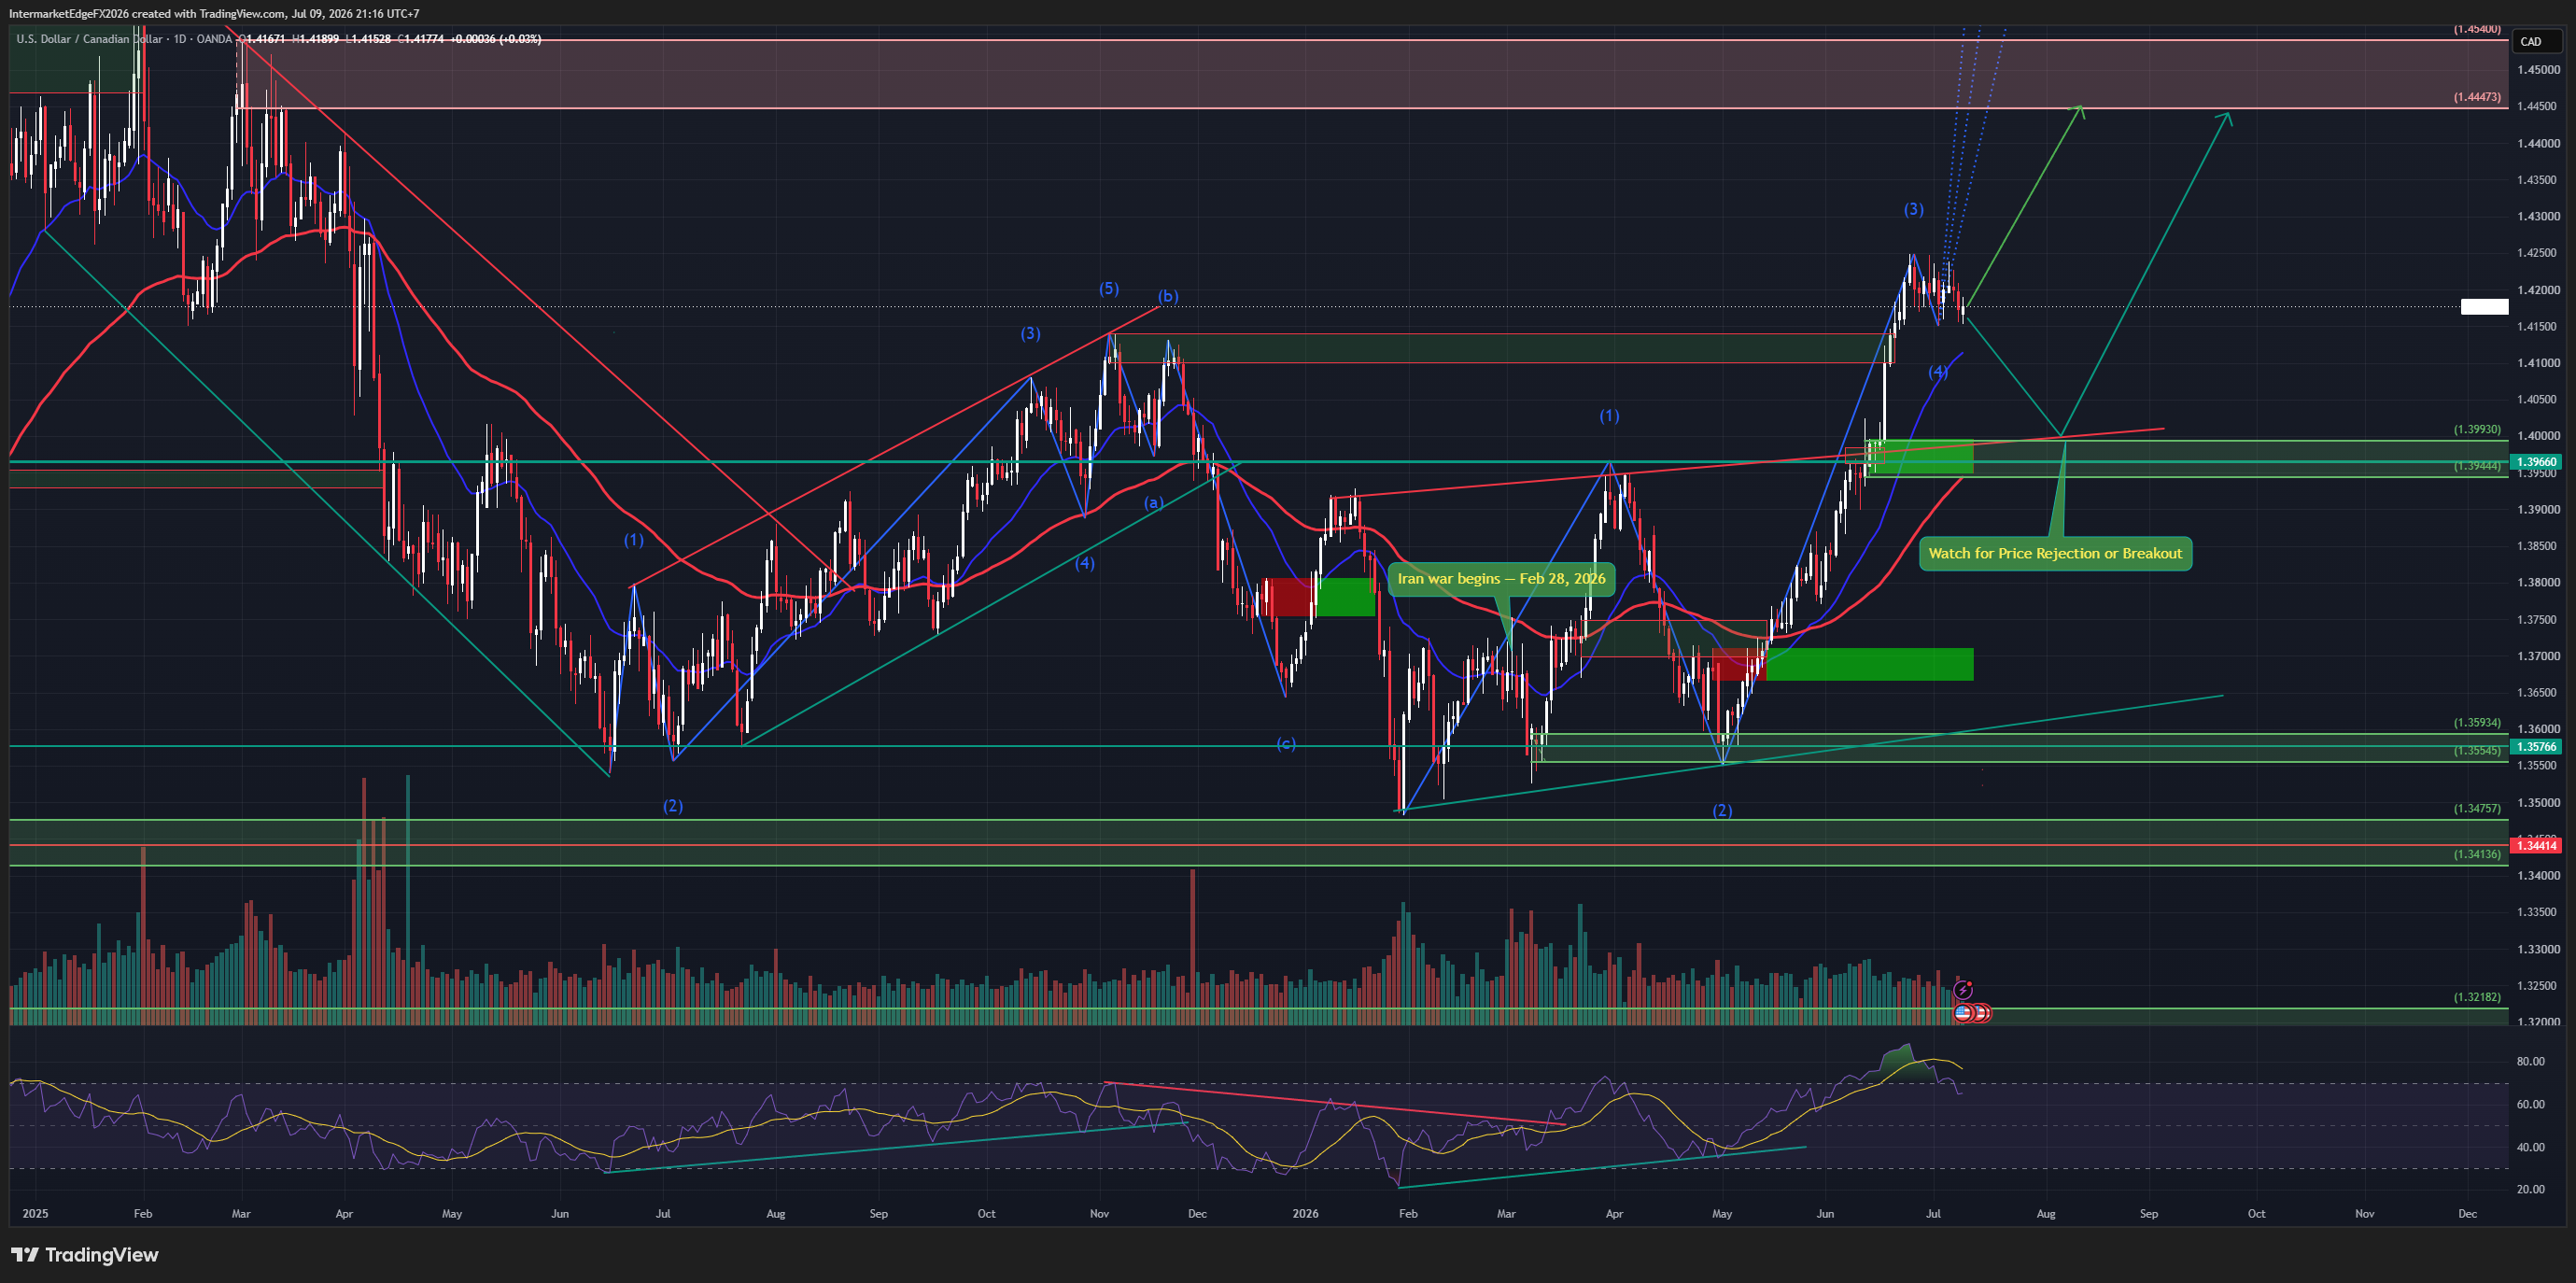
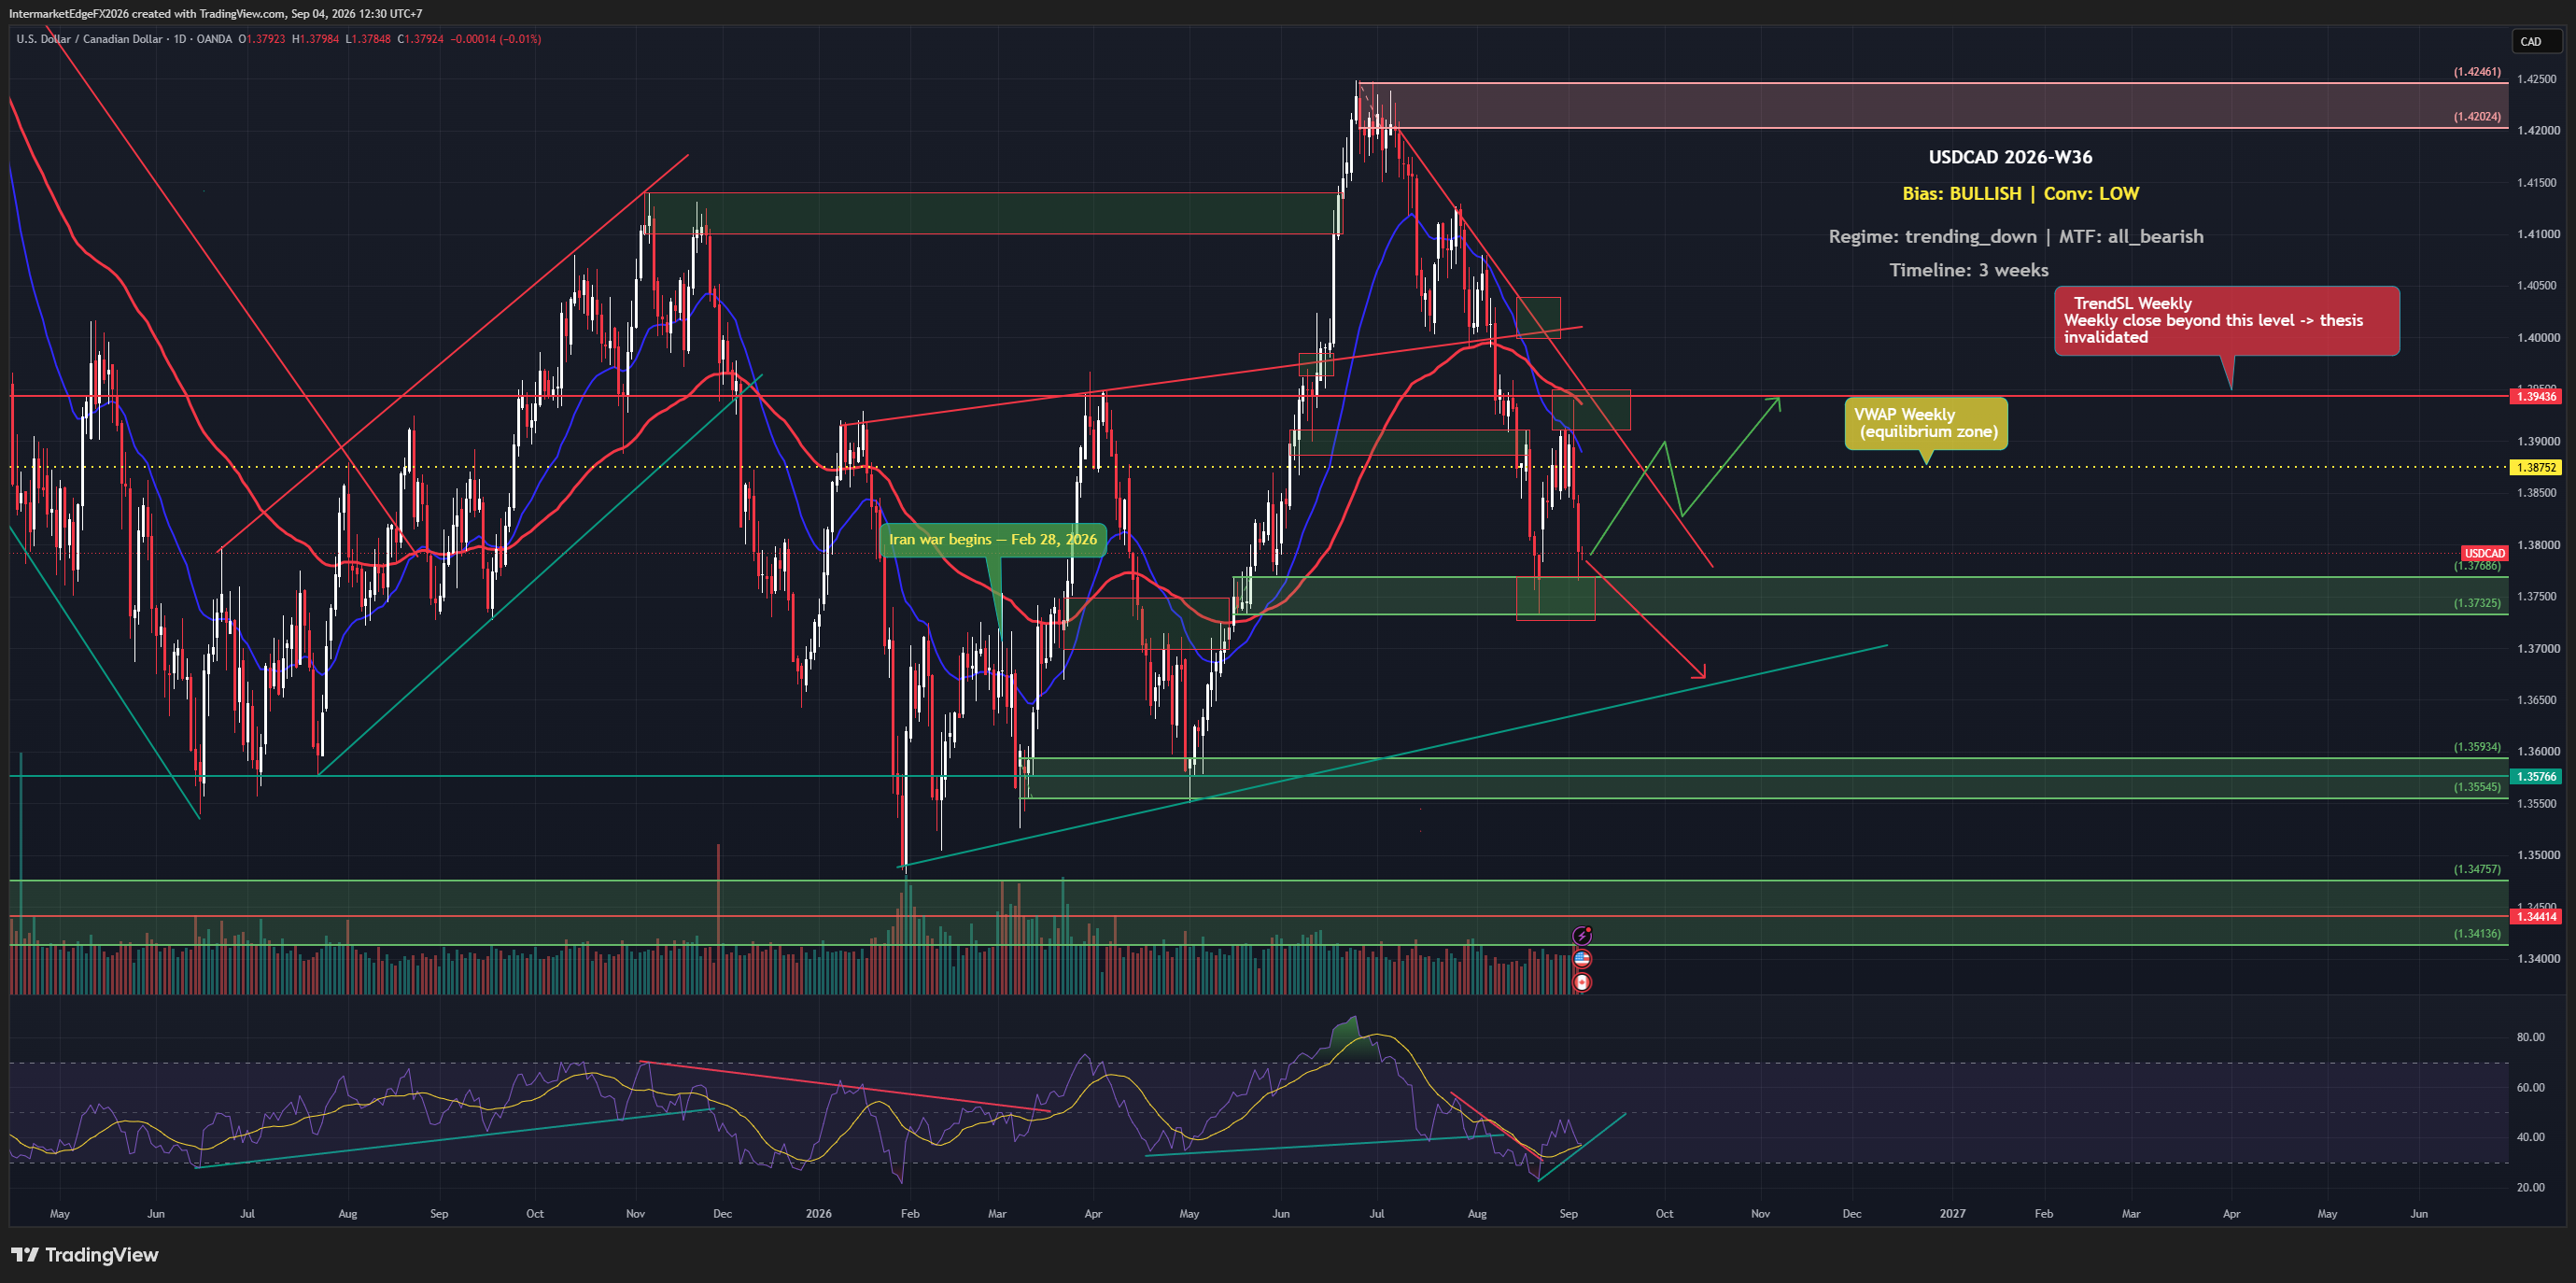
USDCAD - SUMMARY 09/07/2026 Regime: Wave 4 completed a deeper-than-expected correction (1.394-1.397 instead of 1.415-1.417), now recovering to retest the 1.415-1.417 pivot from above. Medium-High Bull unchanged. Bias: Medium-High Bull. New factors: sharp two-way oil volatility from Iran (detailed in the USOIL piece), down 2.85% today creating near-term weak-CAD pressure. VIX cooling for 3 straight days (18.4 → 17.47 → 16.45). BoC's Macklem shifted mixed-to-hawkish. Data corrections: US2Y 4.18% (not 3.693%); US CPI 4.2% (not 2.4%). D1 structure: wave (3) peaked ~1.42 on target, wave (4) fell deeper than expected to 1.394-1.397, now recovering to retest the 1.415-1.417 pivot. Wave (5) target: 1.4447 then 1.4540. Invalidation below 1.400. Scenarios: holds and continues toward 1.4447-1.4540 (40%); range 1.400-1.420 pending confirmation (40%); break below 1.400 invalidating the thesis (20%). No confirmed date/time yet for the FOMC minutes despite newsflow noting market attention. For informational purposes only, not investment advice.

USDCAD - CAD Hits a 14-Month Low as Oil Breaks Below $70 and DXY Holds a 13-Month High, a Double Squeeze Drives Wave (3) Toward 1.4447

USDCAD - CAD Hits a 14-Month Low as Oil Breaks Below $70 and DXY Holds a 13-Month High, a Double Squeeze Drives Wave (3) Toward 1.4447

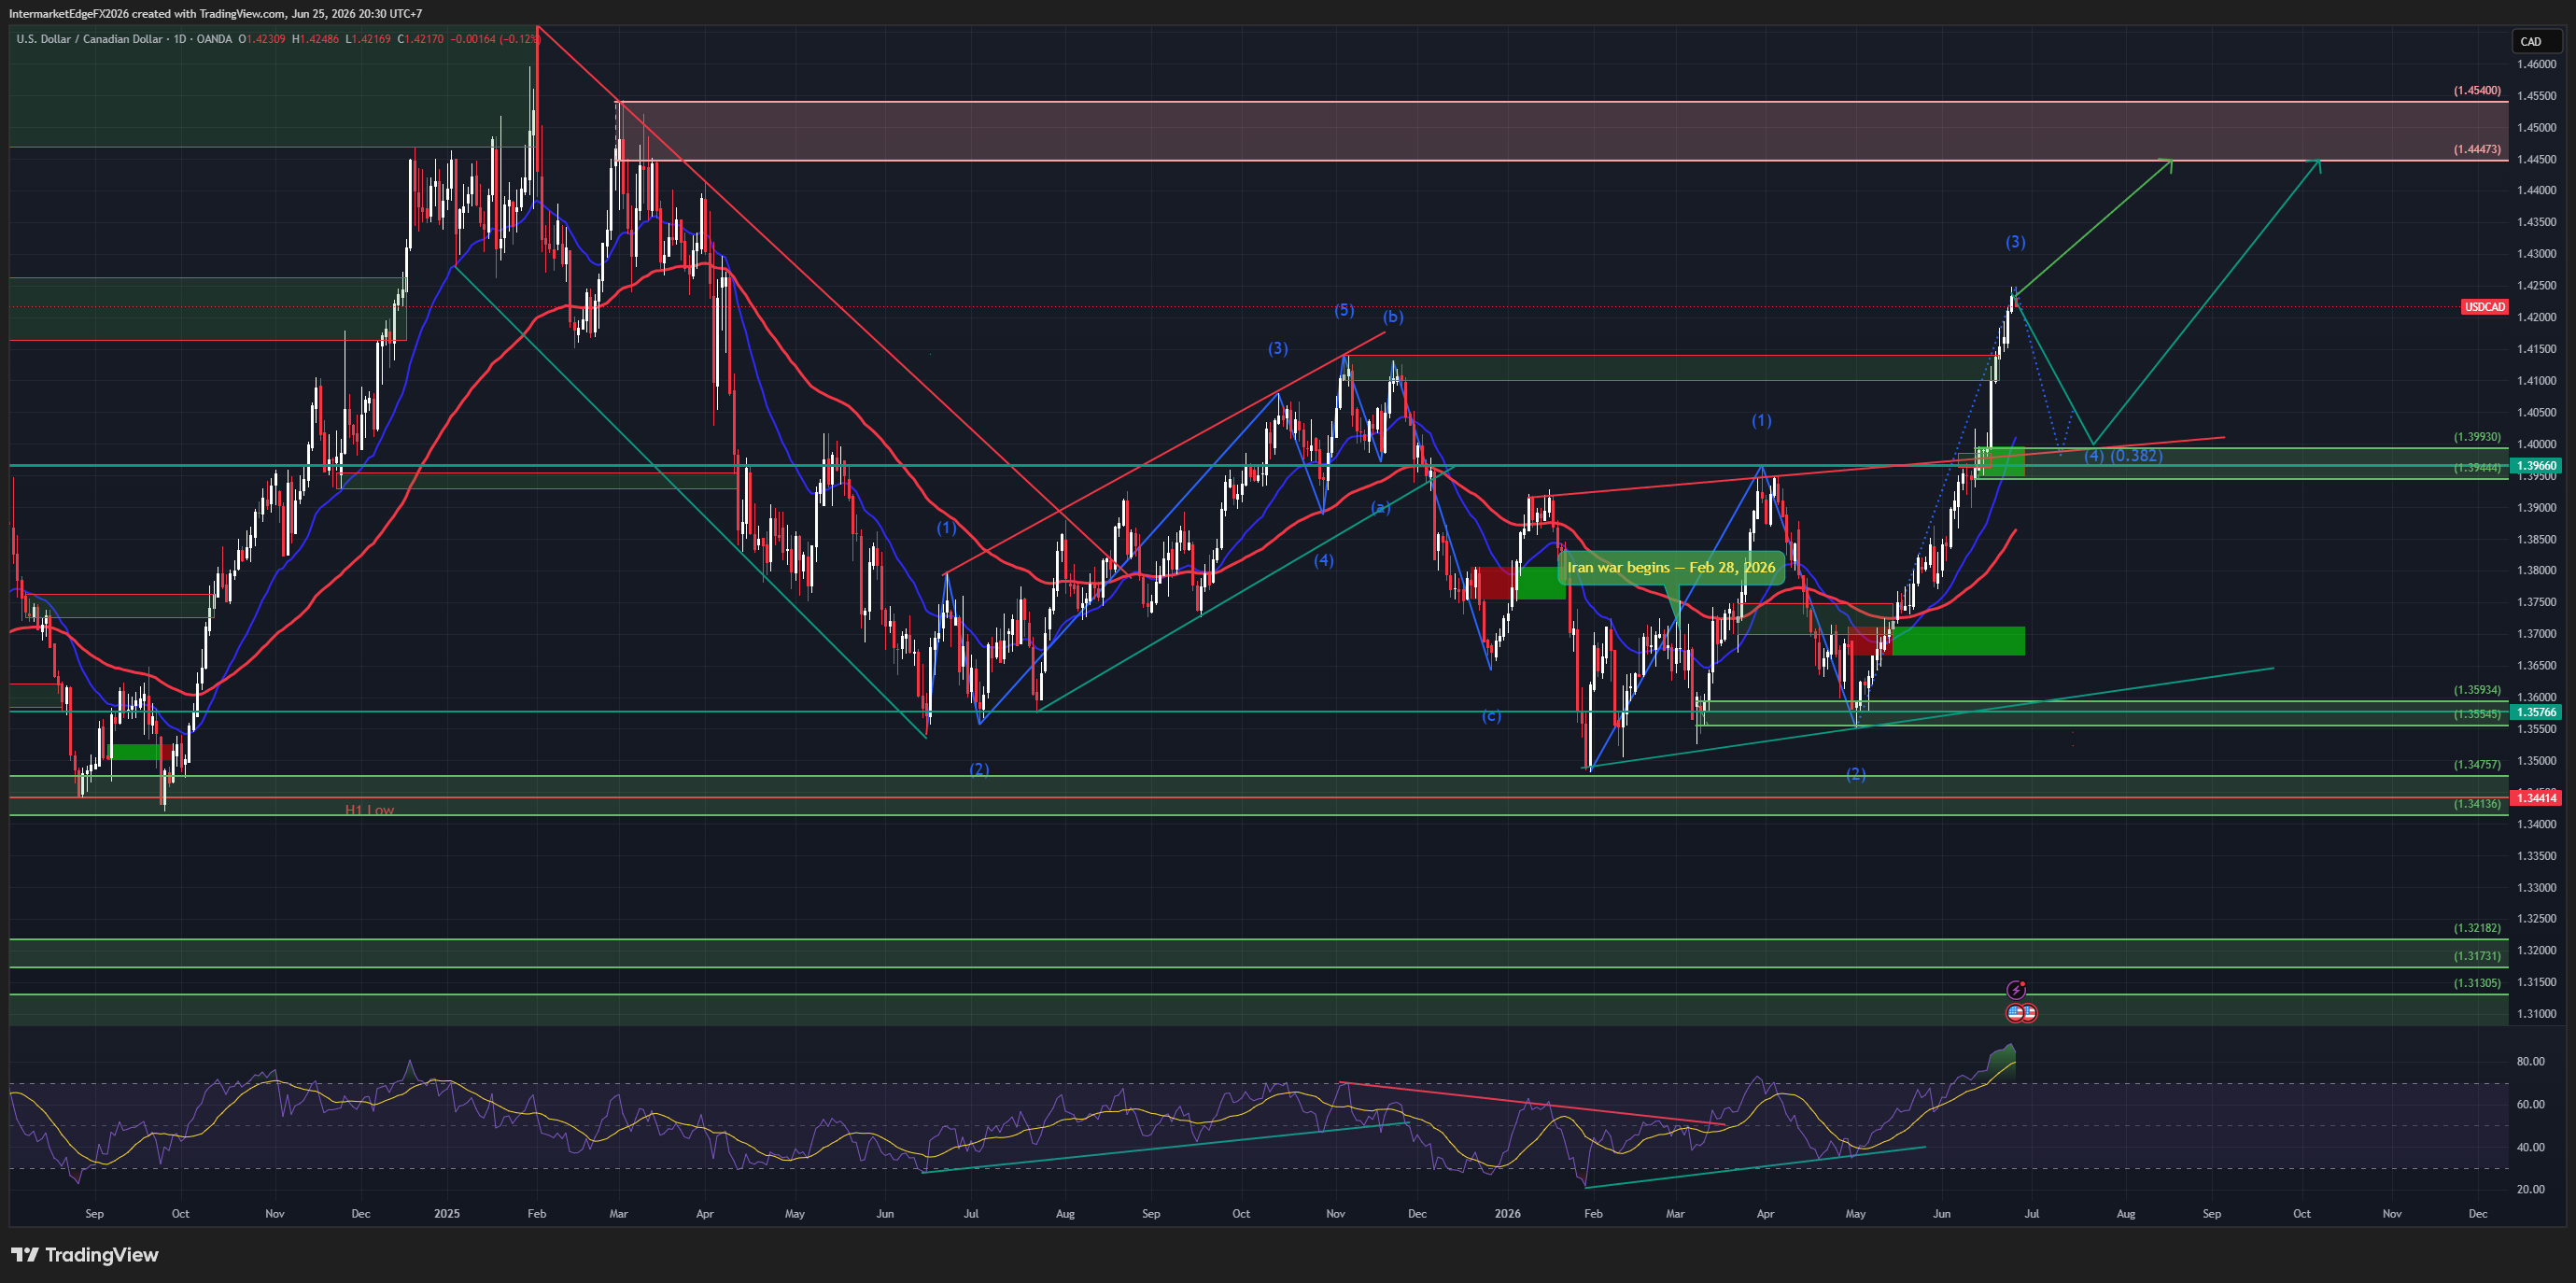
USDCAD 1.4232 | Double squeeze: 13-month DXY high + oil below $70 | 25 June 2026 CAD hits a 14-month low, pressured from both sides simultaneously. USD leg: 13-month high post-hawkish FOMC. CAD leg: oil broke below $70 and the pre-war 71.11 support. When both legs tilt the same way, this is the strongest bullish configuration. BoC Macklem today: not seeing spillovers from higher oil prices into CPI. Implicitly dovish, BoC in no hurry to hike. Canada benchmark yields slipping. CAD at a 14-month low as tech selloff drives safe-haven into USD. AUDUSD at 0.691, broad commodity FX weakness. CAD weakness is not idiosyncratic. D1 structure: wave (3) impulse running. Target 1.4447 then 1.4540. Support 1.4100 then 1.3993. Invalidation: below 1.3476. Three scenarios: → Wave (3) continues to 1.4447 then 1.4540. Probability: 45% → Sub-wave 4 correction to 1.40 then resumes. Probability: 25% → Oil bounces + dovish Fed, drops to 1.39. Probability: 15% The tell: both legs tilting simultaneously. DXY strongest in 13 months, CAD weakest in 14. Not a coincidence. A double squeeze. Conviction: High Bull (upgraded from Med-High). --- Intermarket Edge | Institutional Macro & Intermarket Analysis For informational purposes only. Not financial advice.

USDCAD - Wave (3) Impulse on Post-FOMC Dollar Strength, CAD at a 7-Month Low, a Wave (4) Pullback Sets Up the Wave (5) Push Toward 1.45

USDCAD - Wave (3) Impulse on Post-FOMC Dollar Strength, CAD at a 7-Month Low, a Wave (4) Pullback Sets Up the Wave (5) Push Toward 1.45

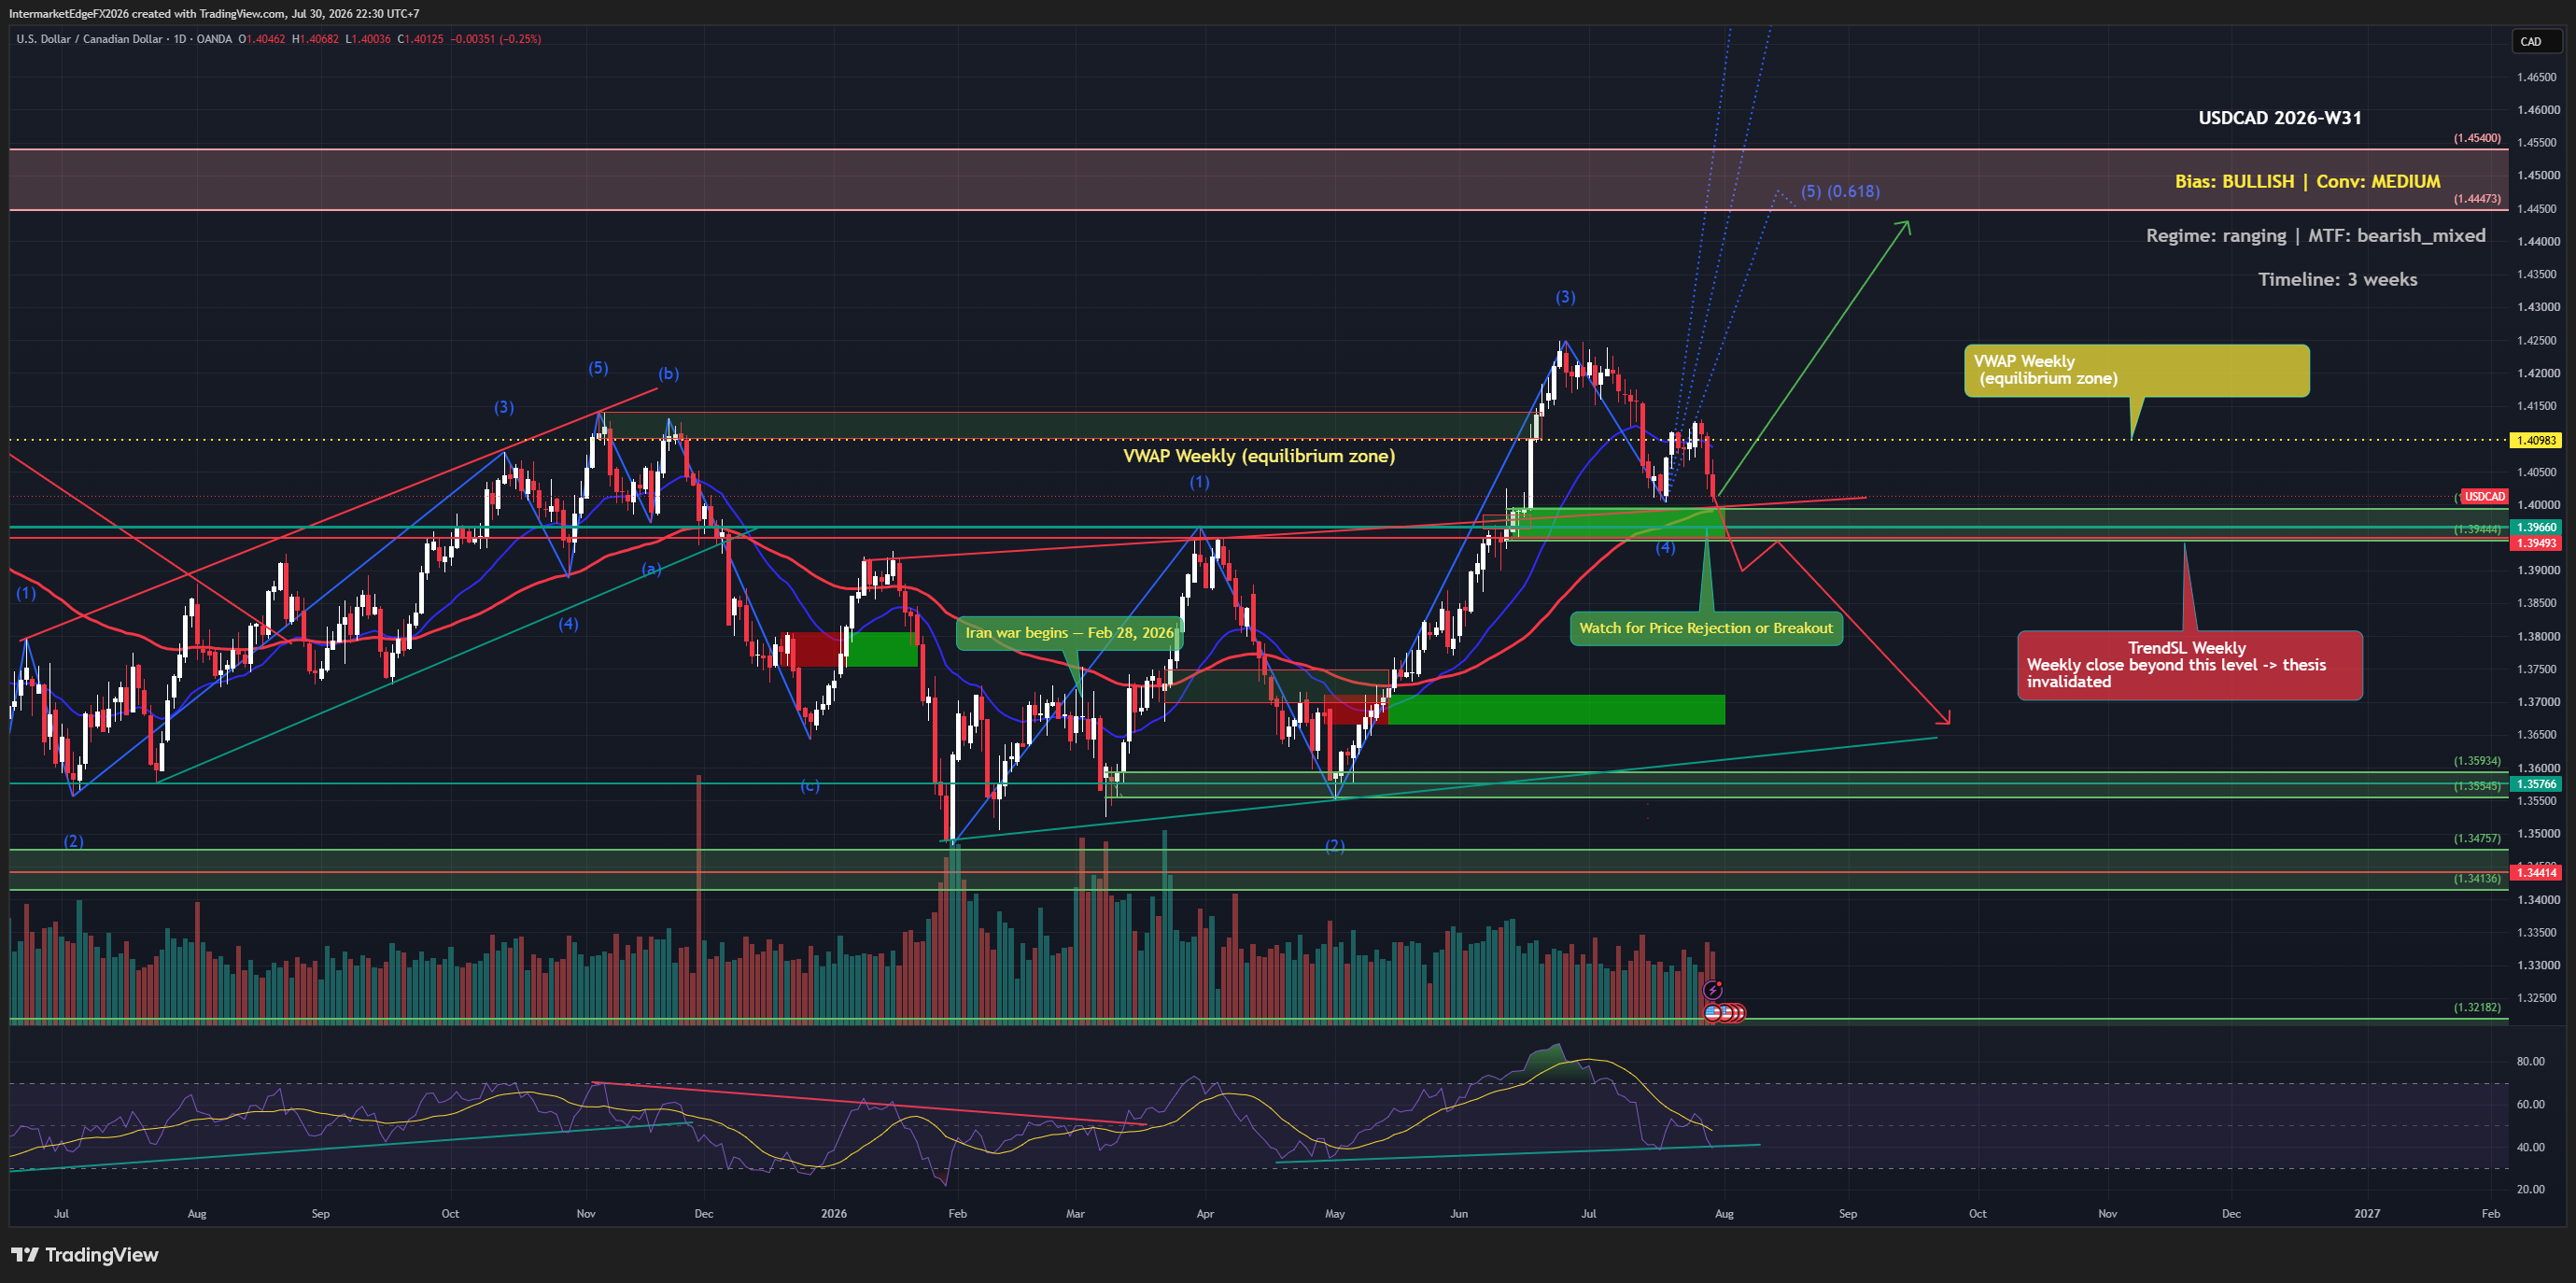
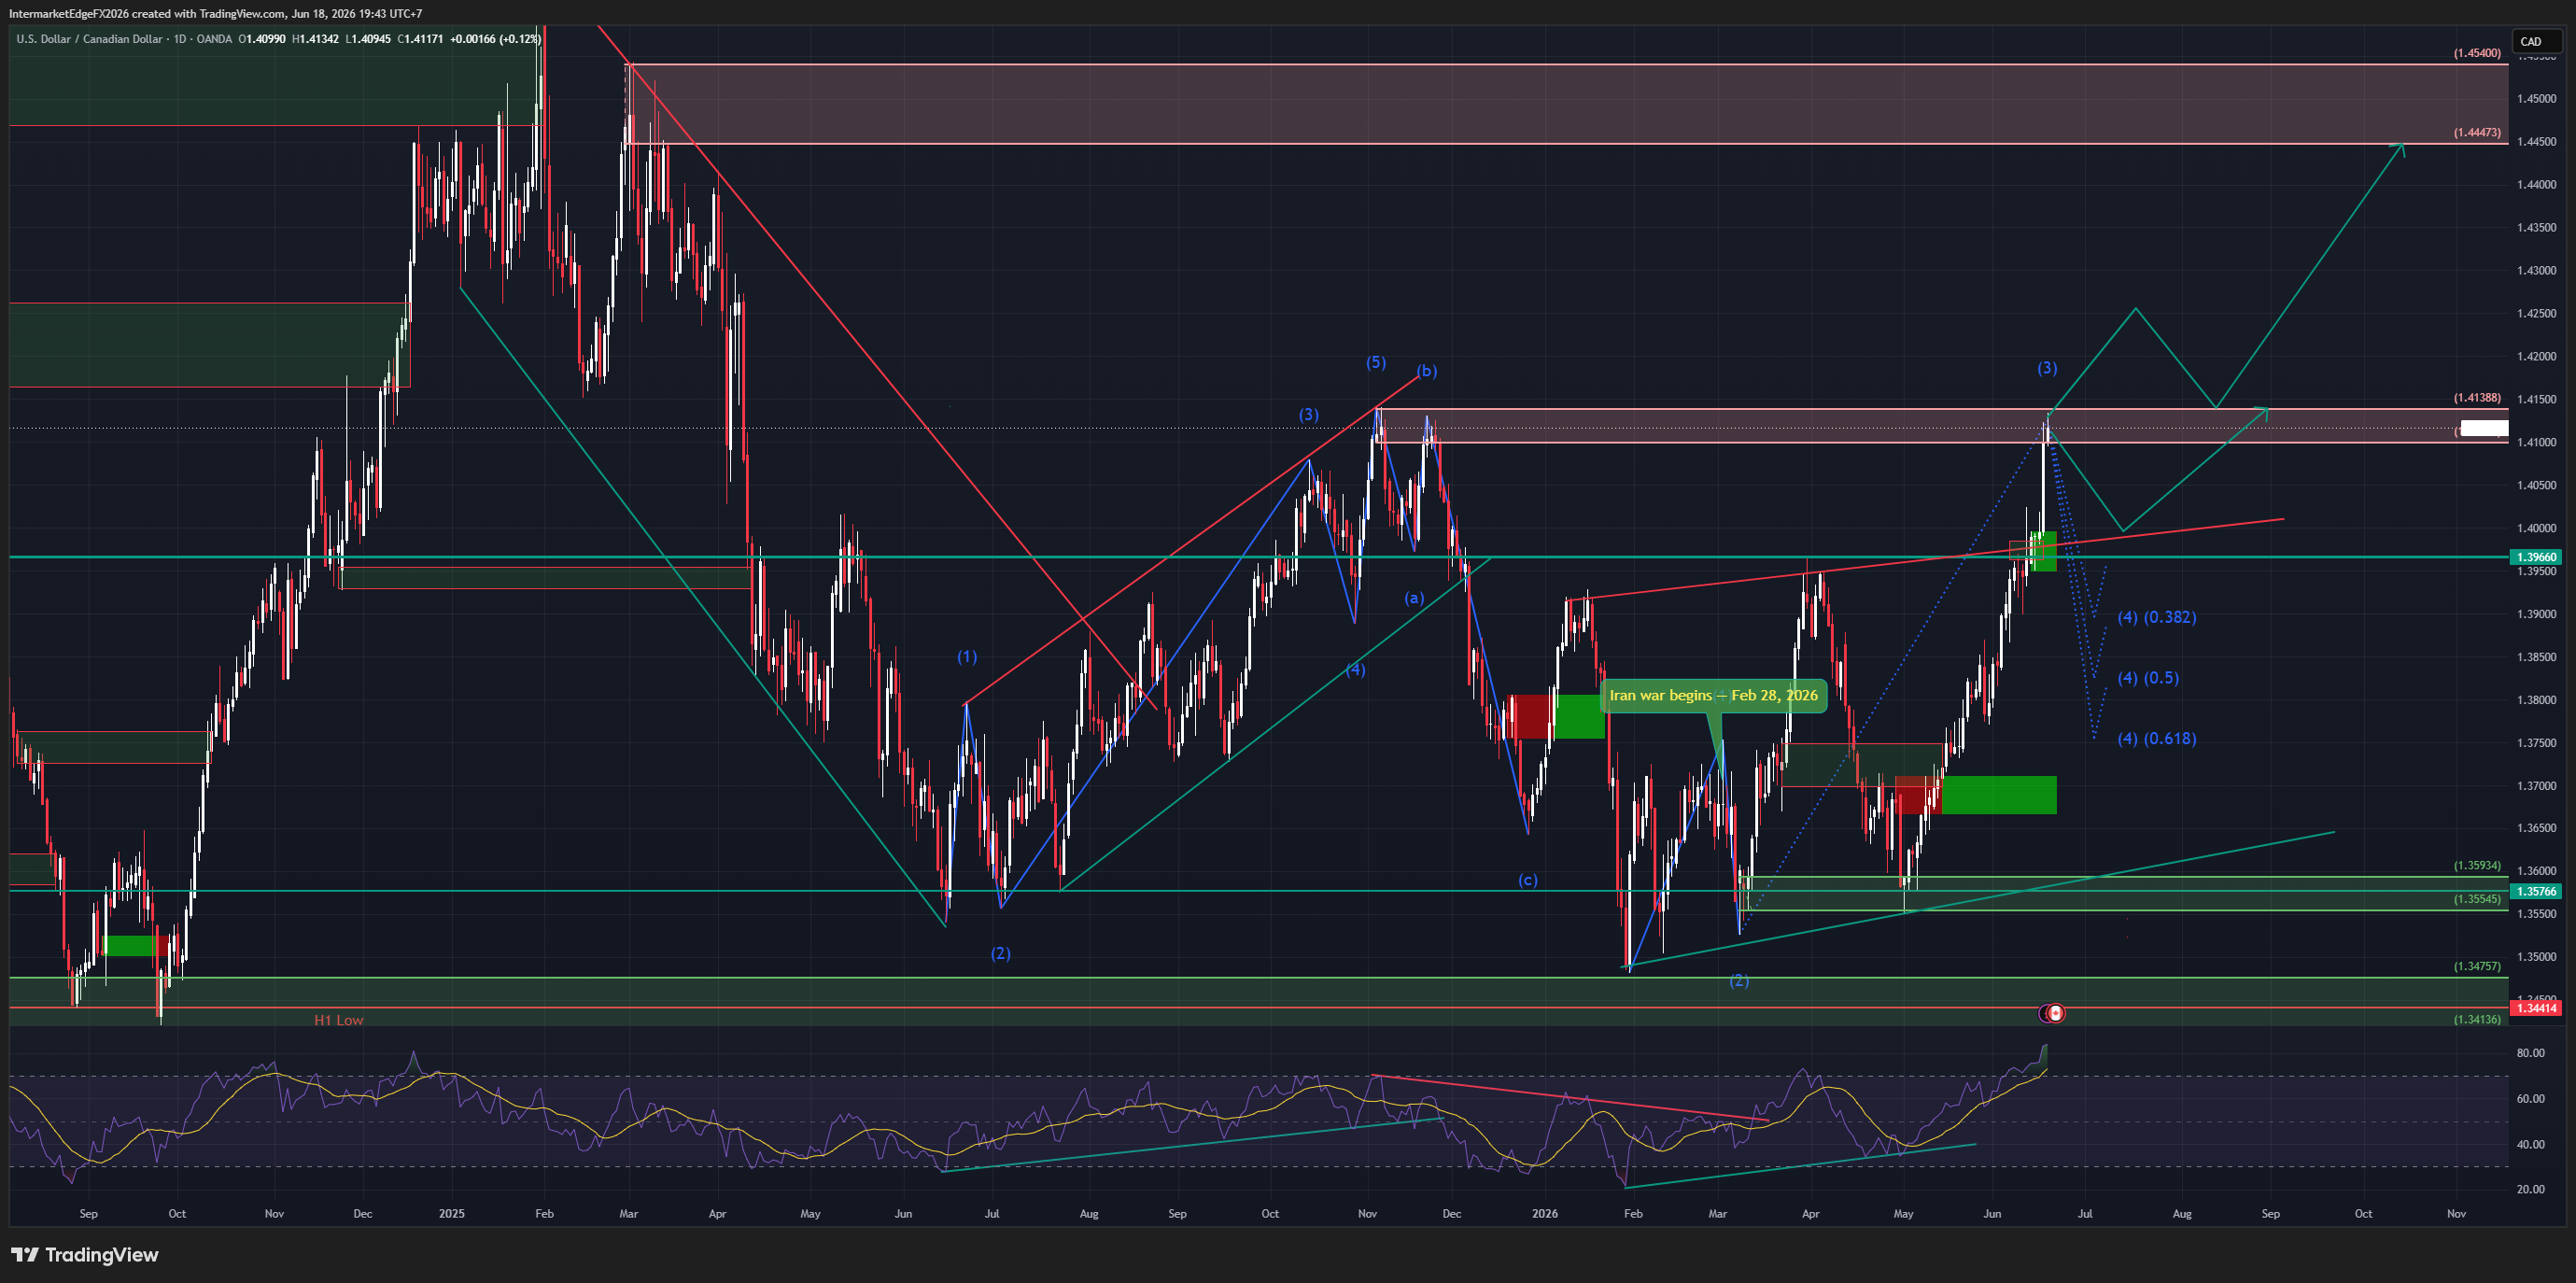
USDCAD 1.4115 | Wave (3) impulse on post-FOMC dollar strength | 18 June 2026 Two currencies moving in opposite directions met in one pair: the Fed projected a hike, and the Canadian dollar hit a 7-month low. The wave count says the big move hasn't started yet. USD leg: the FOMC on 17/06 held rates but projected a hike later in 2026 -- a hawkish dot plot. The dollar extended gains, DXY to a two-month high near 100.6. EUR/GBP/AUD all falling, confirming broad USD strength. CAD leg: the Canadian dollar at a 7-month low (newsfeed: "Canadian Dollar Hits 7-Month Low"). Crude ticked up to 74.46 but stays low after the war premium unwound -- pressure on CAD. The pipeline showed you the wrong numbers. Fed pipeline: "Hold 2026, hike Apr 2027." Actual: hold + projected hike later 2026 (hawkish, done). Pipeline CPI US 2.4%. Actual 4.2%, real yield 0.263%. D1 structure: a bullish Elliott impulse. (1) ~1.38, (2) ~1.347, (3) now ~1.414. Price at 1.4115, just below the 1.41388 resistance. The chart expects a wave (4) pullback to the fib region 1.39 (0.382) / 1.385 (0.5) / 1.378 (0.618), pivot 1.39660. Then wave (5) up to 1.44473 → 1.45400. Three scenarios: → Wave (4) to 1.39-1.385 then wave (5) up to 1.44473. Probability: 40% → Direct break above 1.41388 toward 1.44473, shallow pullback. Probability: 25% → Deeper wave (4) to 1.378 then resume up. Probability: 20% Invalidation: daily close below 1.347 (early warning: a break of 1.378). The tell: the wave (4) pullback. A hold above 1.378 with the dollar firm keeps the path to 1.45 alive. Position around the 1.39-1.385 fib region rather than chasing at the top. Conviction: Medium-High Bull. --- Intermarket Edge | Institutional Macro & Intermarket Analysis For informational purposes only. Not financial advice.

USDCAD — BoC Fifth Consecutive Hold, Macklem Admits Stagflationary Dilemma, and Oil Rising Is No Longer Bullish for CAD

USDCAD — BoC Fifth Consecutive Hold, Macklem Admits Stagflationary Dilemma, and Oil Rising Is No Longer Bullish for CAD

USDCAD 1.3984 | Oil rising, CAD weakening | 11 June 2026 Oil rose $2.50 today on Iran-Hormuz news. The Canadian dollar weakened. The oil-CAD channel has inverted — and understanding why is the entire analytical framework for this pair right now. The current oil spike is geopolitical risk premium, not demand-driven. Geopolitical oil creates safe-haven dollar demand simultaneously. The dollar safe-haven channel is dominant. Standard oil-CAD heuristic = systematically wrong in this regime. BoC held for the fifth consecutive time at 2.25% on June 10. The language change matters more than the decision. April: "changes can be expected to be small." June: "economic weakness combined with rising inflation is a dilemma." Macklem also explicitly opened the cut door: "we may need to cut further if US trade restrictions intensify." Most dovish BoC forward guidance since the current hold cycle began. Result: BoC in stagflationary paralysis. Fed pricing a hike at 40%. Forward curves diverging further. BoC-Fed differential structural, not just cyclical. AUDCAD at 0.9773 — below 1.000 for 21 consecutive sessions. USMCA discount: structural and persistent. Bull confirmation: daily close above 1.4099. Targets: 1.4099 → 1.4139 → 1.4200. Invalidation: Iran MOU approved. Warsh FOMC June 16-17 is the gating event. Conviction: Medium-High Bull.

USDCAD — Canadian Dollar at Eight-Week Low, BoC Holds June 10, Oil Slides, and USMCA Risk Keeps the Loonie Trapped

USDCAD — Canadian Dollar at Eight-Week Low, BoC Holds June 10, Oil Slides, and USMCA Risk Keeps the Loonie Trapped

USDCAD 1.3893 | Canadian Dollar 8-week low | 04 June 2026 The Canadian dollar is at its weakest in eight weeks, and three forces are keeping it there simultaneously. First, oil. WTI has declined from $95.33 this morning to $92.61 — a $2.72 drop in a single session on Iran deal optimism. Canada is the largest crude exporter to the US. The oil-CAD channel is among the most stable relationships in FX, and it is working against the loonie today. The counterintuitive implication: if the Iran deal completes and oil falls toward $80-85, CAD gets weaker, not stronger. USDCAD could test 1.4099 resistance on deal completion. Second, domestic weakness. Canada's Q1 2026 GDP contracted for a second consecutive quarter. BoC core inflation measures slowed to five-year lows. The Bank of Canada meets June 10 and is expected to hold at 3.25% — but a dovish tone acknowledging the growth weakness would push USDCAD toward 1.4000-1.4050. Third, USMCA risk. AUDCAD at 0.9920 — below the 1.000 parity level — confirms the structural CAD discount from trade uncertainty is still live. Until AUDCAD holds above 1.000, CAD carries a structural discount that cannot be removed by oil alone. On the chart, price is approaching the 1.4099-1.4139 resistance zone. A daily close above 1.4099 confirms the bull move. A daily close below 1.3593 activates wave (c) lower toward 1.3477 then 1.3400. BoC June 10 is the gating event. Conviction: Medium, Mildly Bullish.

InterMarketEdge

© 2026 InterMarketEdge. Financial intelligence for inter-market traders.