Tag: DXY — InterMarketEdge

Tag: DXY

EURUSD - Price Sits Right Beside the 1.138 Trigger as Iran Geopolitical Risk Keeps VIX Elevated, 1.119-1.120 Target Awaits Confirmation

EURUSD - Price Sits Right Beside the 1.138 Trigger as Iran Geopolitical Risk Keeps VIX Elevated, 1.119-1.120 Target Awaits Confirmation

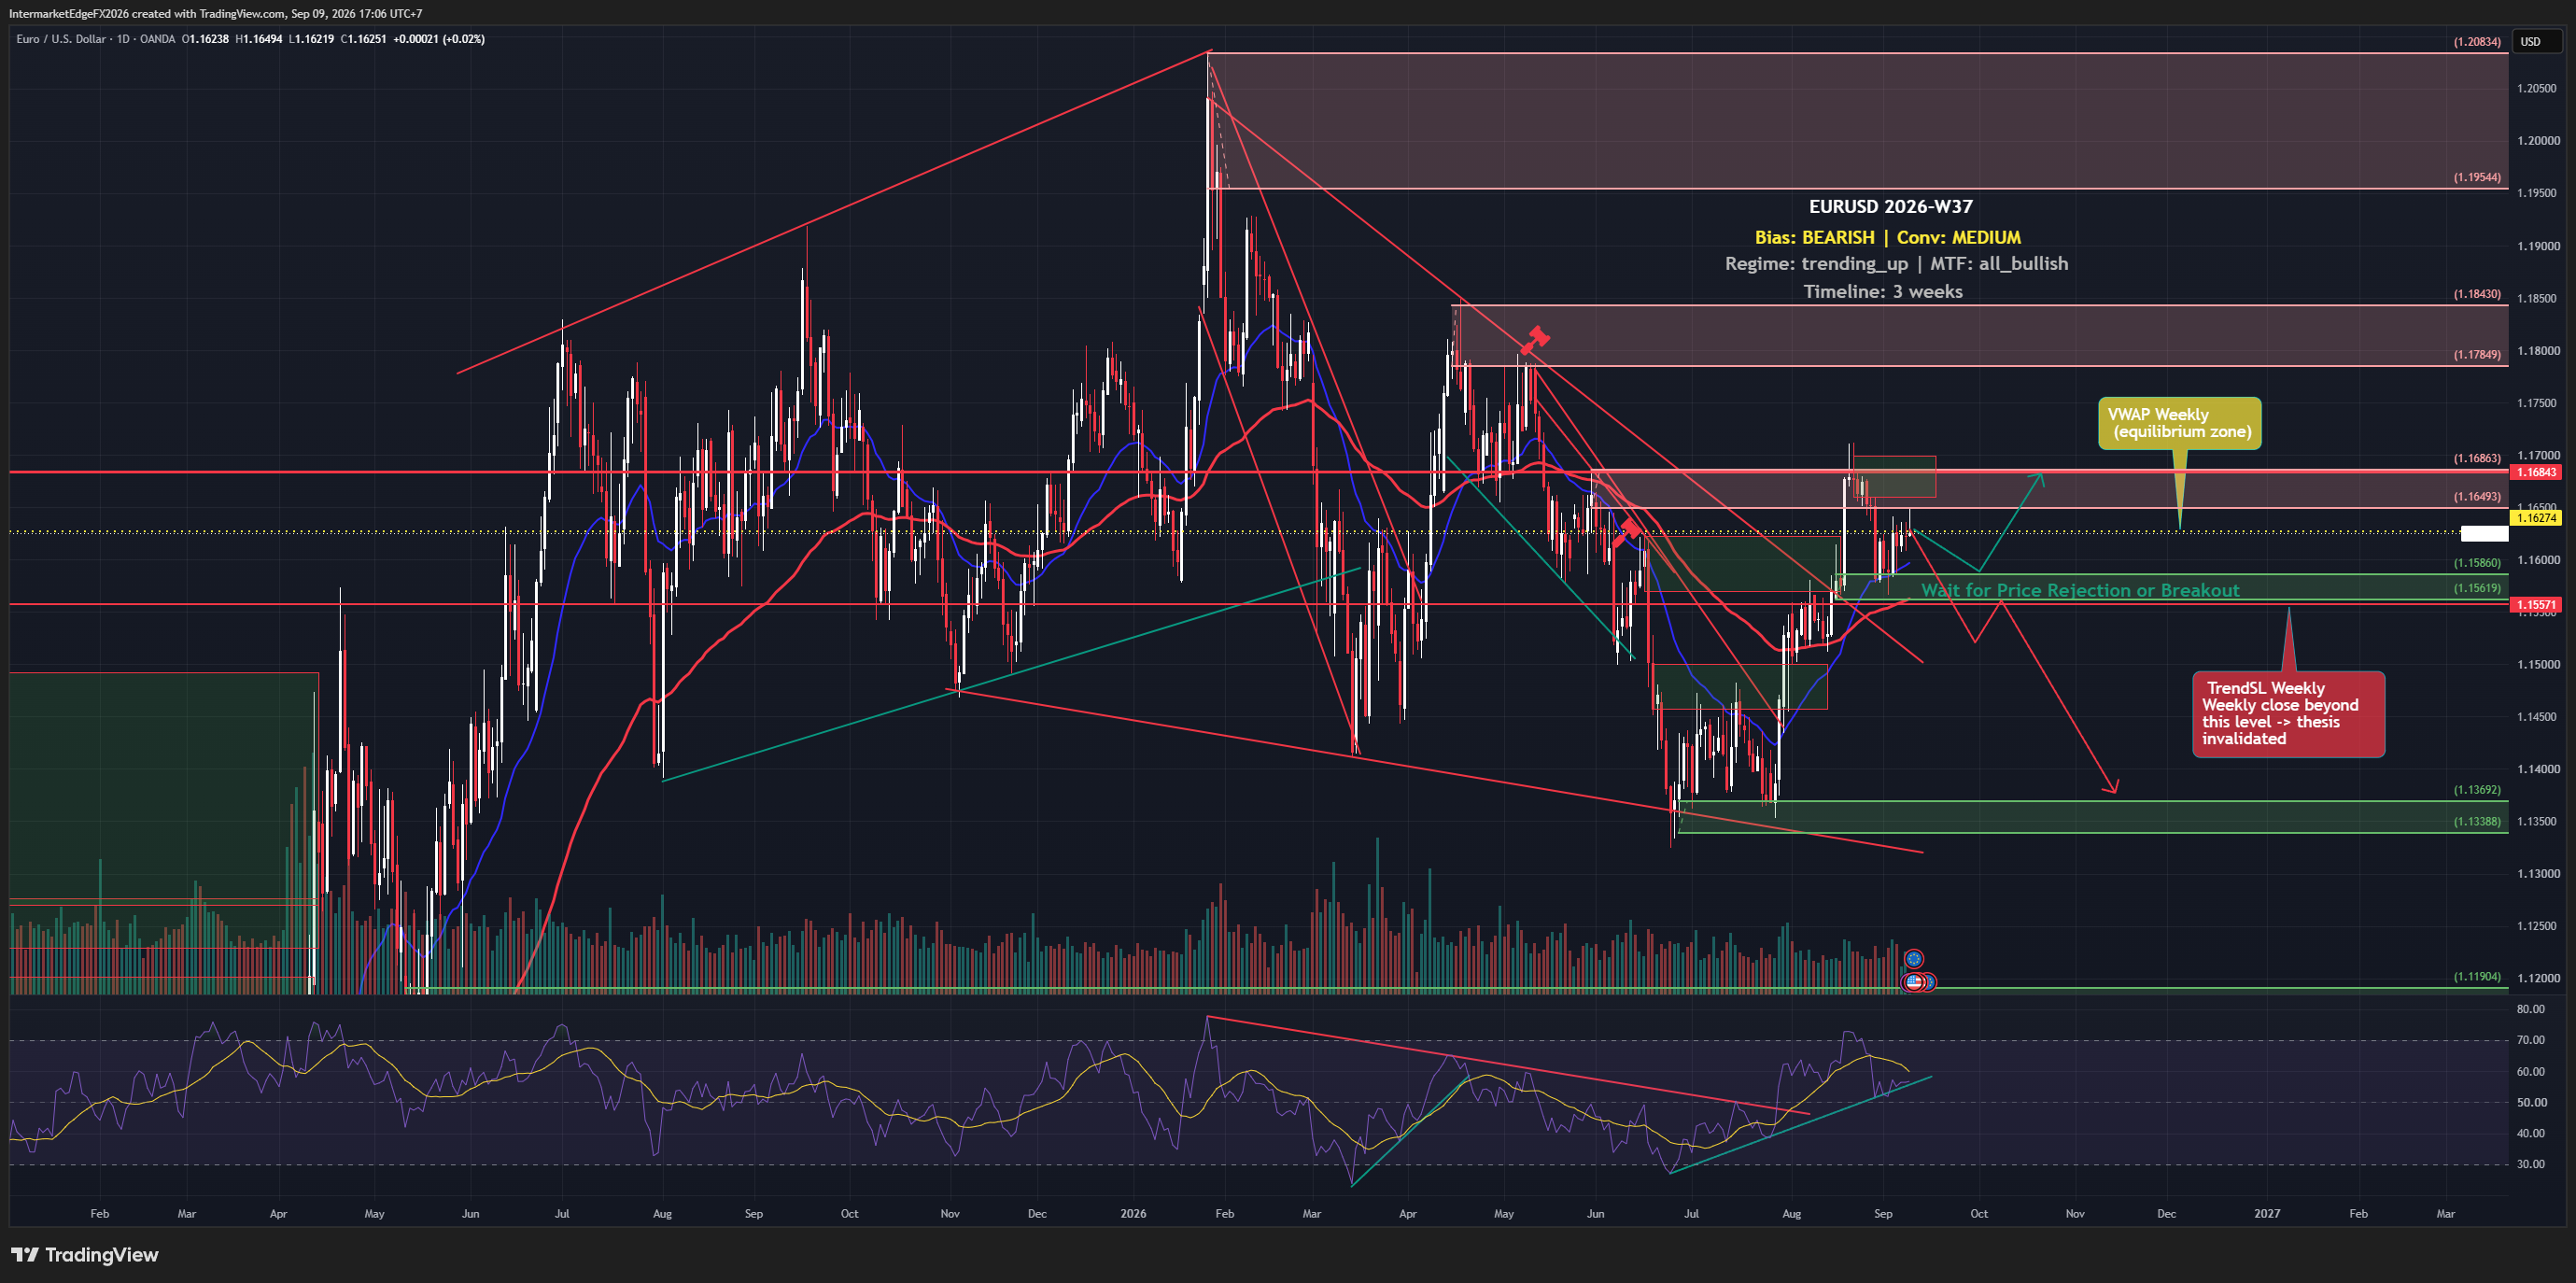
EURUSD - SUMMARY 08/07/2026 Regime: Price sits right at last week's identified 1.138 trigger, High Bear unchanged. Four aligned forces: DE-US spread -1.51%, Fed hawkish post-Warsh FOMC, ECB merely neutral, Iran geopolitical risk pushing VIX to 17.47 and oil sharply higher. Bias: High Bear, one of the highest-conviction theses in the 9-instrument basket. New factor: US-Iran geopolitical risk (full detail in the same-day EURJPY piece) adding energy-cost pressure on Europe. Data corrections: DE10Y 3.05%, DE-US spread -1.51% (not the pipeline's own -1.571%); US CPI 4.2% (not 2.4%). D1 structure: wave (c) in its final wave 5, declining from the wave 4 consolidation (1.155-1.160) to test the Battle Zone 1.138-1.155. A close below 1.138 confirms the move toward 1.119-1.120. Invalidation above 1.157. Scenarios: close below 1.138 toward 1.119-1.120 (45%); range 1.138-1.155 pending confirmation (35%); bounce testing 1.157-1.160 (15%); decisive break above 1.157 invalidating the thesis (5%). Close monitoring needed over the next 24-48 hours given unresolved geopolitical risk. For informational purposes only, not investment advice.

EURGBP - The -1.84% DE-GB Spread Remains the Main Drag, Price Tests a Wave (4) Zone Near 0.8544 Ahead of 0.841-0.846

EURGBP - The -1.84% DE-GB Spread Remains the Main Drag, Price Tests a Wave (4) Zone Near 0.8544 Ahead of 0.841-0.846

EURGBP - SUMMARY 07/07/2026 Regime: The -1.84% DE-GB spread unchanged from last week, still the main drag. Medium Bear (carry). Price tests a local low zone (wave 4) near 0.8540-0.8556 after a long decline from the 0.888 peak. Bias: Medium Bear (carry), unchanged from last week. New factors: sterling posted its best weekly gain in 12 weeks vs the dollar, reportedly easing political risk (details unconfirmed), reinforcing sterling's relative strength vs the euro. ECB's Wunsch made a more hawkish remark than expected but it's individual, not policy. Data corrections: DE10Y 2.96% (not 2.99%); UK10Y 4.80% (not 4.50%); ECB neutral hold 2.00% (not cutting cycle 2.50%). D1 structure: large peak at 0.888, decline breaking 0.874, 0.870, 0.8611, now testing wave (4) at 0.8540-0.8556. Target: 0.841-0.846. Invalidation above 0.870. Scenarios: continued decline toward 0.841-0.846 (45%); range 0.850-0.861 pending confirmation (35%); bounce above 0.861 testing 0.870 (15%); decisive break above 0.870 invalidating thesis (5%). For informational purposes only, not investment advice.

DXY - Price Holds Above 100.98 Despite a Sharp June NFP Miss at Just 57K, Wave (5) Toward 103-104.5 Remains Intact

DXY - Price Holds Above 100.98 Despite a Sharp June NFP Miss at Just 57K, Wave (5) Toward 103-104.5 Remains Intact

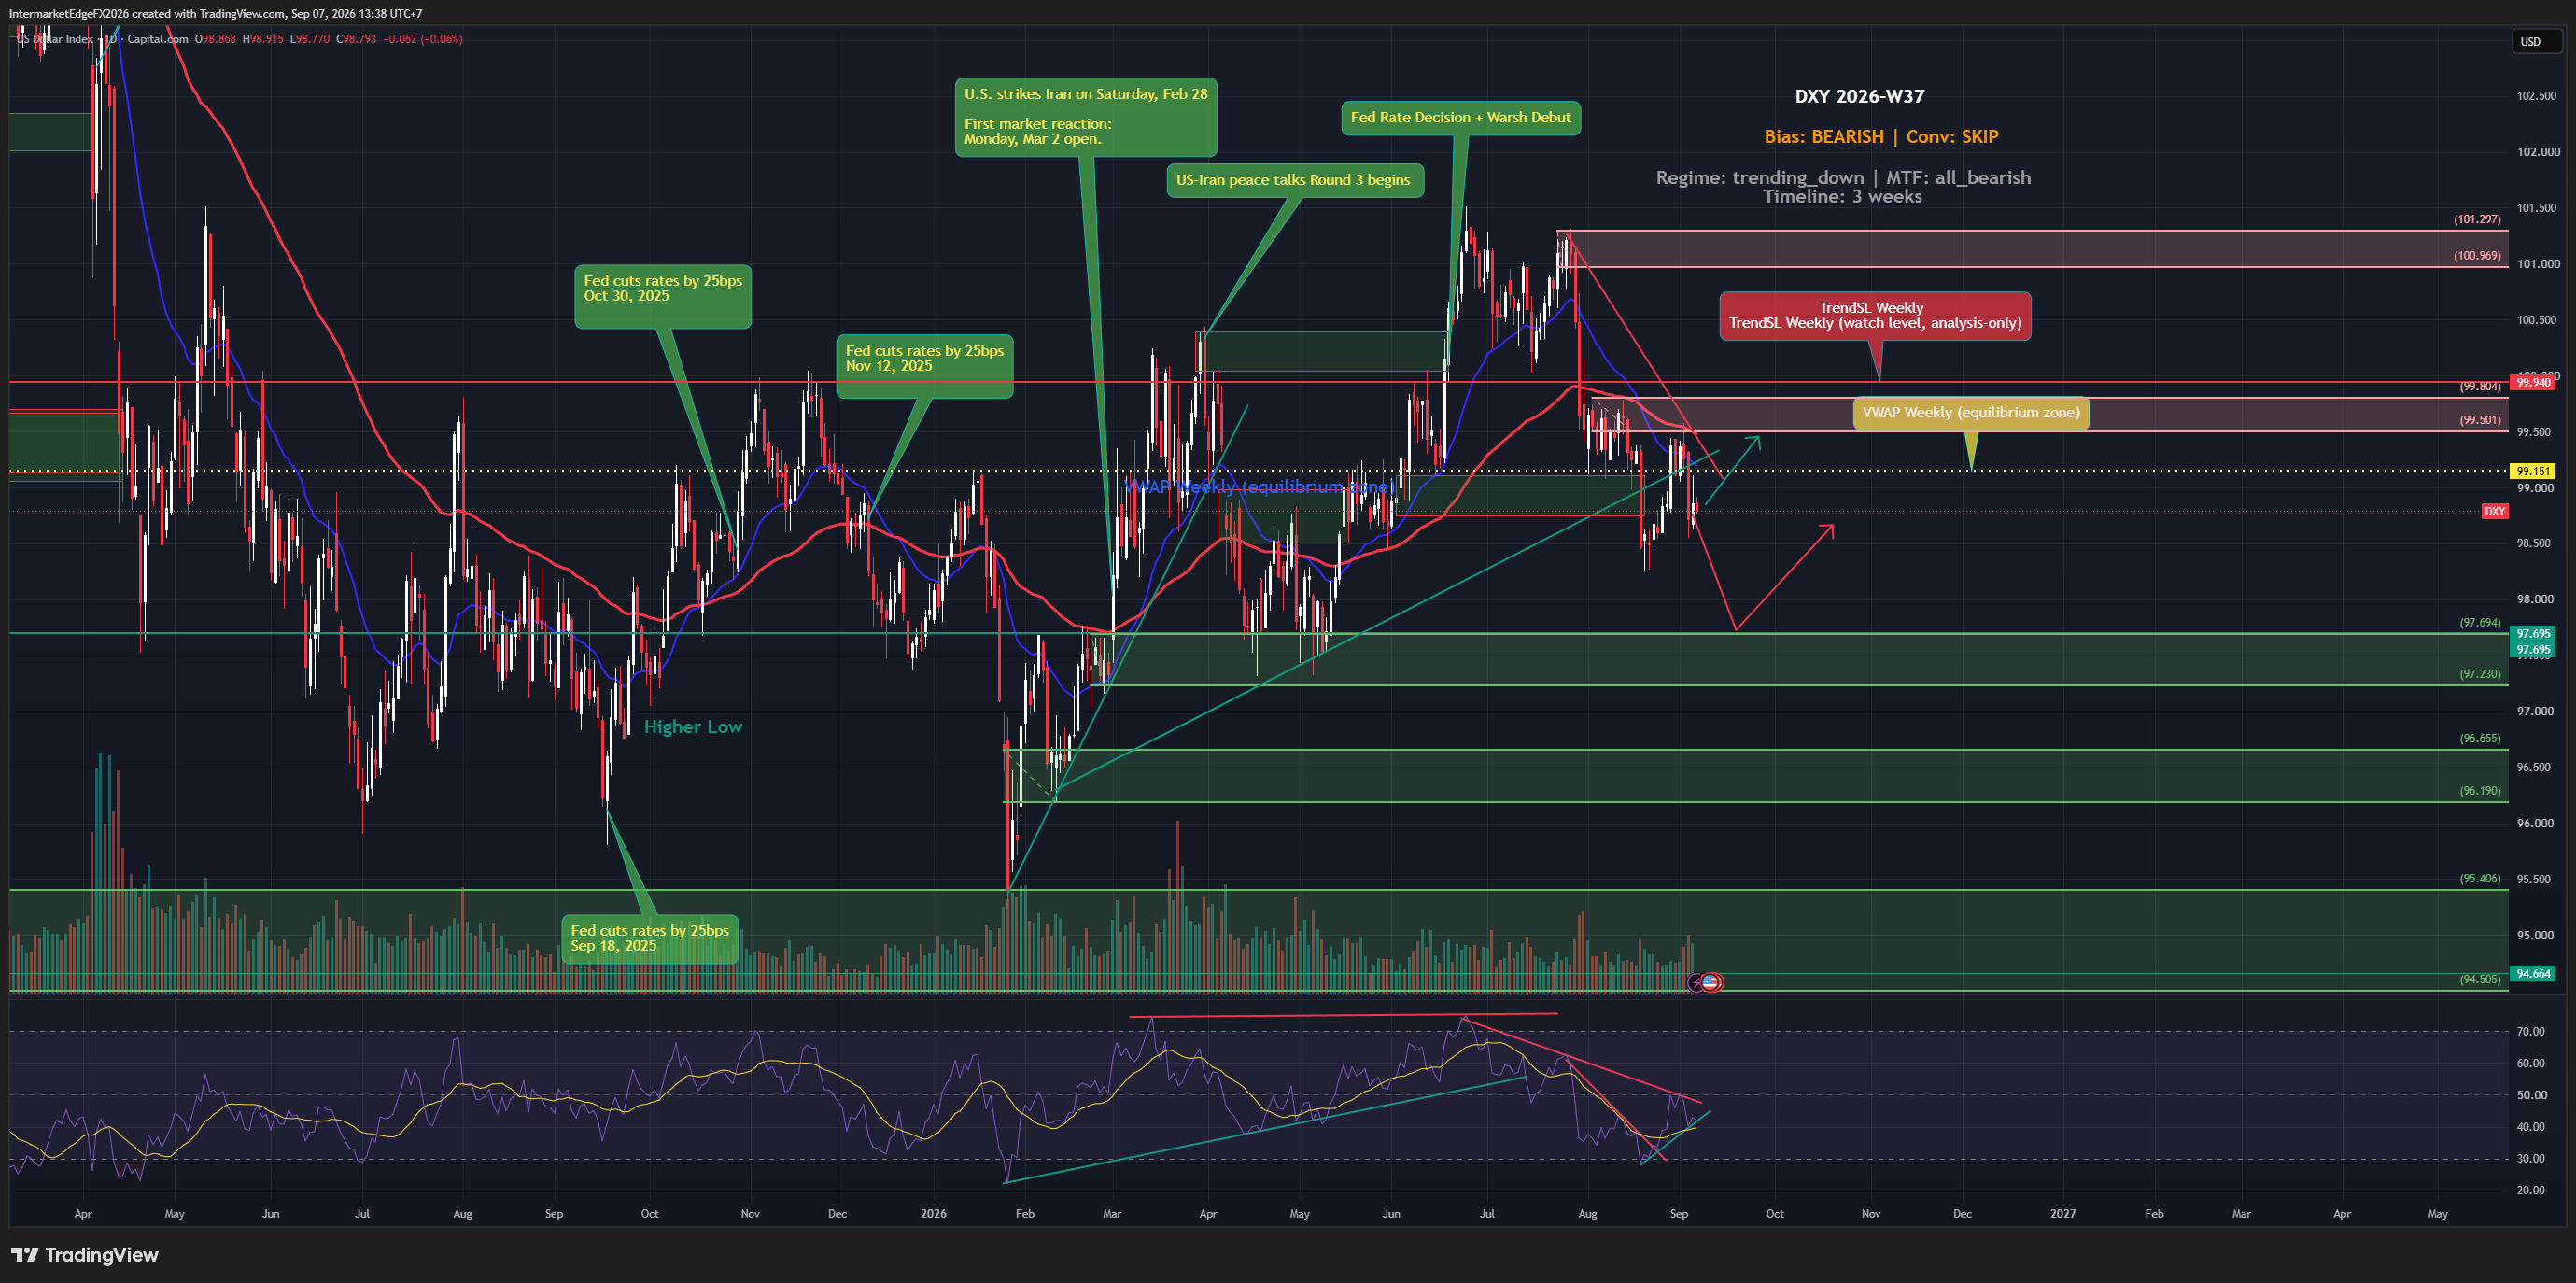
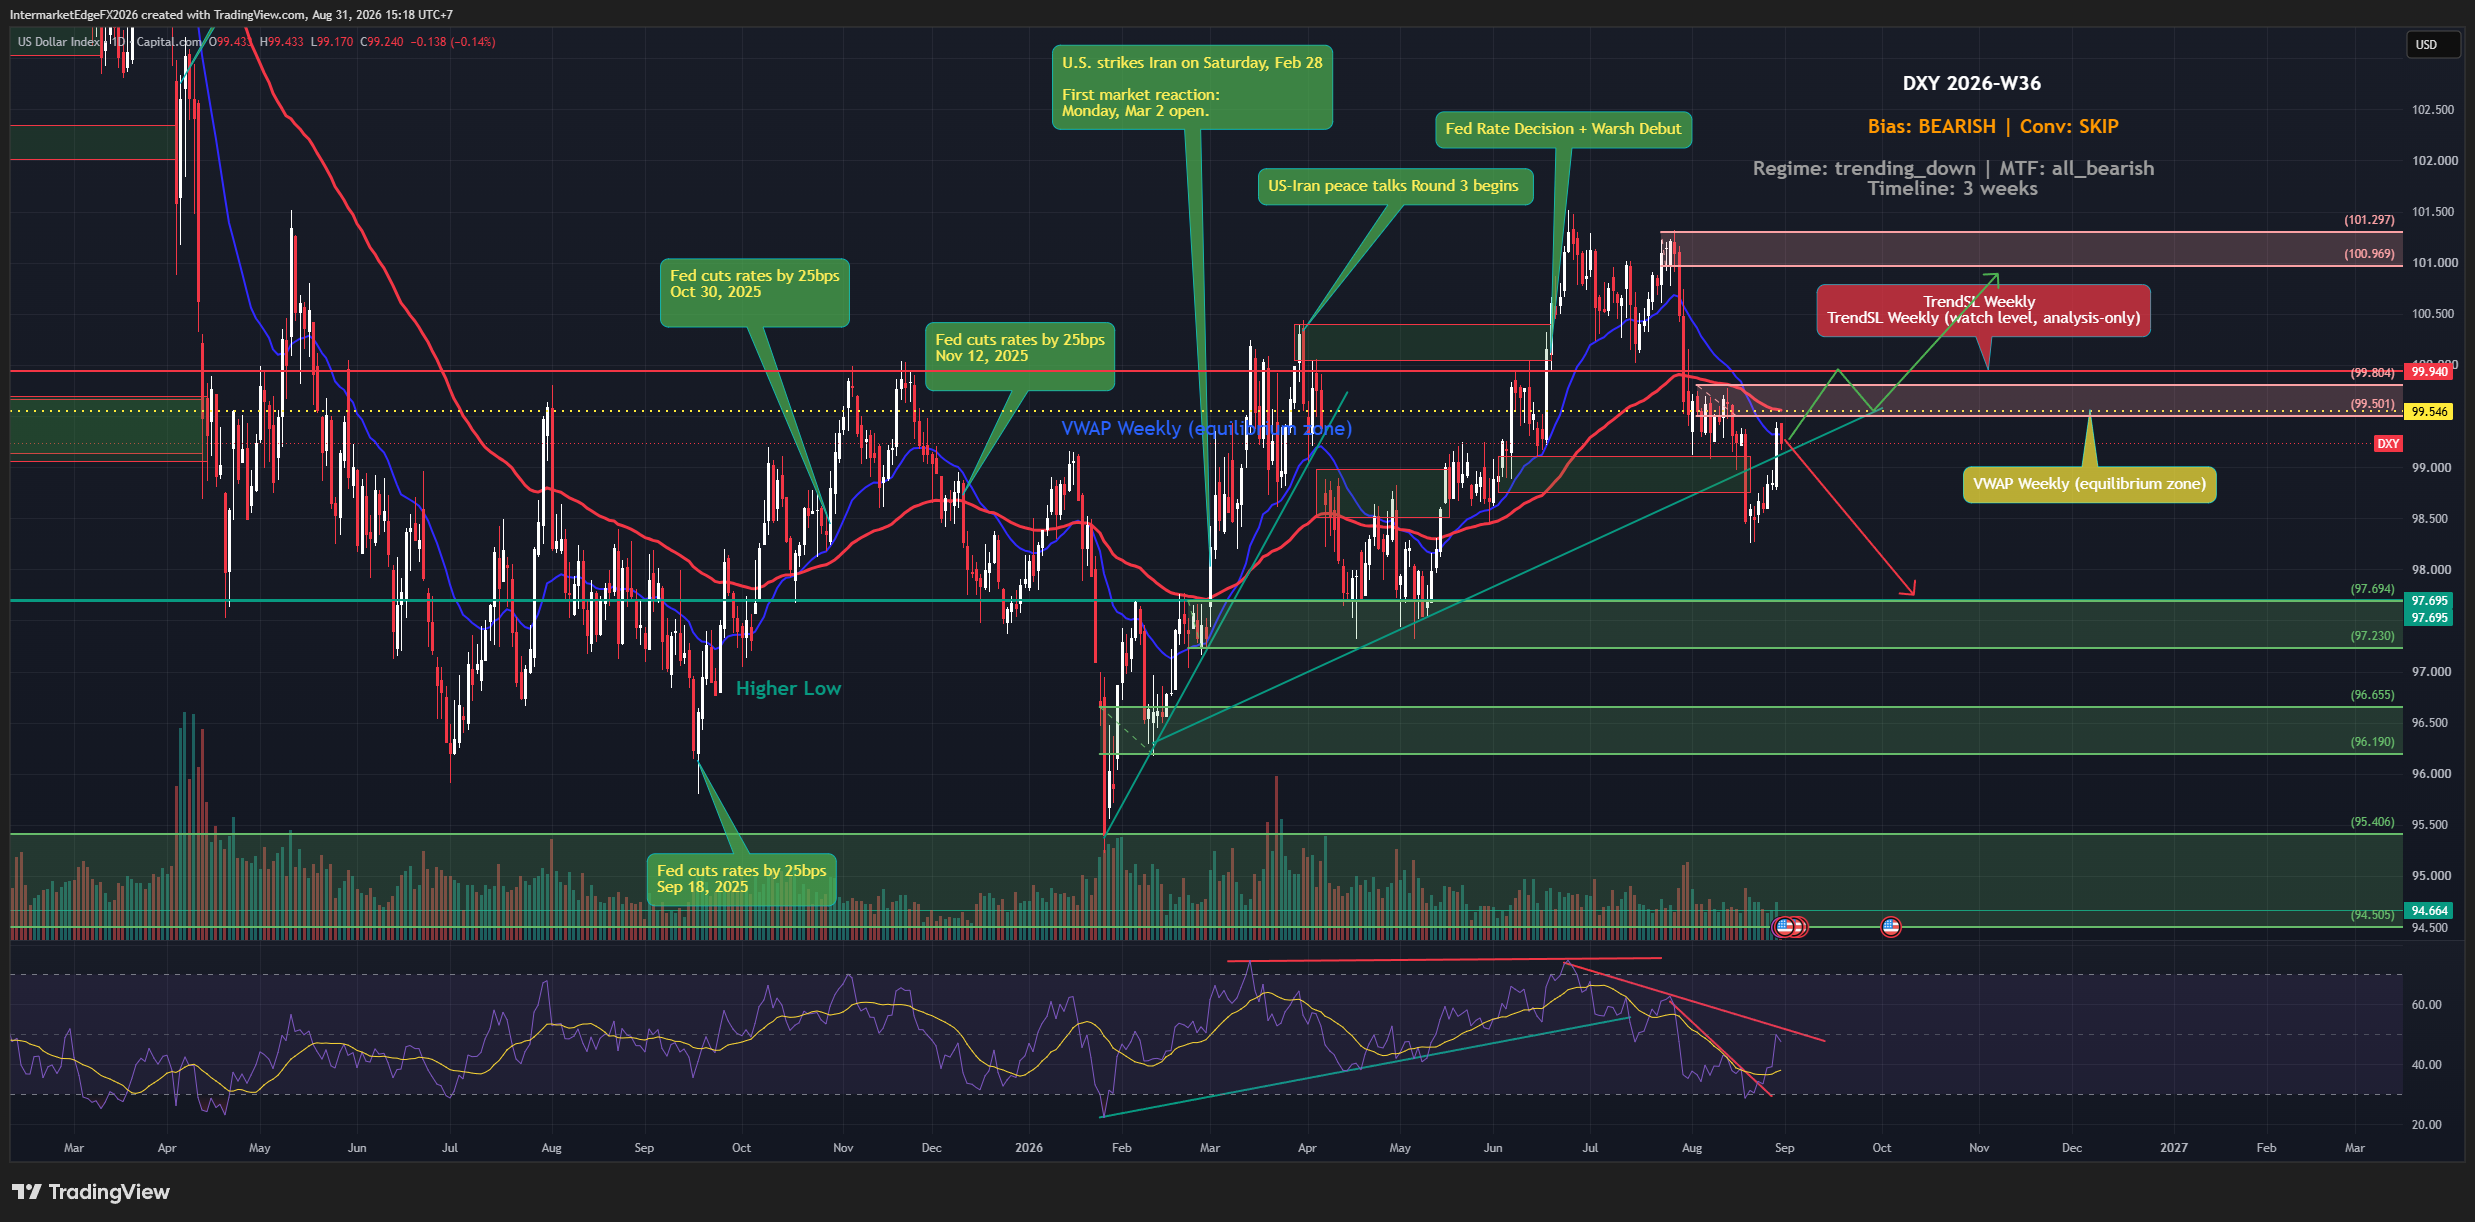
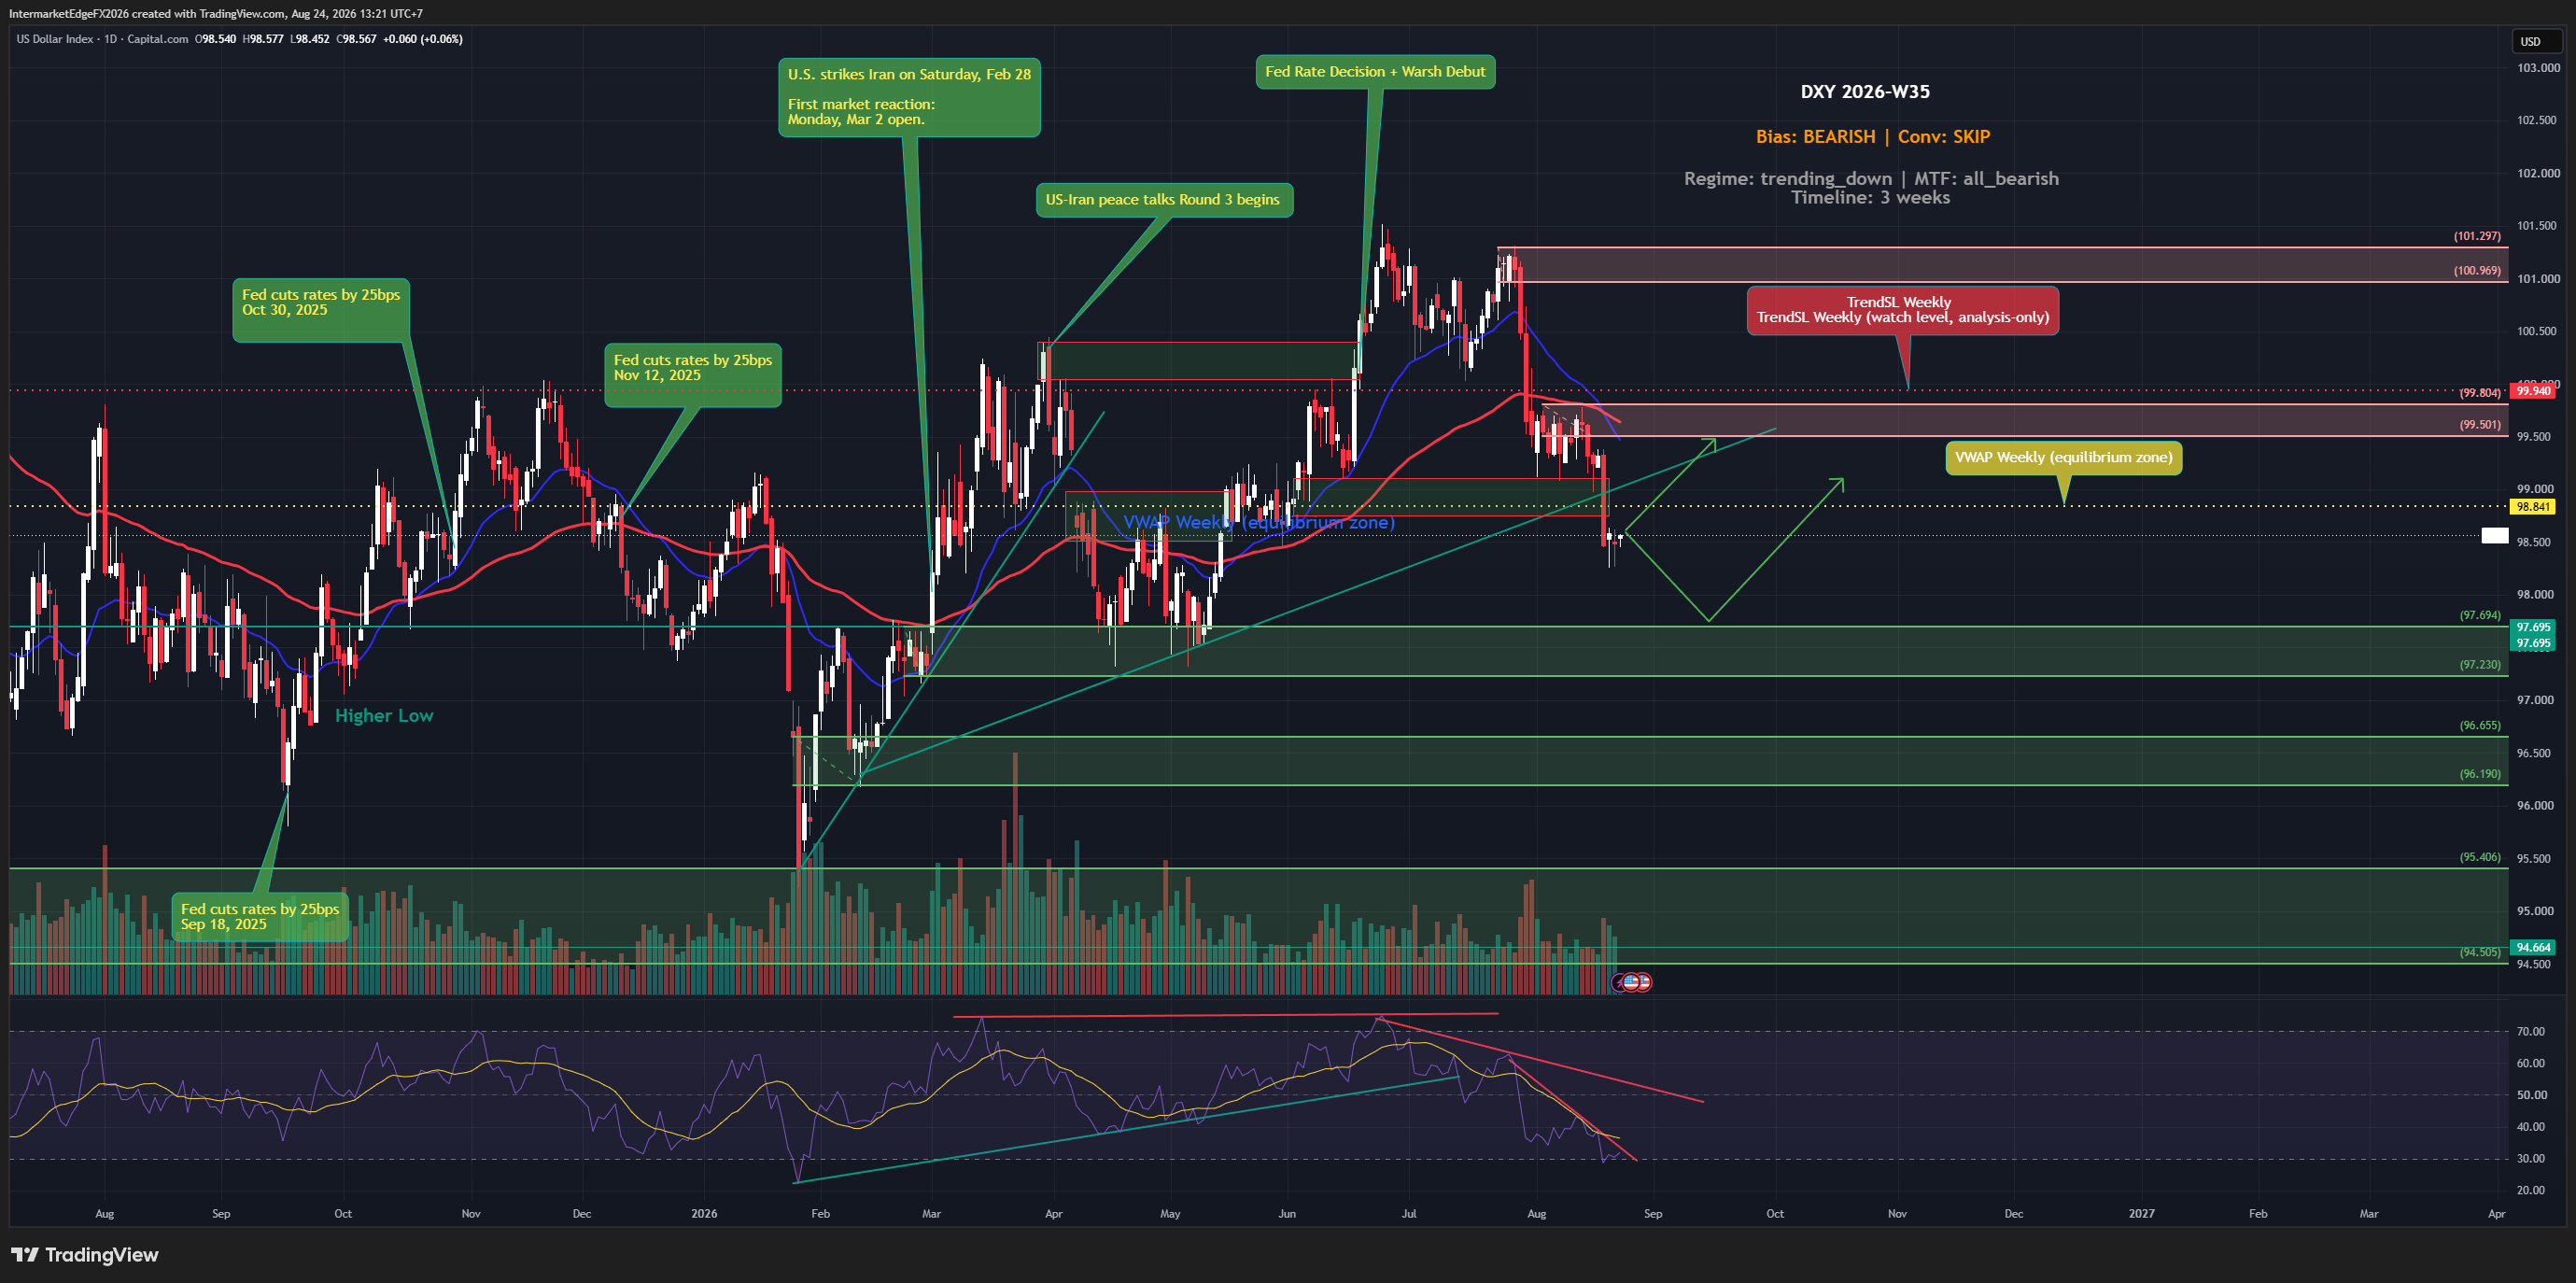
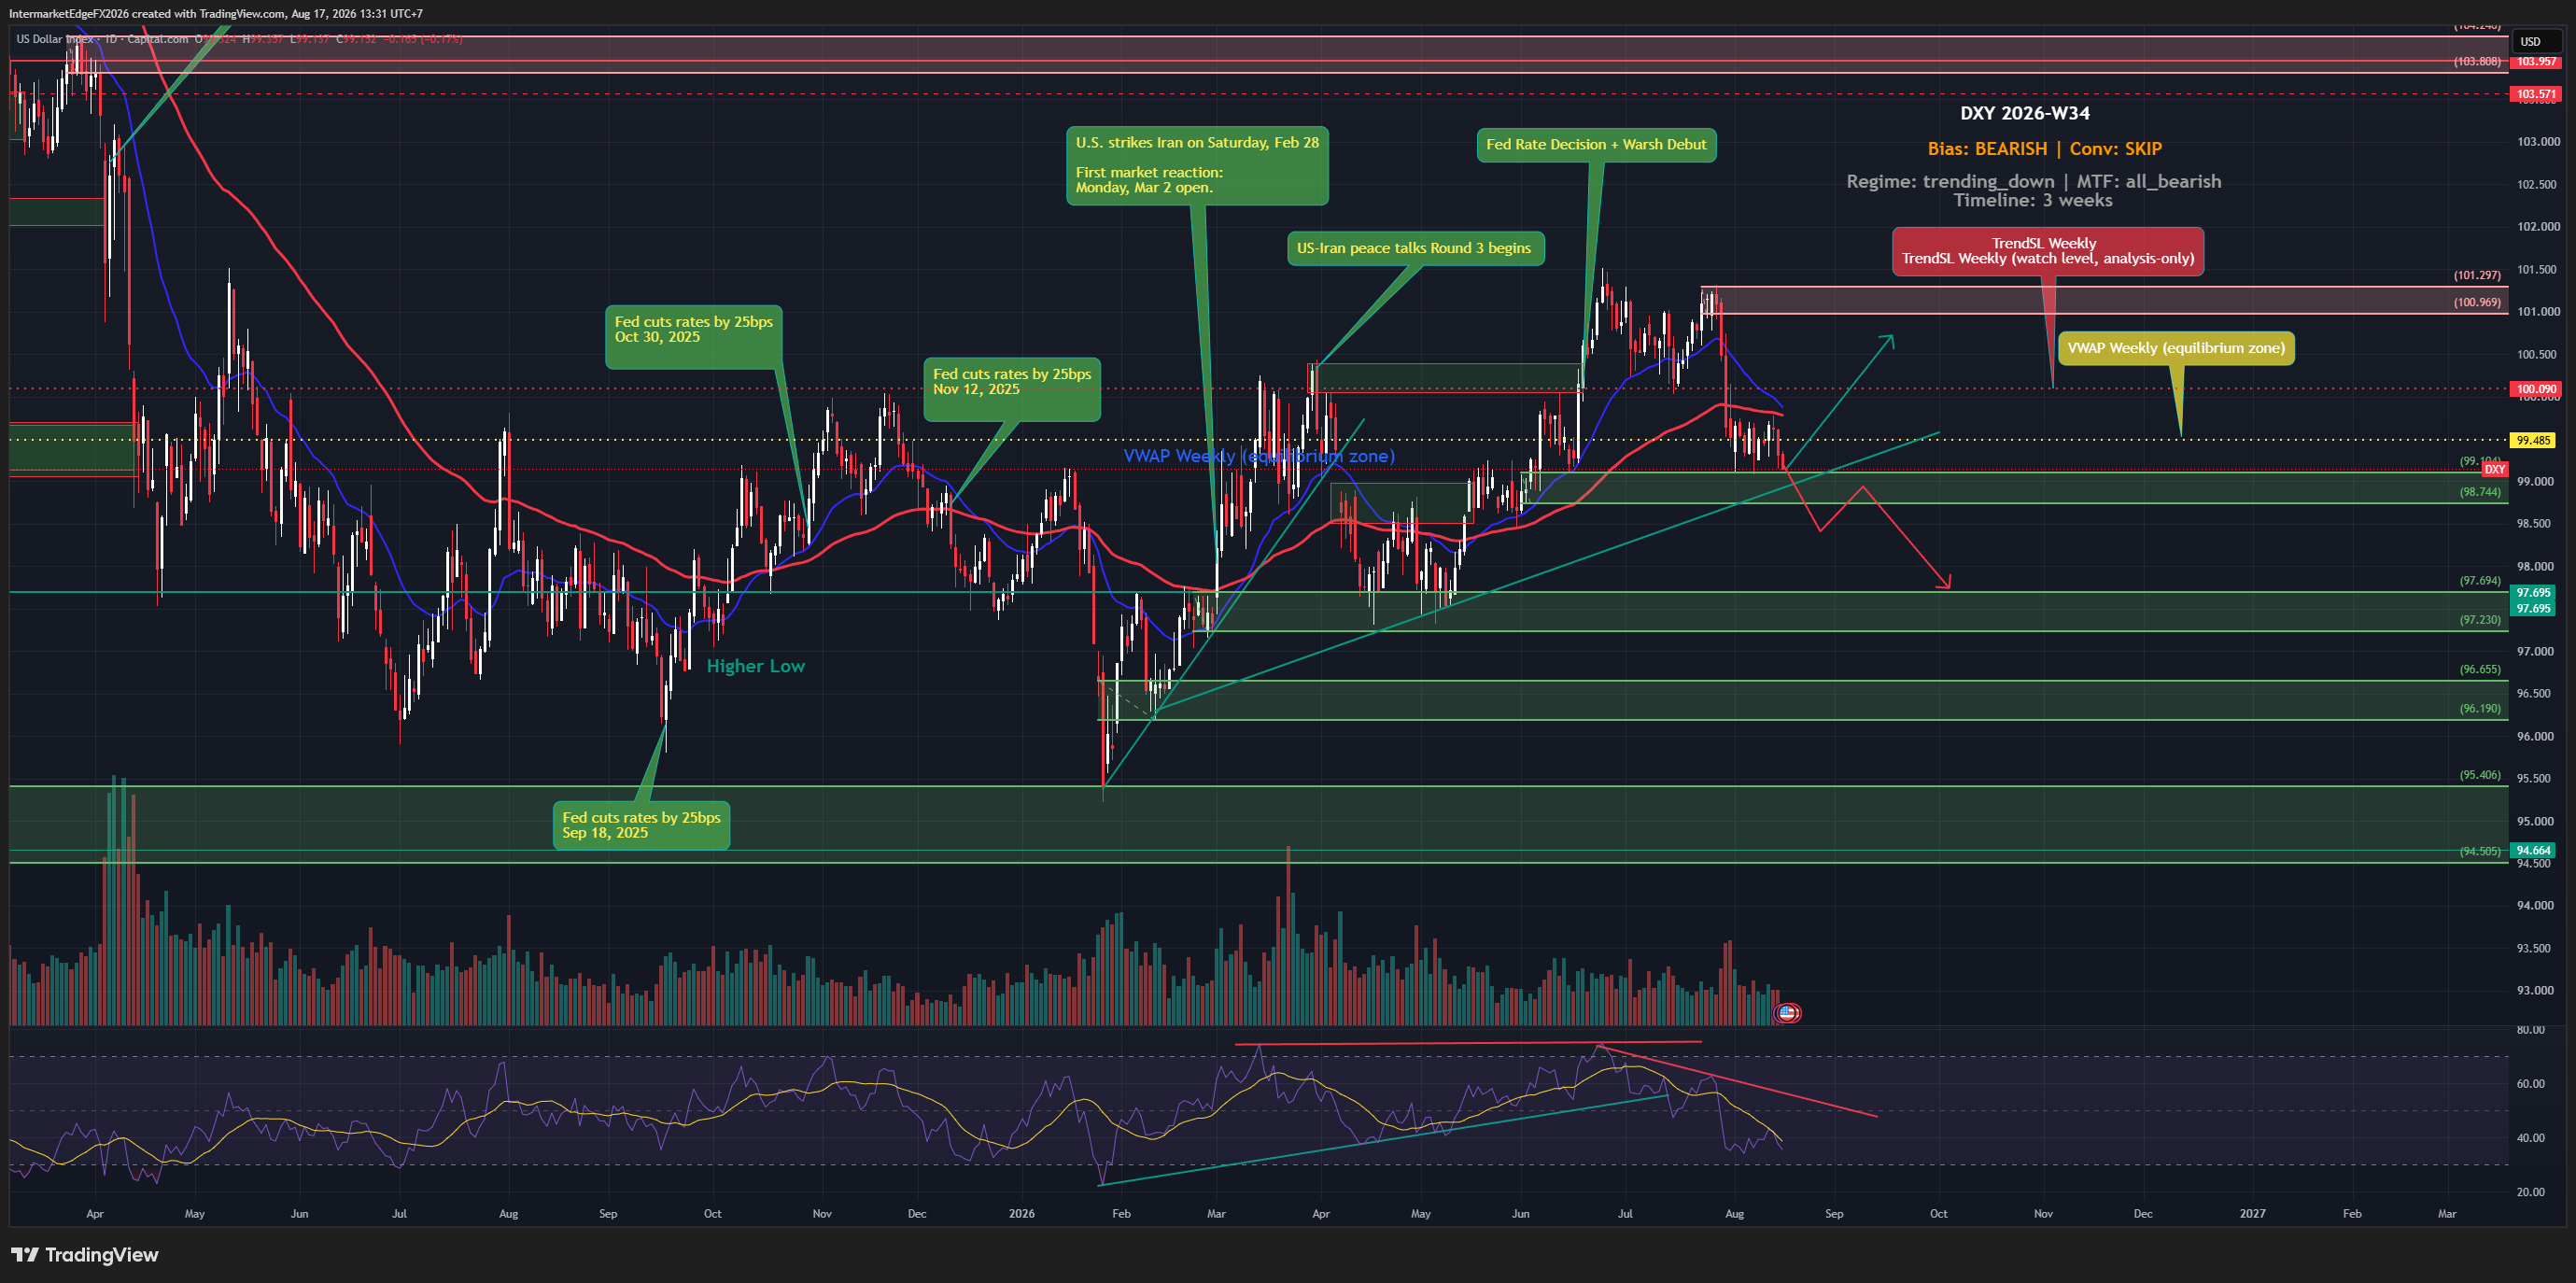
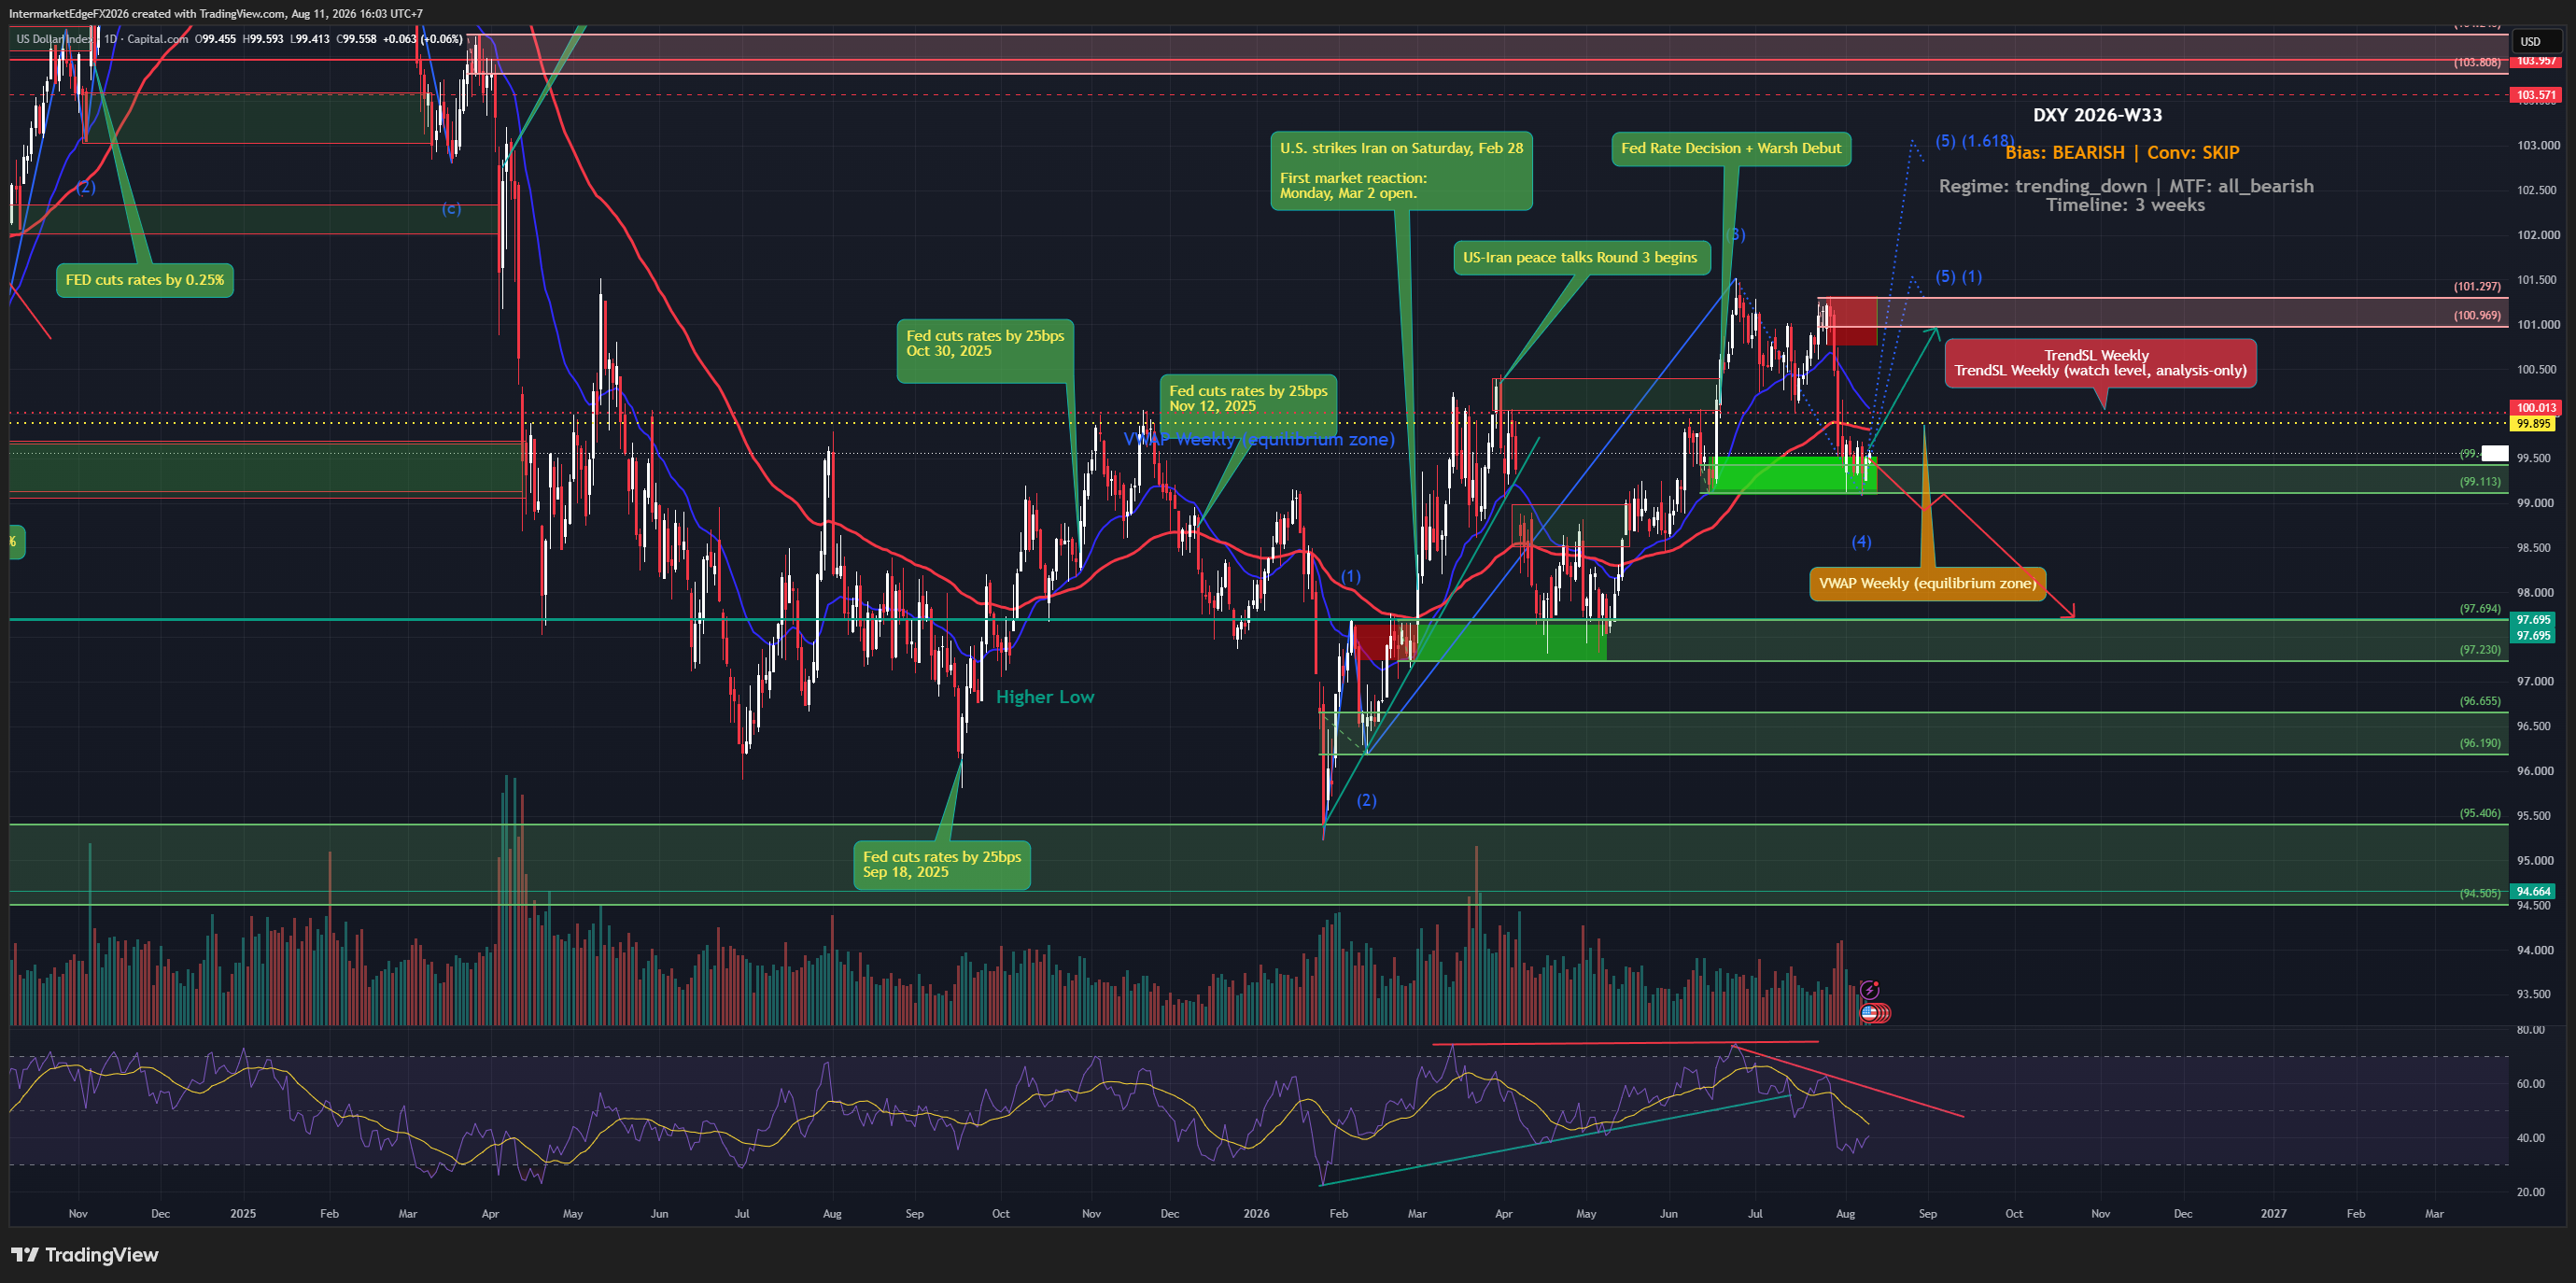
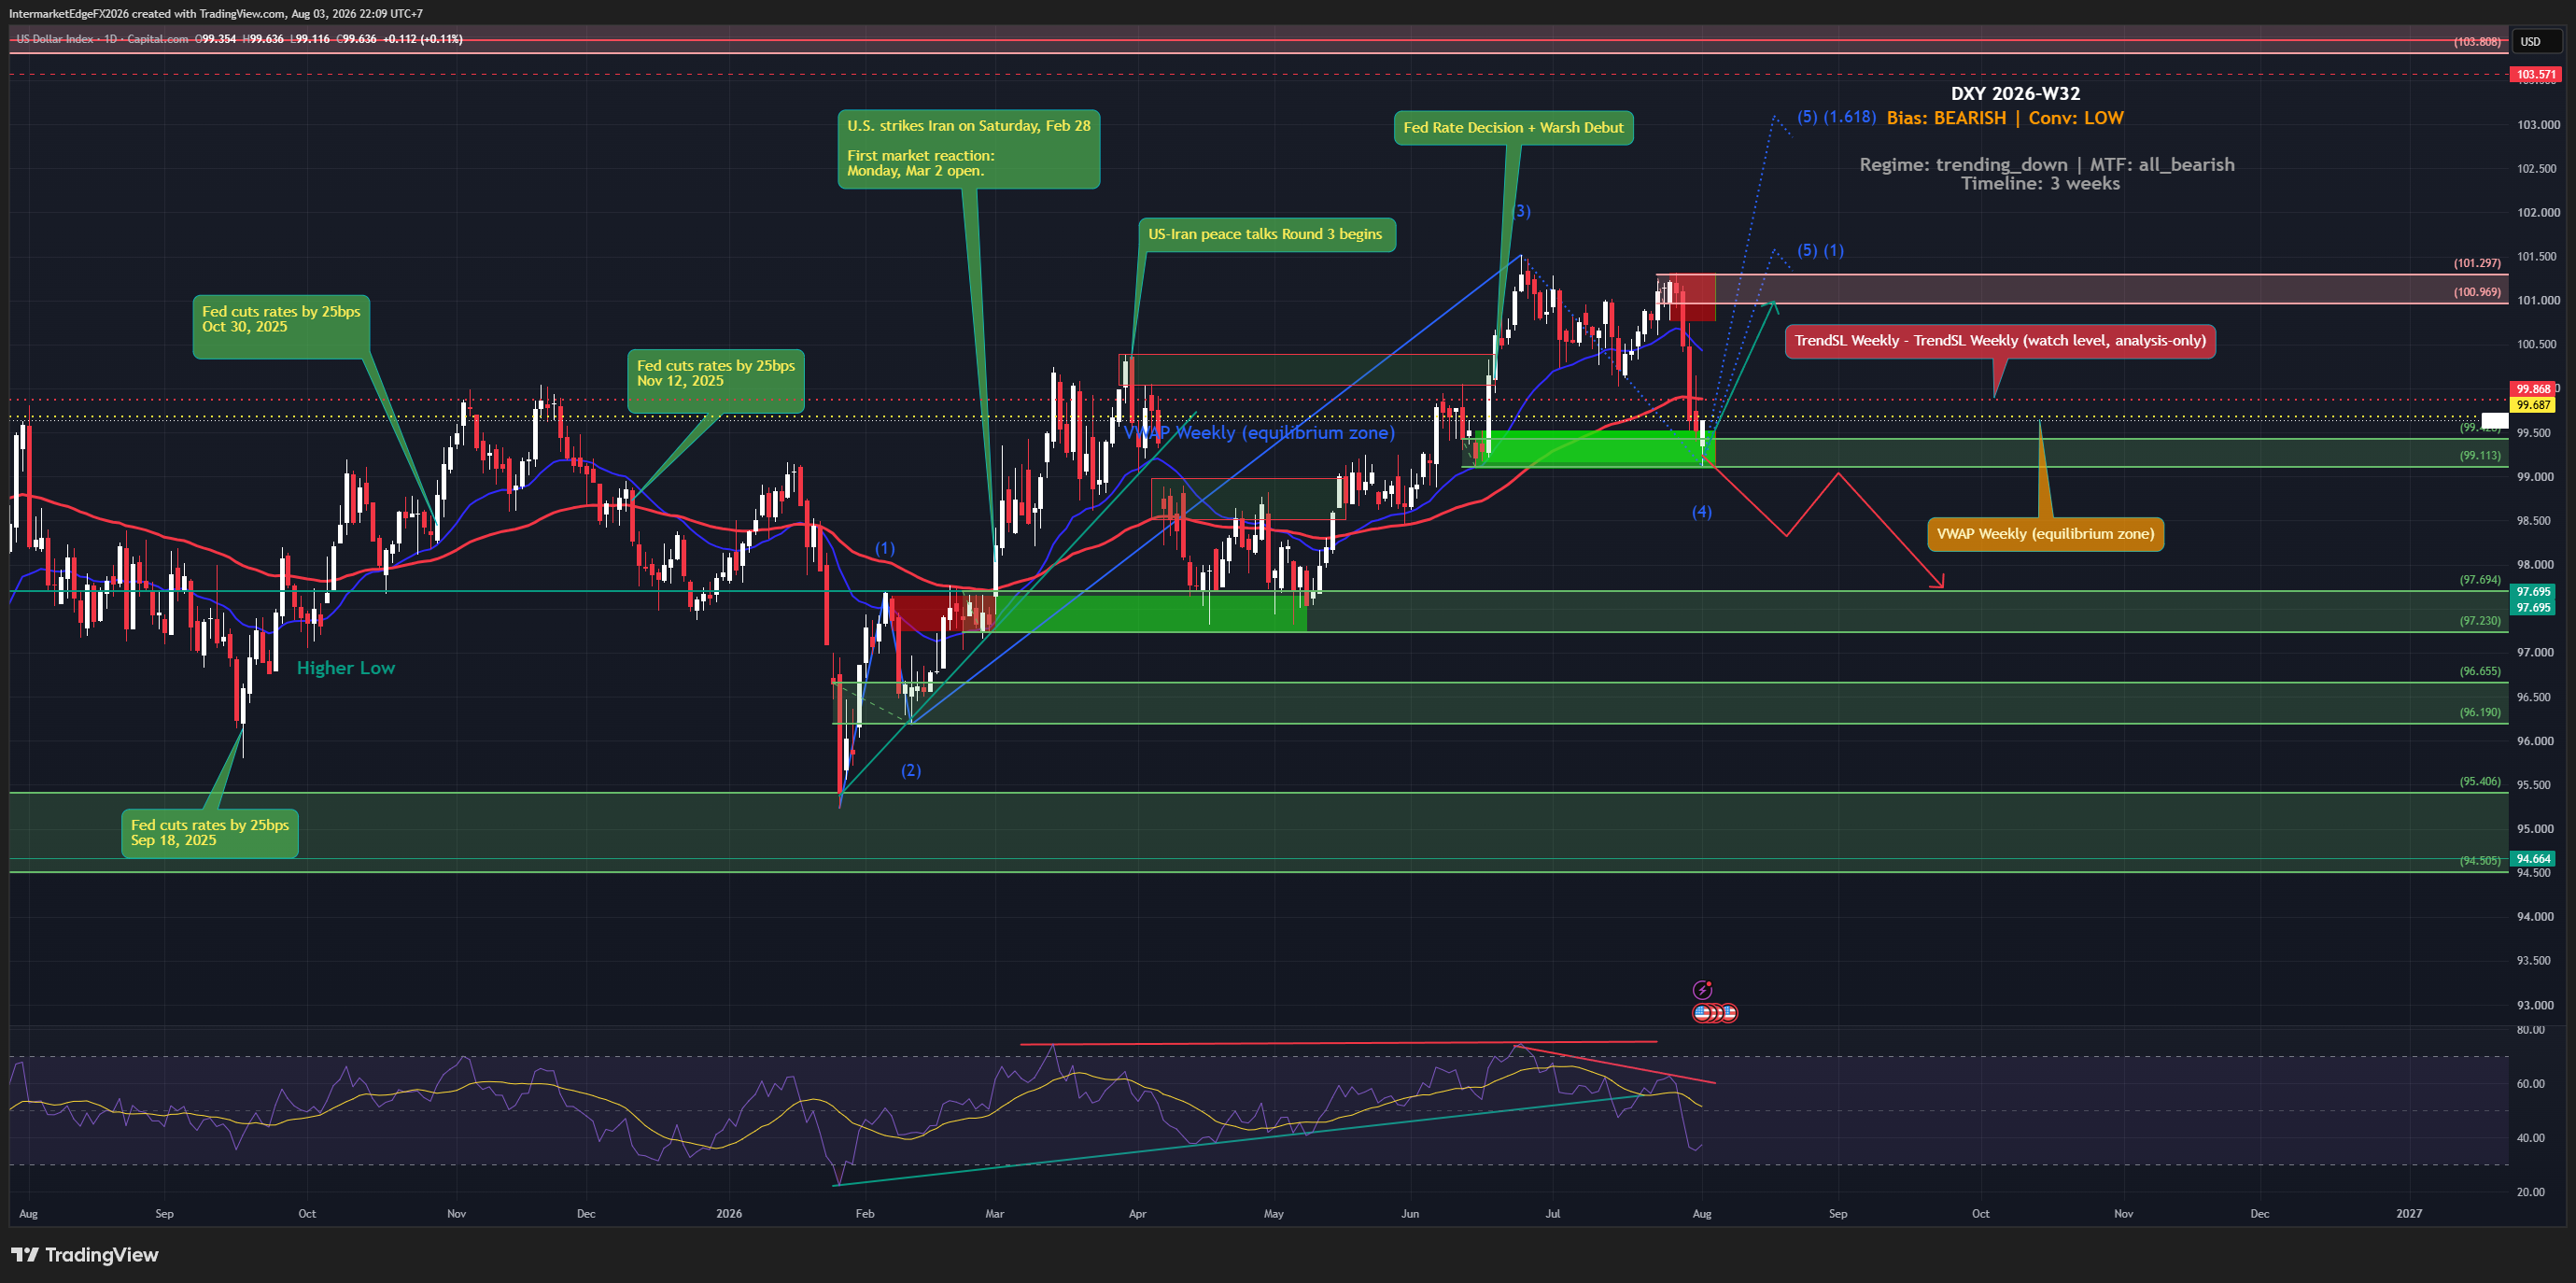
DXY - SUMMARY 06/07/2026 Regime: Dollar holds steady after a sharp NFP miss, Medium Bull. June NFP came in at just +57K versus a 110K forecast, weakest in four months, yet DXY still stands at 100.982 because wave (4) had already finished absorbing at 99.1-99.6 before the data landed, real yield remains positive at +0.27%, and the Fed stays hawkish post the Warsh FOMC. Bias: Medium Bull (trimmed from Medium-High Bull last week). New factor: June NFP missed sharply at +57K, May revised down from +172K to +129K, unemployment held at 4.2%. VIX low at 15.81, no defensive risk-off yet. Data corrections: CPI 4.2% (not 2.4%); US2Y 4.12% (not 3.668%); Fed Hold with hawkish bias post-Warsh (not "40% hike odds"). D1 structure: wave (4) absorbed 99.113-99.618, price cleared to 100.982, retesting the reaction high at 101.5-102. Wave (5) targets: 101.808 then 103.957, zone 103-104.5. Invalidation below 97.695. Scenarios: wave (5) continues toward 103-104.5 (40%); weak ISM Services pulls price back to retest 99.1-99.6 (30%); range pending confirmation (15%); break below 97.695 invalidates the wave count (15%). Decisive event today: ISM Services PMI and a Waller speech. For informational purposes only, not investment advice.

USDJPY - Resistance at 161.94 Still Unbroken After Repeated Tests, MoF Intervention Risk Rising, Wave (a) Correction Targets 155.2

USDJPY - Resistance at 161.94 Still Unbroken After Repeated Tests, MoF Intervention Risk Rising, Wave (a) Correction Targets 155.2

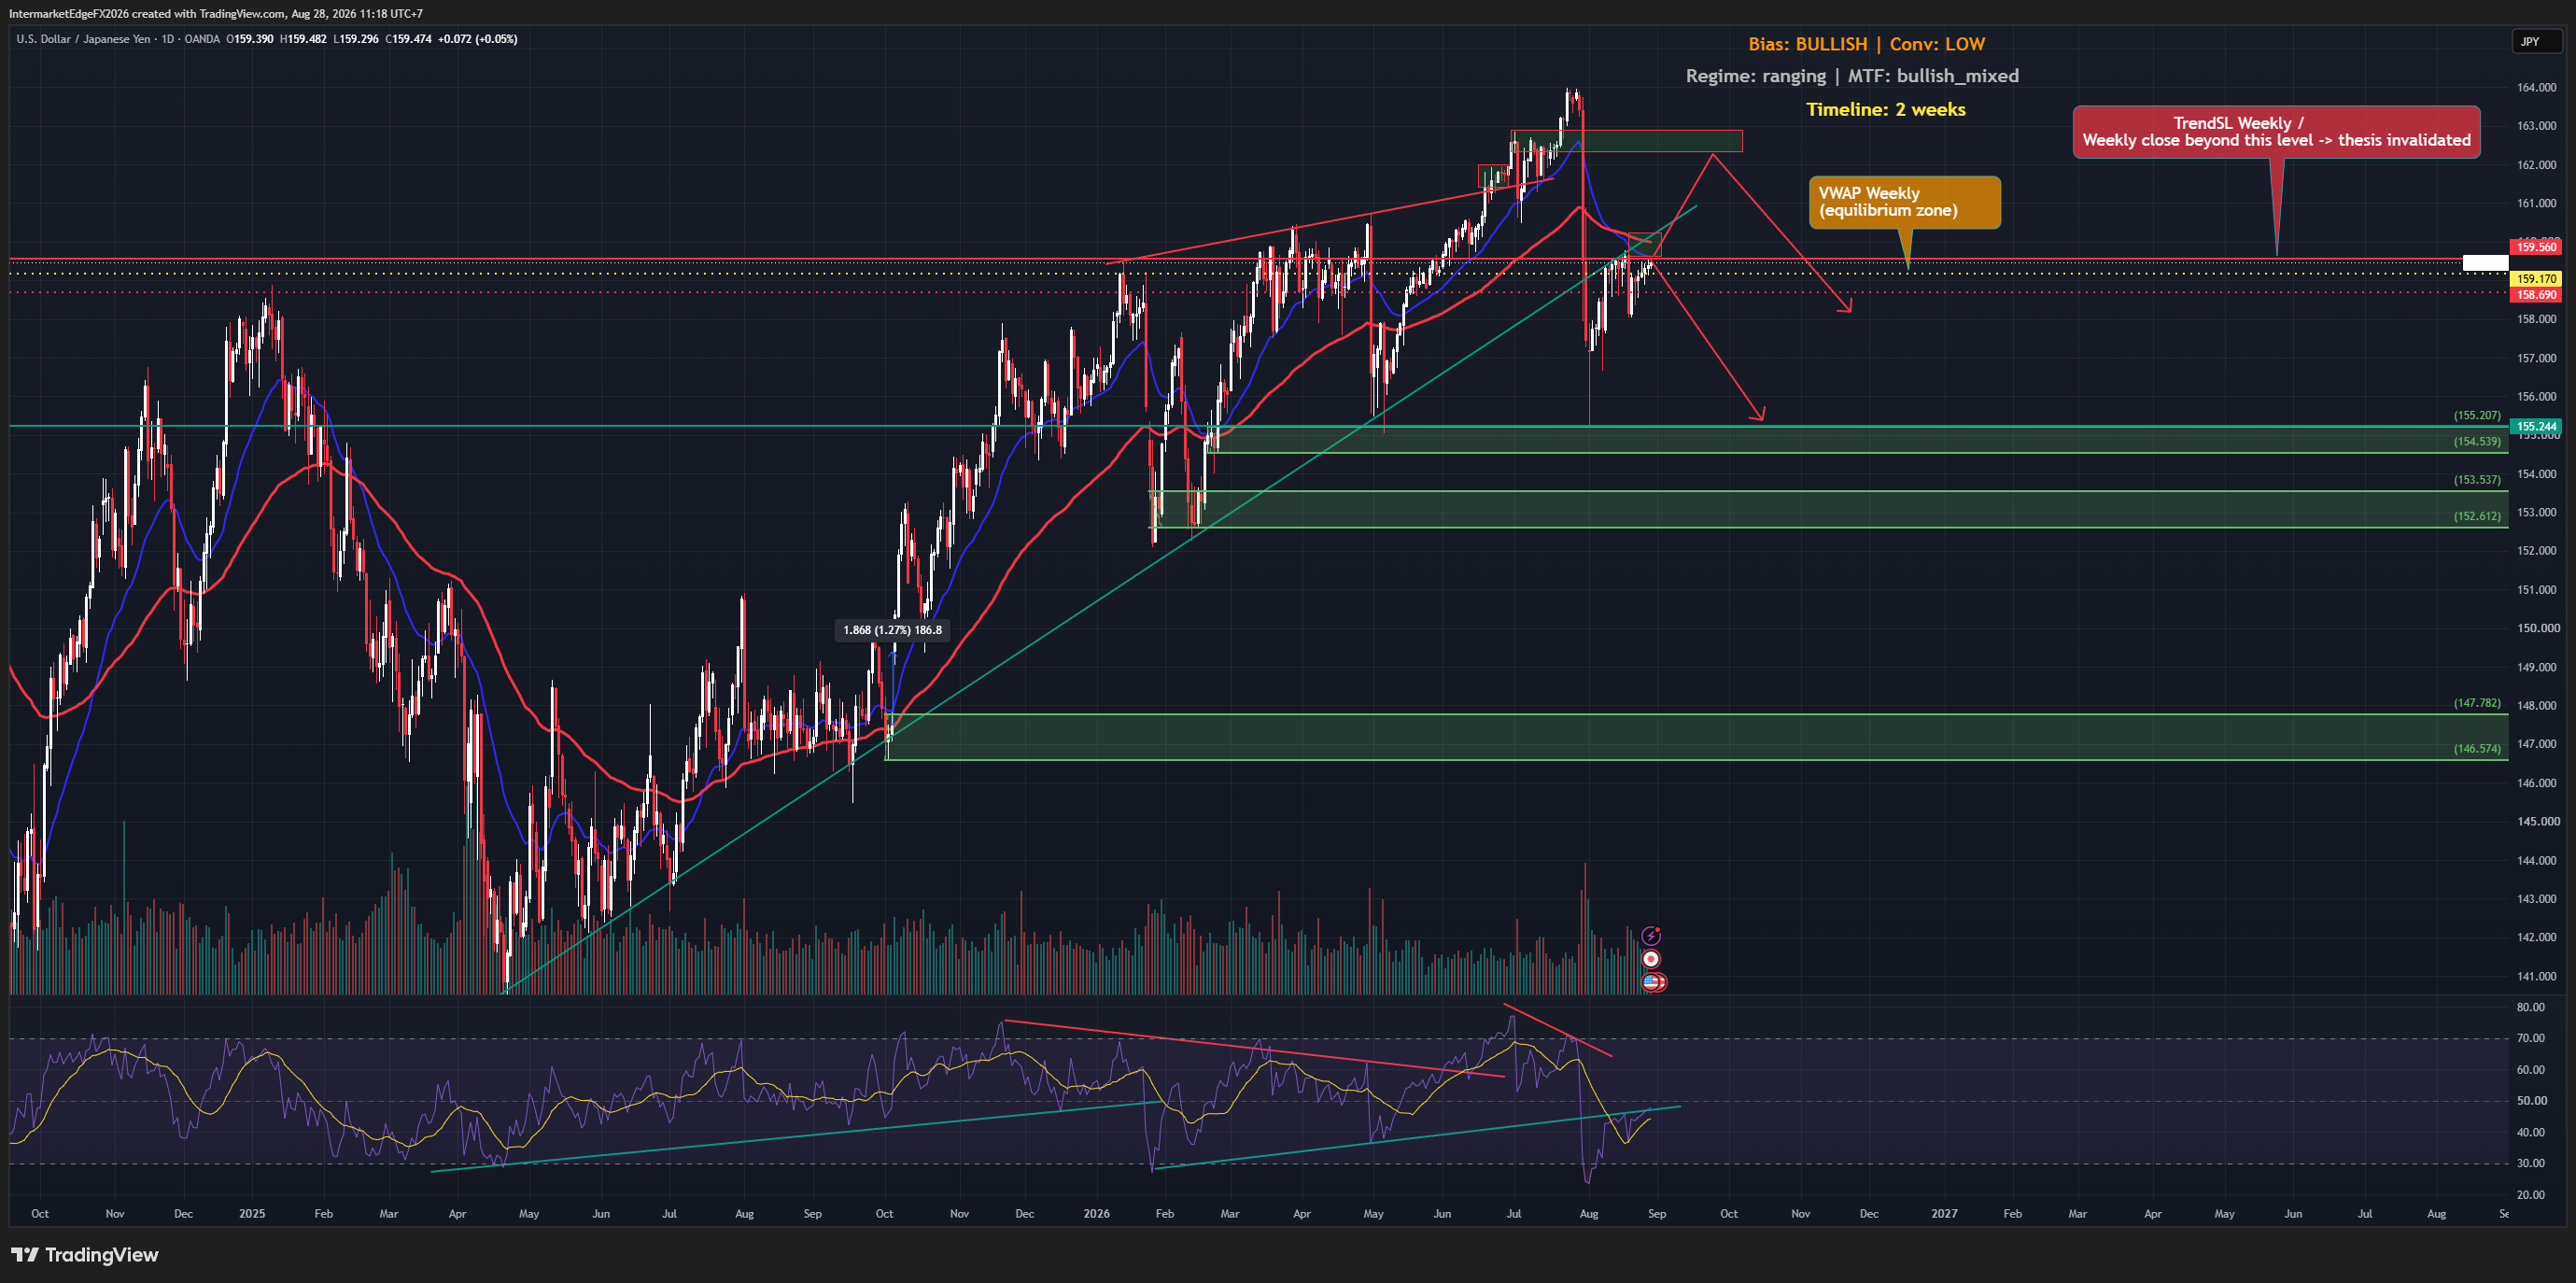
USDJPY - SUMMARY 03/07/2026 Regime: Wave (5) Exhaustion Confirmed, Medium Bear Near-Term. USDJPY 161.11 (0.00%), the 161.940 resistance has been tested repeatedly for over a week without breaking. Bias: Medium Bear near-term (not High given the wildcards). Three high-conviction bearish forces: (1) classic 161.940 resistance exhaustion, (2) actual US-JP carry spread only 1.71% (pipeline wrongly reports 3.015% using stale JP10Y 1.47%), (3) rising MoF intervention risk (Katayama remarks, confirmed "ambush tactics" per news). Additionally: NFP preview shows June expected to slow to 110K -- dovish risk if accurate. Further confirmation: VIX -2.65% risk-on today yet resistance still unbroken -- 161.940 is a genuine technical chokepoint. Data corrections: JP10Y 2.77% (not 1.47%); US-JP spread 1.71% (not 3.015%); US CPI 4.2% (not 2.4%); real yield +0.28% (not 2.085%); BoJ already hiked to 1.00% (not Hold). D1 structure: wave (a) correction expected along Fib 158.953 (0.382) → ~157 (0.5) → 155.207-154.539 (0.618, primary target). Scenarios: wave (a) confirmed toward 155.2 (45%); sideways awaiting NFP (25%); NFP strong, final breakout before correcting (15%); actual MoF intervention, sharp decline (15%). Do not chase long at resistance without confirmed breakout. Invalidation: daily close above 161.940. For informational purposes only. Not financial advice.

DXY - Wave (4) Absorbing After Completing a 13-Month High, NFP on 3 July Is the Decisive Catalyst for Wave (5)

DXY - Wave (4) Absorbing After Completing a 13-Month High, NFP on 3 July Is the Decisive Catalyst for Wave (5)

DXY - SUMMARY 29/06/2026 Regime: Wave (4) Absorbing, Neutral Near Term, Bullish Medium Term. DXY 101.019, pulled back from wave (3) high at 104.2 -- a 13-month high -- to 100.6 last week then bounced modestly to 101.0. Elliott five-wave structure intact. Declining volume in the pullback confirms correction, not reversal. Bias: Medium-High Bull medium term. Neutral within current wave (4). Macro foundation: US CPI actual 4.2% (pipeline 2.4% stale), Fed Warsh hawkish hold, rate differential +225bps vs EUR (ECB 2.00% neutral hold), +325bps vs JPY (BoJ 1.00%). US10Y 4.372%, yield curve steepening +27bps, real yield +0.172%. Data corrections: JP10Y 2.63% (not 1.47%); US-JP spread 1.742% (not 2.924%); DE10Y 2.85% (not 2.99%); ECB neutral 2.00% (not cutting 2.50%). D1 structure: wave (4) absorption zone 99.6 (Fib 0.382) to 99.1 (Fib 0.5). Resistance: 101.5 / 102.0 / 102.5. Support: 100.48 (Higher Low) / 99.6 / 99.1 / 98.0. Wave (5) target 103-104.5. Extended: 106. Invalidation: 97.695. Scenarios: test 99.6-99.1 then wave (5) 103-104.5 (60%); low already printed at 100.6, break of 102.0 = early wave (5) (30%); NFP miss, below 98 (10%). Event risk: Chicago PMI 30 June, ADP 1 July, NFP 3 July -- decisive catalyst. Above 220K = early wave (5) trigger. Do not chase before NFP. For informational purposes only. Not financial advice.

USDCAD - CAD Hits a 14-Month Low as Oil Breaks Below $70 and DXY Holds a 13-Month High, a Double Squeeze Drives Wave (3) Toward 1.4447

USDCAD - CAD Hits a 14-Month Low as Oil Breaks Below $70 and DXY Holds a 13-Month High, a Double Squeeze Drives Wave (3) Toward 1.4447

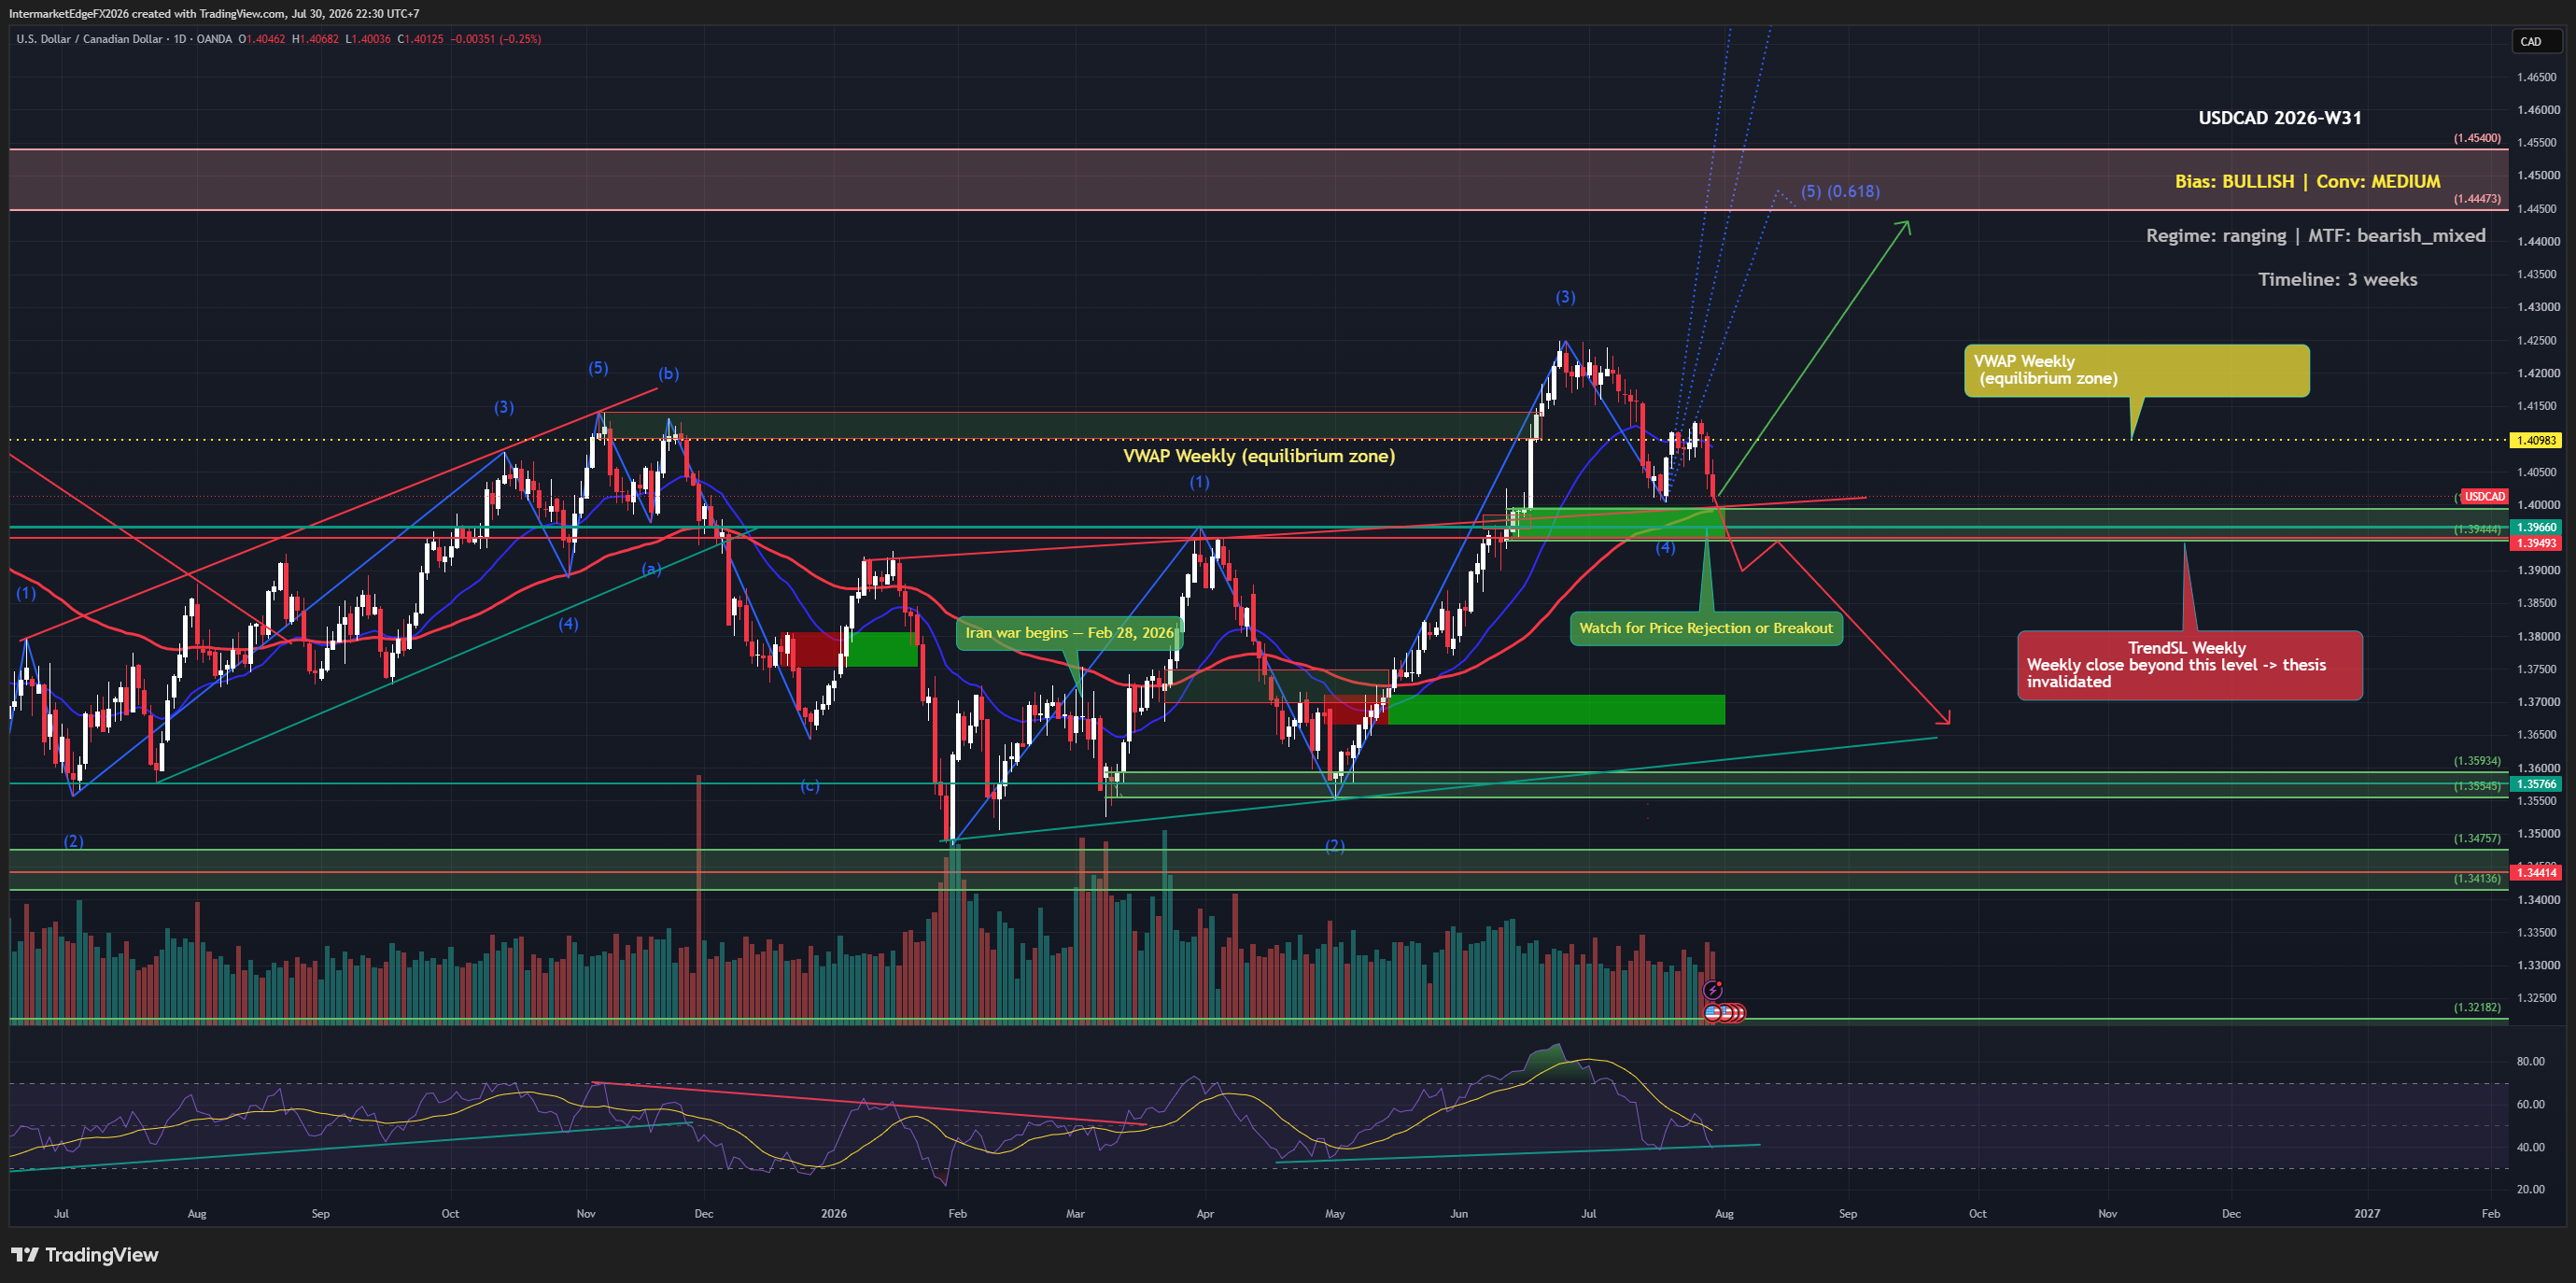
USDCAD 1.4232 | Double squeeze: 13-month DXY high + oil below $70 | 25 June 2026 CAD hits a 14-month low, pressured from both sides simultaneously. USD leg: 13-month high post-hawkish FOMC. CAD leg: oil broke below $70 and the pre-war 71.11 support. When both legs tilt the same way, this is the strongest bullish configuration. BoC Macklem today: not seeing spillovers from higher oil prices into CPI. Implicitly dovish, BoC in no hurry to hike. Canada benchmark yields slipping. CAD at a 14-month low as tech selloff drives safe-haven into USD. AUDUSD at 0.691, broad commodity FX weakness. CAD weakness is not idiosyncratic. D1 structure: wave (3) impulse running. Target 1.4447 then 1.4540. Support 1.4100 then 1.3993. Invalidation: below 1.3476. Three scenarios: → Wave (3) continues to 1.4447 then 1.4540. Probability: 45% → Sub-wave 4 correction to 1.40 then resumes. Probability: 25% → Oil bounces + dovish Fed, drops to 1.39. Probability: 15% The tell: both legs tilting simultaneously. DXY strongest in 13 months, CAD weakest in 14. Not a coincidence. A double squeeze. Conviction: High Bull (upgraded from Med-High). --- Intermarket Edge | Institutional Macro & Intermarket Analysis For informational purposes only. Not financial advice.

DXY - A 13-Month High After the FOMC Confirms Wave (3), a Wave (4) Pullback to 99.1 Sets Up the Wave (5) Push Toward 103-104

DXY - A 13-Month High After the FOMC Confirms Wave (3), a Wave (4) Pullback to 99.1 Sets Up the Wave (5) Push Toward 103-104

DXY 100.623 | 13-month high confirms wave (3), wave (4) pullback ahead | 22 June 2026 Last week the FOMC confirmed the direction. This week the dollar holds a 13-month high -- and the chart says the pullback before the next leg up is the trade to watch. Foundation: the FOMC under Warsh held + projected a hike later in 2026. DXY climbed to a 13-month high and held. The basket is uniform: EURUSD 1.1461, GBPUSD 1.3216, USDJPY 161.678. US yields elevated: US10Y 4.480%, US2Y jumped to 4.220%, real yield 0.280%. New wrinkle: Iran peace talks Round 1 ended but cracks emerged. The haven premium that drained last week is partially returning. The pipeline showed you the wrong numbers. CPI US: 2.4% (actual 4.2%). Fed: "Hold ~40% hike Apr 2027" (actual: hold + projected hike later 2026). BoJ: "Hold" (actual: hiked to 1.00%). JP10Y: 1.47% (actual: 2.660%). ECB: 2.50% cutting (actual: 2.00% neutral). D1 structure: a large impulse. (1) ~99, (2) ~95.5, (3) nearing completion ~101. Wave (4) pullback expected to 99.427/99.113, deeper to 98.549. Then wave (5) to 103.571 then 104.246-104.734. Invalidation: 97.695. Three scenarios: → Wave (4) to 99.4-99.1 then wave (5) to 103-104. Probability: 40% → Strong data or deeper Iran cracks, extension through 101 toward 103. Probability: 25% → Deeper wave (4) to 98.549, weak data triggers, then resume. Probability: 20% Event risk: Waller today, Flash PMI + ADP tomorrow. The tell: wave (4) pullback. Strong data skips it and extends to 103; weak data triggers the dip to 99.1 that sets up the real move. Do not chase at the 100.6 top. Conviction: Medium-High Bull structural. Intermarket Edge | Institutional Macro & Intermarket Analysis For informational purposes only. Not financial advice.

USDJPY - Wave (5) Exhaustion at the 161.94 Intervention Ceiling, the BoJ Hike Compresses the Spread to 1.81% as the Yen Hits a 23-Month Low

USDJPY - Wave (5) Exhaustion at the 161.94 Intervention Ceiling, the BoJ Hike Compresses the Spread to 1.81% as the Yen Hits a 23-Month Low

USDJPY 161.354 | Wave (5) exhaustion at the 161.94 intervention ceiling | 19 June 2026 The foundation says bullish. The ceiling says caution. Three capping forces converge at exactly the level where Japan's MOF has intervened before -- and the wave count says the impulse is running out of room. USD leg strong: FOMC 17/06 held + projected hike later this year, DXY ~101. Japan May CPI subdued (core +1.4%, core-core +1.8%), less BoJ urgency. Three capping forces: First, acute MOF intervention risk. The yen hit a 23-month low, Japan warned verbally, USDJPY beyond 160. When triggered: 300-500 pips in hours. Second, the BoJ hiked to 1.00% with hawkish guidance. JP10Y jumped to 2.640% (not the stale 1.47%). The real US-JP spread is just 1.811% -- nearly a third narrower than the pipeline's 2.981%. Third, wave (5) exhaustion at the 161.940 ceiling. The wave count expects completion then an (a)(b)(c) correction. The pipeline showed you the wrong number. JP10Y: 1.47% (stale). Actual: 2.640%. US-JP spread: 2.981%. Actual: 1.811%. D1 structure: impulse (1)~149, (2)~140, (3)~159, (4)~152, (5) now ~161.35, ceiling 161.940. Correction targets: 157.2 (0.382) / 155.2 (0.5) / 153.5 (0.618). Above 161.94 opens extension to 164. Three scenarios: → Wave (5) completes then correction to 155-157. Probability: 35% → MOF intervention, sharp drop to 155 then 152. Probability: 25% → Break above 161.94, extension to 164. Probability: 25% The tell: three forces at one ceiling. Wave (5), the MOF warning, and the compressed spread all point to 161.94. Above it, 164; below 160, the correction begins. Do not chase longs at 161. Conviction: Medium Bull structural, near-term correction lean. --- Intermarket Edge | Institutional Macro & Intermarket Analysis For informational purposes only. Not financial advice.

USDCAD - Wave (3) Impulse on Post-FOMC Dollar Strength, CAD at a 7-Month Low, a Wave (4) Pullback Sets Up the Wave (5) Push Toward 1.45

USDCAD - Wave (3) Impulse on Post-FOMC Dollar Strength, CAD at a 7-Month Low, a Wave (4) Pullback Sets Up the Wave (5) Push Toward 1.45

USDCAD 1.4115 | Wave (3) impulse on post-FOMC dollar strength | 18 June 2026 Two currencies moving in opposite directions met in one pair: the Fed projected a hike, and the Canadian dollar hit a 7-month low. The wave count says the big move hasn't started yet. USD leg: the FOMC on 17/06 held rates but projected a hike later in 2026 -- a hawkish dot plot. The dollar extended gains, DXY to a two-month high near 100.6. EUR/GBP/AUD all falling, confirming broad USD strength. CAD leg: the Canadian dollar at a 7-month low (newsfeed: "Canadian Dollar Hits 7-Month Low"). Crude ticked up to 74.46 but stays low after the war premium unwound -- pressure on CAD. The pipeline showed you the wrong numbers. Fed pipeline: "Hold 2026, hike Apr 2027." Actual: hold + projected hike later 2026 (hawkish, done). Pipeline CPI US 2.4%. Actual 4.2%, real yield 0.263%. D1 structure: a bullish Elliott impulse. (1) ~1.38, (2) ~1.347, (3) now ~1.414. Price at 1.4115, just below the 1.41388 resistance. The chart expects a wave (4) pullback to the fib region 1.39 (0.382) / 1.385 (0.5) / 1.378 (0.618), pivot 1.39660. Then wave (5) up to 1.44473 → 1.45400. Three scenarios: → Wave (4) to 1.39-1.385 then wave (5) up to 1.44473. Probability: 40% → Direct break above 1.41388 toward 1.44473, shallow pullback. Probability: 25% → Deeper wave (4) to 1.378 then resume up. Probability: 20% Invalidation: daily close below 1.347 (early warning: a break of 1.378). The tell: the wave (4) pullback. A hold above 1.378 with the dollar firm keeps the path to 1.45 alive. Position around the 1.39-1.385 fib region rather than chasing at the top. Conviction: Medium-High Bull. --- Intermarket Edge | Institutional Macro & Intermarket Analysis For informational purposes only. Not financial advice.

InterMarketEdge

© 2026 InterMarketEdge. Financial intelligence for inter-market traders.