Articles — InterMarketEdge

Articles

Financial intelligence, macro research, and inter-market analysis.

USOIL — Sixth Consecutive Draw, Iran Fires Missiles, Lebanon Complicates the Deal, and $92 Is the Floor That Matters

USOIL — Sixth Consecutive Draw, Iran Fires Missiles, Lebanon Complicates the Deal, and $92 Is the Floor That Matters

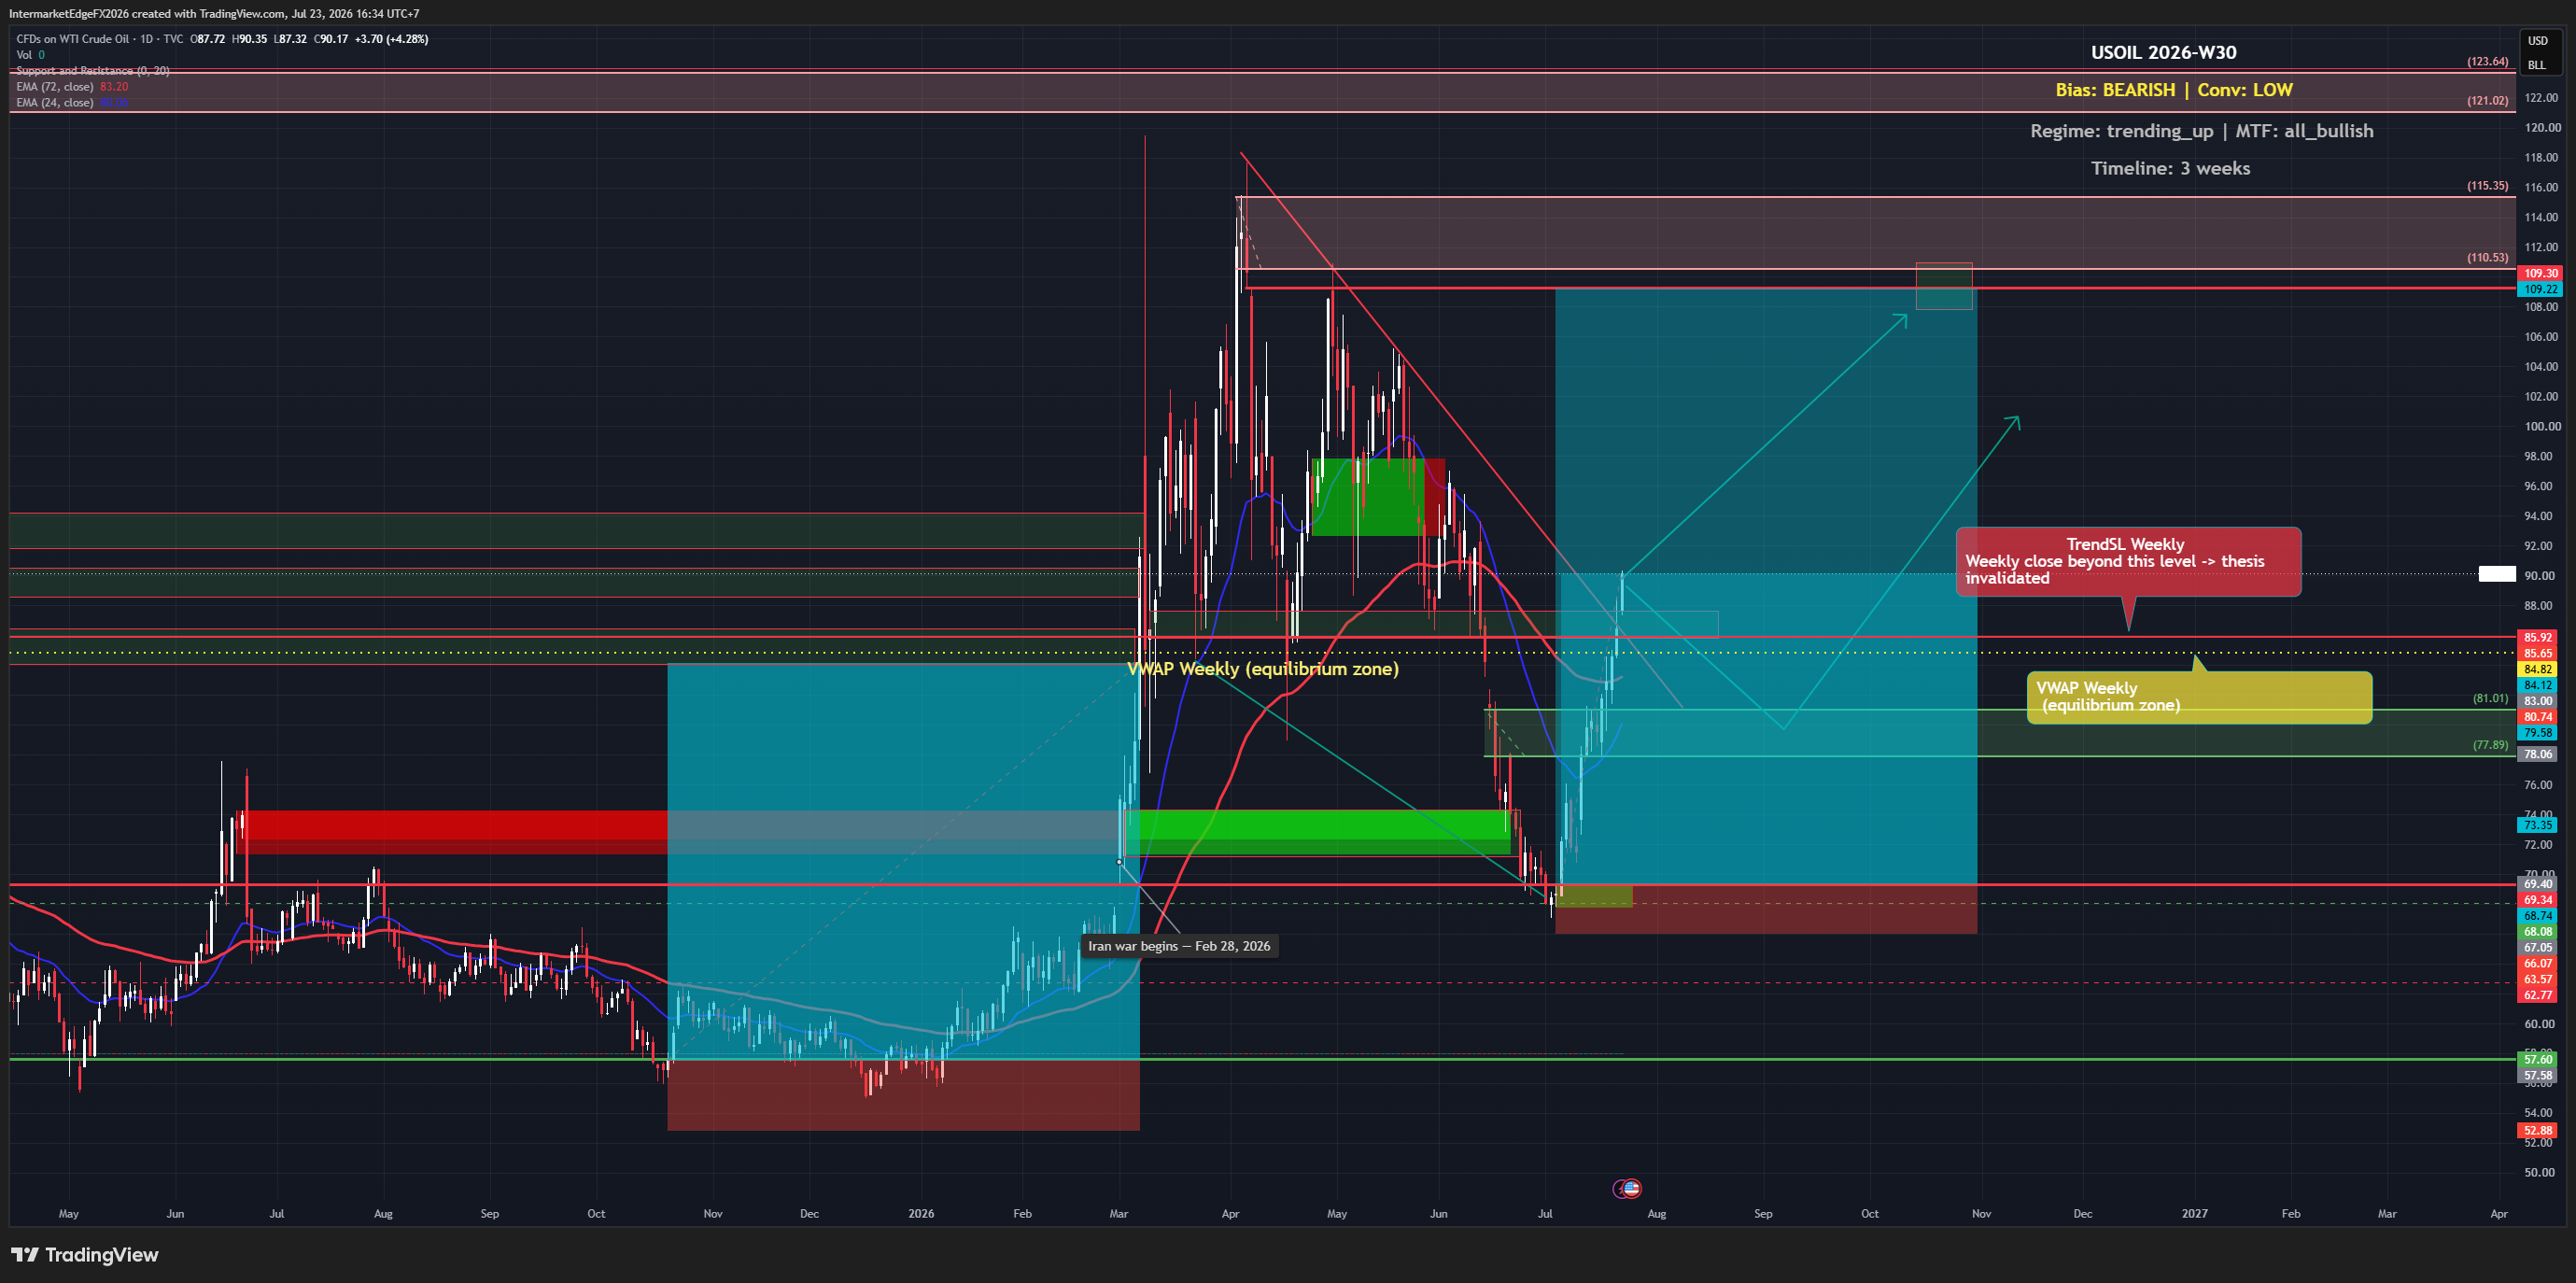
USOIL $95.33 | EIA -7.974M bbl | 04 June 2026 The most bullish EIA print of the current cycle just dropped. Six consecutive weekly draws. Distillates at a 23-year low. The supply picture is unambiguously tightening. And WTI is falling anyway. That is the paradox defining the oil market today — and understanding it is the key to positioning correctly. The EIA draw of -7.974 million barrels for the week ending May 30 was nearly three times the forecast of -2.900M. At current draw rates, US crude stockpiles approach the five-year minimum range within four to six weeks. This is the fundamental floor argument for WTI holding $90-92: the supply picture does not support a rapid decline to the bear targets of $74-71 without either a demand collapse or a full Hormuz reopening. The reason prices are falling despite this data is the Iran-Lebanon nexus. Tehran has conditioned any deal progress on a halt to Israeli operations in Lebanon. Israel has continued strikes despite Trump personally asking Netanyahu to hold back. Iran launched ballistic missiles. US forces struck Qeshm Island in retaliation. Iranian state media says message exchanges with Washington have been suspended. The deal is not dead — Trump insists talks are active — but it is in its most fragile phase since the April 8 ceasefire. The $100-102 resistance has failed twice this week. The $92-97 consolidation zone is the current equilibrium. The $88-92 floor is where supply fundamentals provide genuine structural support. Bear targets if deal completes and Hormuz reopens: $74.49 → $71.11. Invalidation: daily close above $102. Conviction: Medium, Neutral-to-Mild Bear. Timeline extended 2-4 weeks by Lebanon complication.

EURGBP — Greene Fires the Hawkish Signal, ECB Cuts Tomorrow, and the 0.8417 Target Is Back in Play

EURGBP — Greene Fires the Hawkish Signal, ECB Cuts Tomorrow, and the 0.8417 Target Is Back in Play

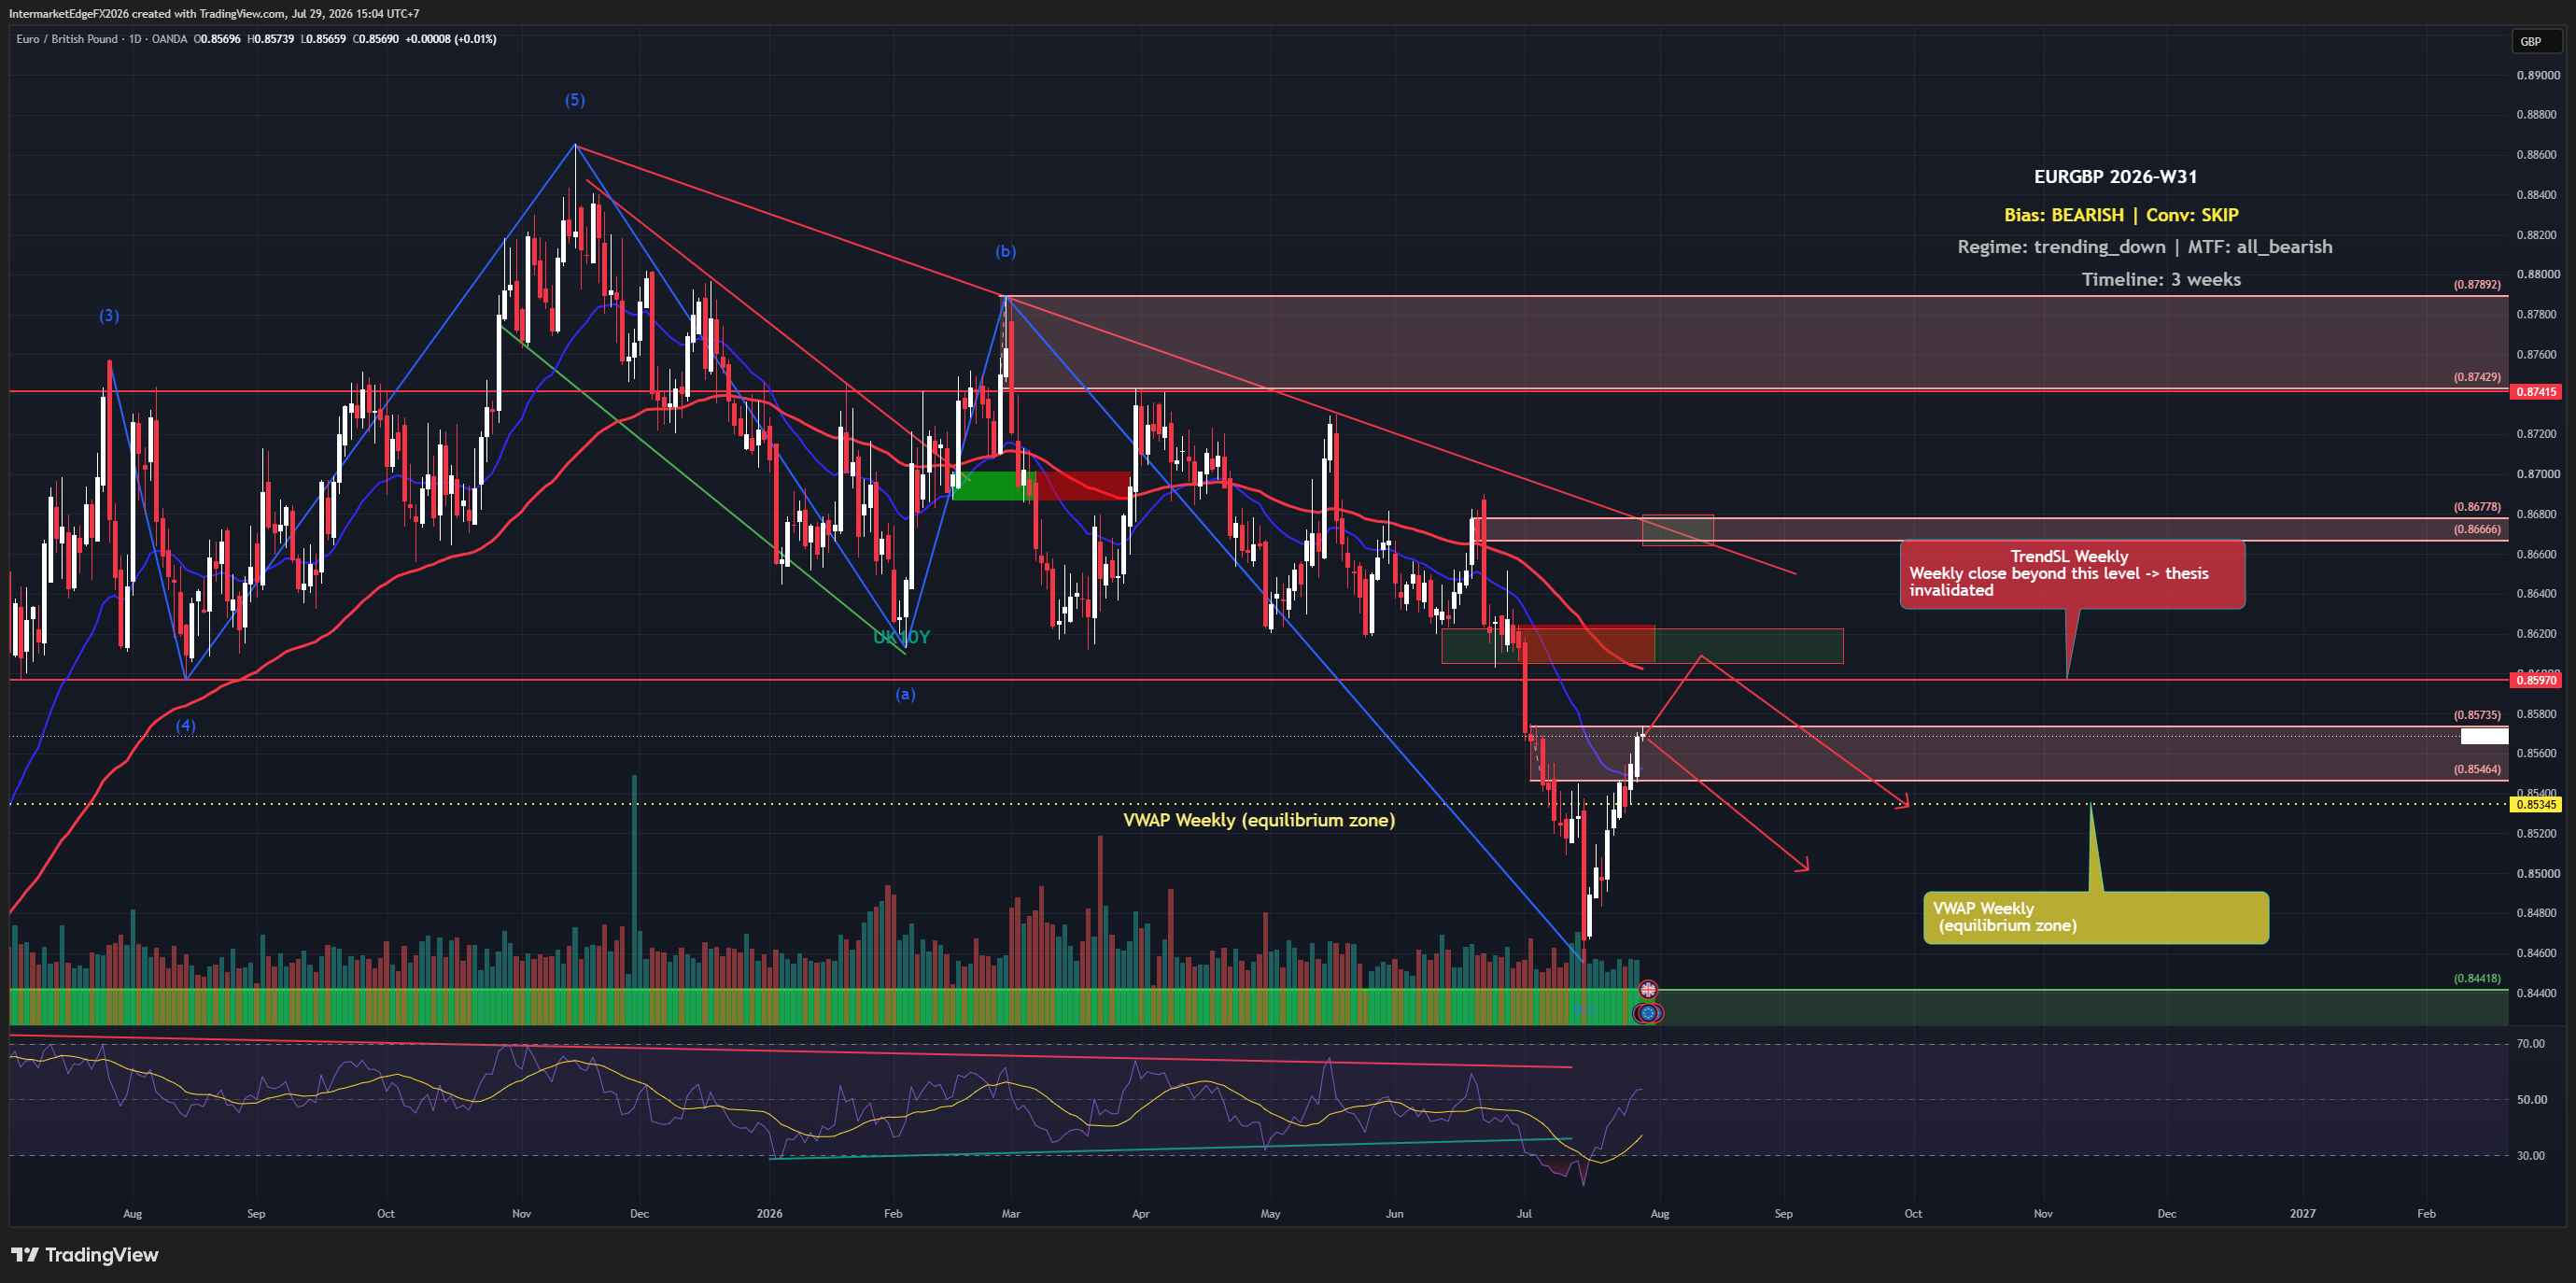
EURGBP 0.8632 | 03 June 2026 The cleanest directional setup in this week's coverage. Two events in the next eighteen hours are pointing the same direction, and the technical structure is mid-move with no exhaustion signal. BoE MPC member Megan Greene delivered a hawkish speech yesterday that materially changes the BoE narrative. She argued the case for raising UK rates has strengthened as the Iran war drags on, that acting sooner is more important than waiting for conclusive evidence, and — most critically — that without an imminent Bank Rate hike, the market yield curve tightening the BoE had been relying on would likely unwind. That is not a suggestion. That is a direct call for action. The ECB cuts tomorrow. The deposit rate moves from 2.50% to 2.25%. The ECB-BoE rate differential widens further against the euro after that cut — from 1.25% to 1.50% in sterling's favor. The oil channel is asymmetric. Brent above $100 applies inflation pressure to both economies, but the UK's energy import dependence means the passthrough is faster and more direct than in the Eurozone. Oil above $100 is Greene's entire argument for preemptive tightening. Every dollar Brent holds above $90 strengthens her case. On the chart, momentum is confirming wave (c) continuation — no divergence, no exhaustion. This is different from EURJPY where negative divergence flagged a topping process. Here the structure is mid-move. Invalidation: daily close above 0.8741. Bear trigger: daily close below 0.8600 on ECB event. Wave (c) targets: 0.84418 → 0.84117. Conviction: Medium-High Bear.

USDJPY Breaches 160 — Gulf Hostilities Boost Dollar, BoJ Intervention Clock Is Running, and the June 16 Hike Is Now 66% Priced

USDJPY Breaches 160 — Gulf Hostilities Boost Dollar, BoJ Intervention Clock Is Running, and the June 16 Hike Is Now 66% Priced

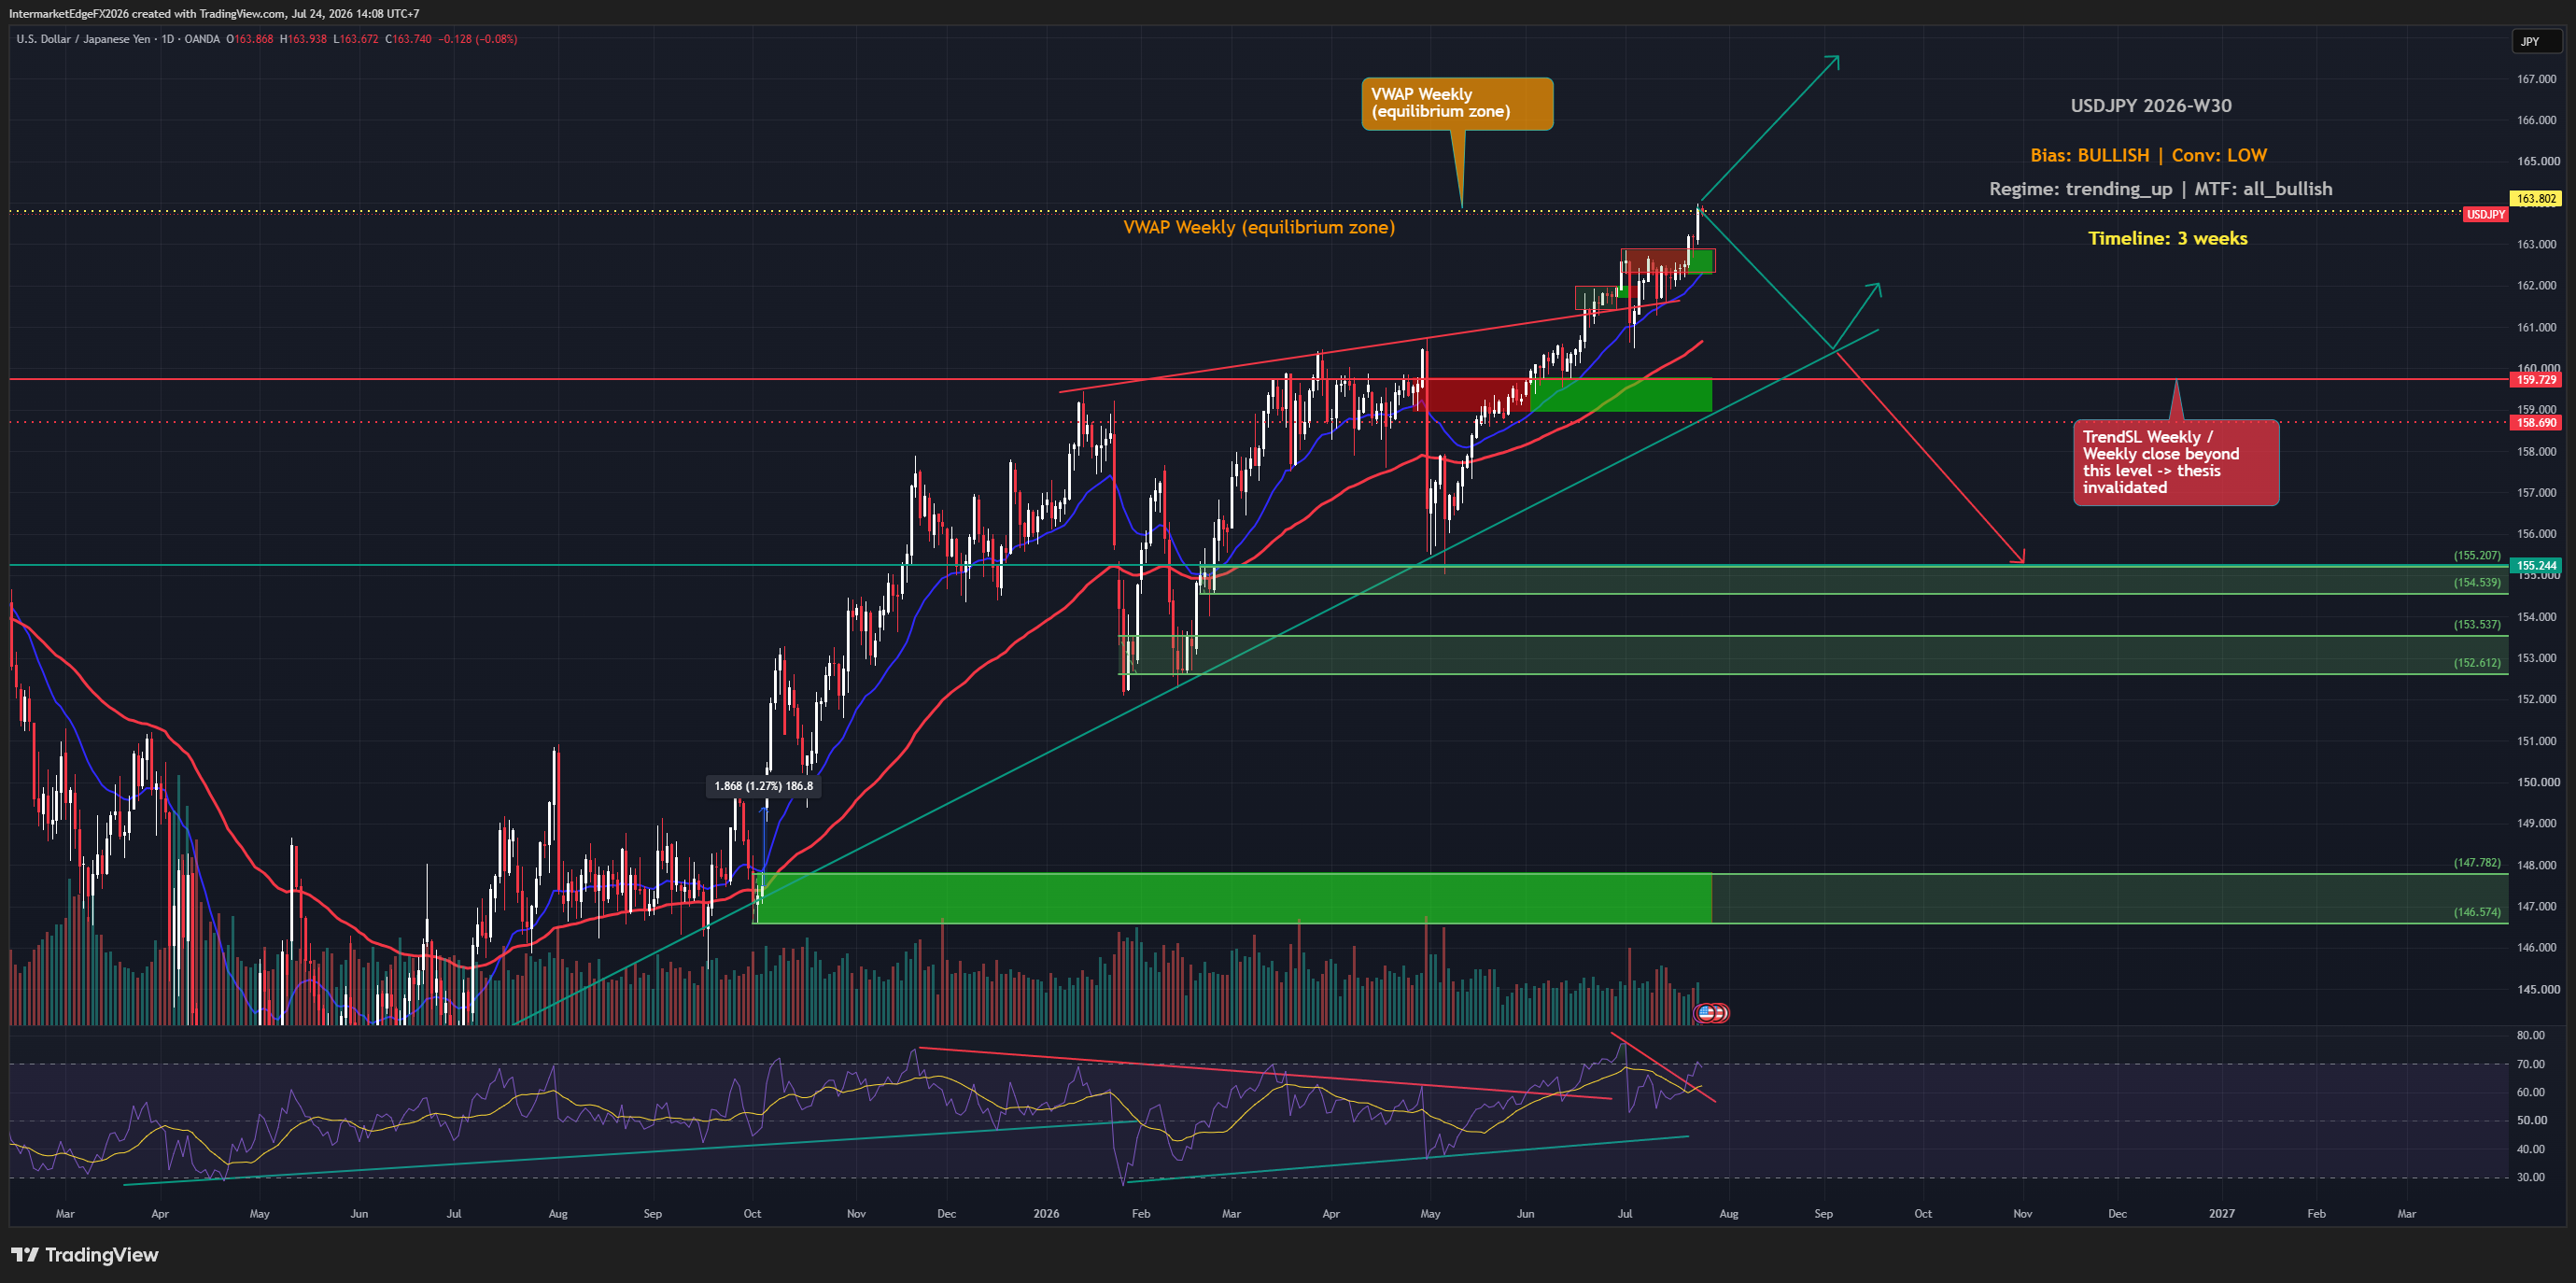
USDJPY 159.897 | intraday high 161.946 | 03 June 2026 USDJPY touched 161.946 this morning — clearing the prior intervention zone — then reversed 200 pips. That single candle is the most important price action of the week. It is either the market self-correcting ahead of MOF action, or verbal intervention has already begun. The structural bear case is built on three pillars that the data pipeline is obscuring. First, JP10Y is not 1.47% as the stale pipeline reads — the chart sidebar shows 2.621%. The corrected US-JP spread is 1.834%, not 2.985%. Carry trade math is deteriorating faster than most analysis reflects. Second, BoJ June 16 hike probability has moved to 66%. The April 28 meeting produced three dissenters voting to hike immediately, and Shunto wages showed 5.09% for a third consecutive year above 5%. Third, the MOF intervention asymmetry is severe: the Ministry spent $62 billion in 2024 defending the yen, the precedent near 160 produced an 800-pip round trip, and the firepower remains. The tactical complication is Gulf hostilities. Trump rejected the halt in US-Iran talks. Brent has retraced above $100. Oil above $100 is dollar-positive and yen-negative simultaneously — Japan is the world's fourth-largest oil importer. This dual channel is why the pair broke 160 today. It reverses the moment a deal is signed. Invalidation: daily close above 161.346. Bear confirmation: daily close below 159.000. Wave (c) targets: 152.612 → 147.782. Today's daily close is the definitive tell. Conviction: Medium-High Bear.

EURJPY at the Ceiling — ECB Cuts Into BoJ Normalization, Oil Rebounds, and 187.936 Is the Line That Cannot Hold

EURJPY at the Ceiling — ECB Cuts Into BoJ Normalization, Oil Rebounds, and 187.936 Is the Line That Cannot Hold

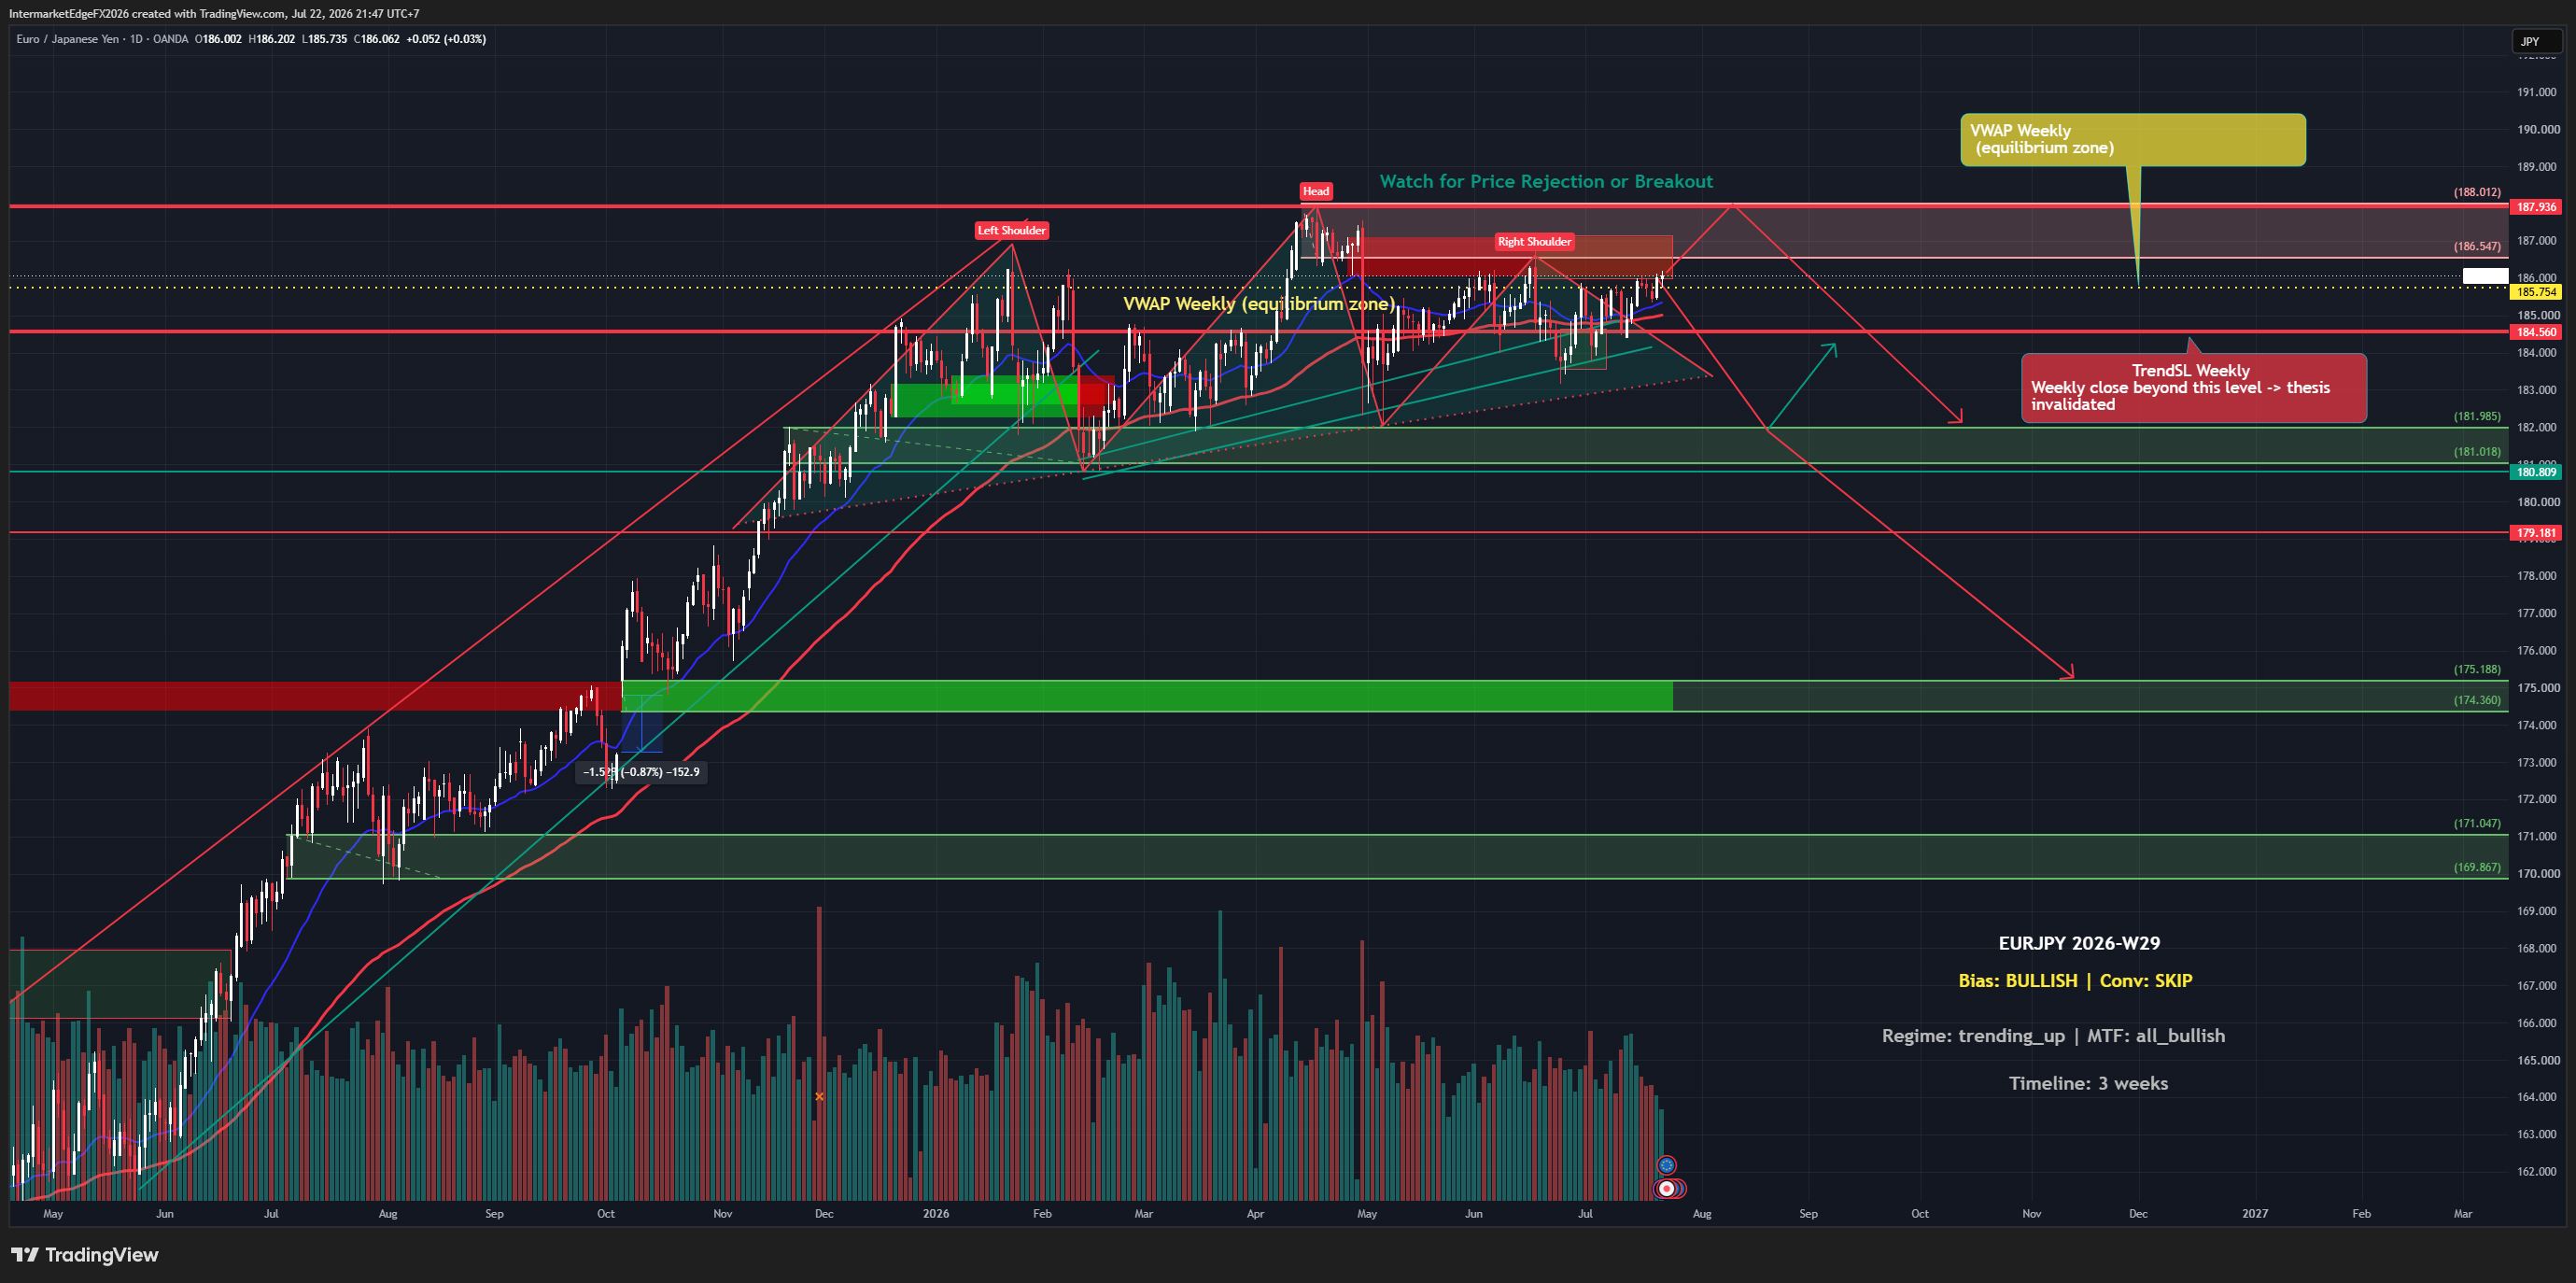
EURJPY 186.063 | 02 June 2026 EURJPY is sitting inside the red resistance zone at 186.00–188.012, and the bear case here is the highest-conviction position in this week's entire instrument coverage. Three structural forces are aligned in the same direction. The ECB is cutting. The June 5 decision — two days away — takes the deposit rate from 2.50% to 2.25%. The rate differential between the ECB and BoJ is compressing, and it will compress further with every subsequent cut. A cutting central bank does not produce a strong currency. The euro is the structurally weaker leg of this cross. The BoJ is normalizing. The pipeline's JP10Y reads 1.47% — stale, last updated May 9. The chart sidebar shows 2.563%. That 110 basis point gap is not a rounding error; it reflects a Japanese bond market that is pricing significantly more BoJ tightening than the pipeline implies. The yen leg of EURJPY has structural support the data pipeline is obscuring. The intervention ceiling is live. USDJPY at 159.852 is 15 pips from 160.00 — the threshold that triggered verbal and physical BoJ intervention in 2024 and that the market universally treats as the current line. A physical intervention would produce a 3–5% yen rally and drive EURJPY down 500–700 pips rapidly. The asymmetry is severe: upside above 160 is capped, downside from intervention is sharp. The single countervailing factor is today's Brent rebound from $91.69 to $98 on Iran deal uncertainty. Japan is the world's fourth-largest oil importer — oil up means yen weakens mechanically. This is why EURJPY is holding near 186 rather than already declining. It is transitional noise, not a structural reversal. Invalidation: daily close above 187.936. Bear confirmation: daily close below 184.00. Wave (c) targets: 171.047 → 169.867. ECB June 5 is the trigger. Conviction: Medium-High Bear.

Sterling Trapped — Bailey Pushes Back, Iran Stalemate Persists, and the 1.3400 Floor Defines the Trade

Sterling Trapped — Bailey Pushes Back, Iran Stalemate Persists, and the 1.3400 Floor Defines the Trade

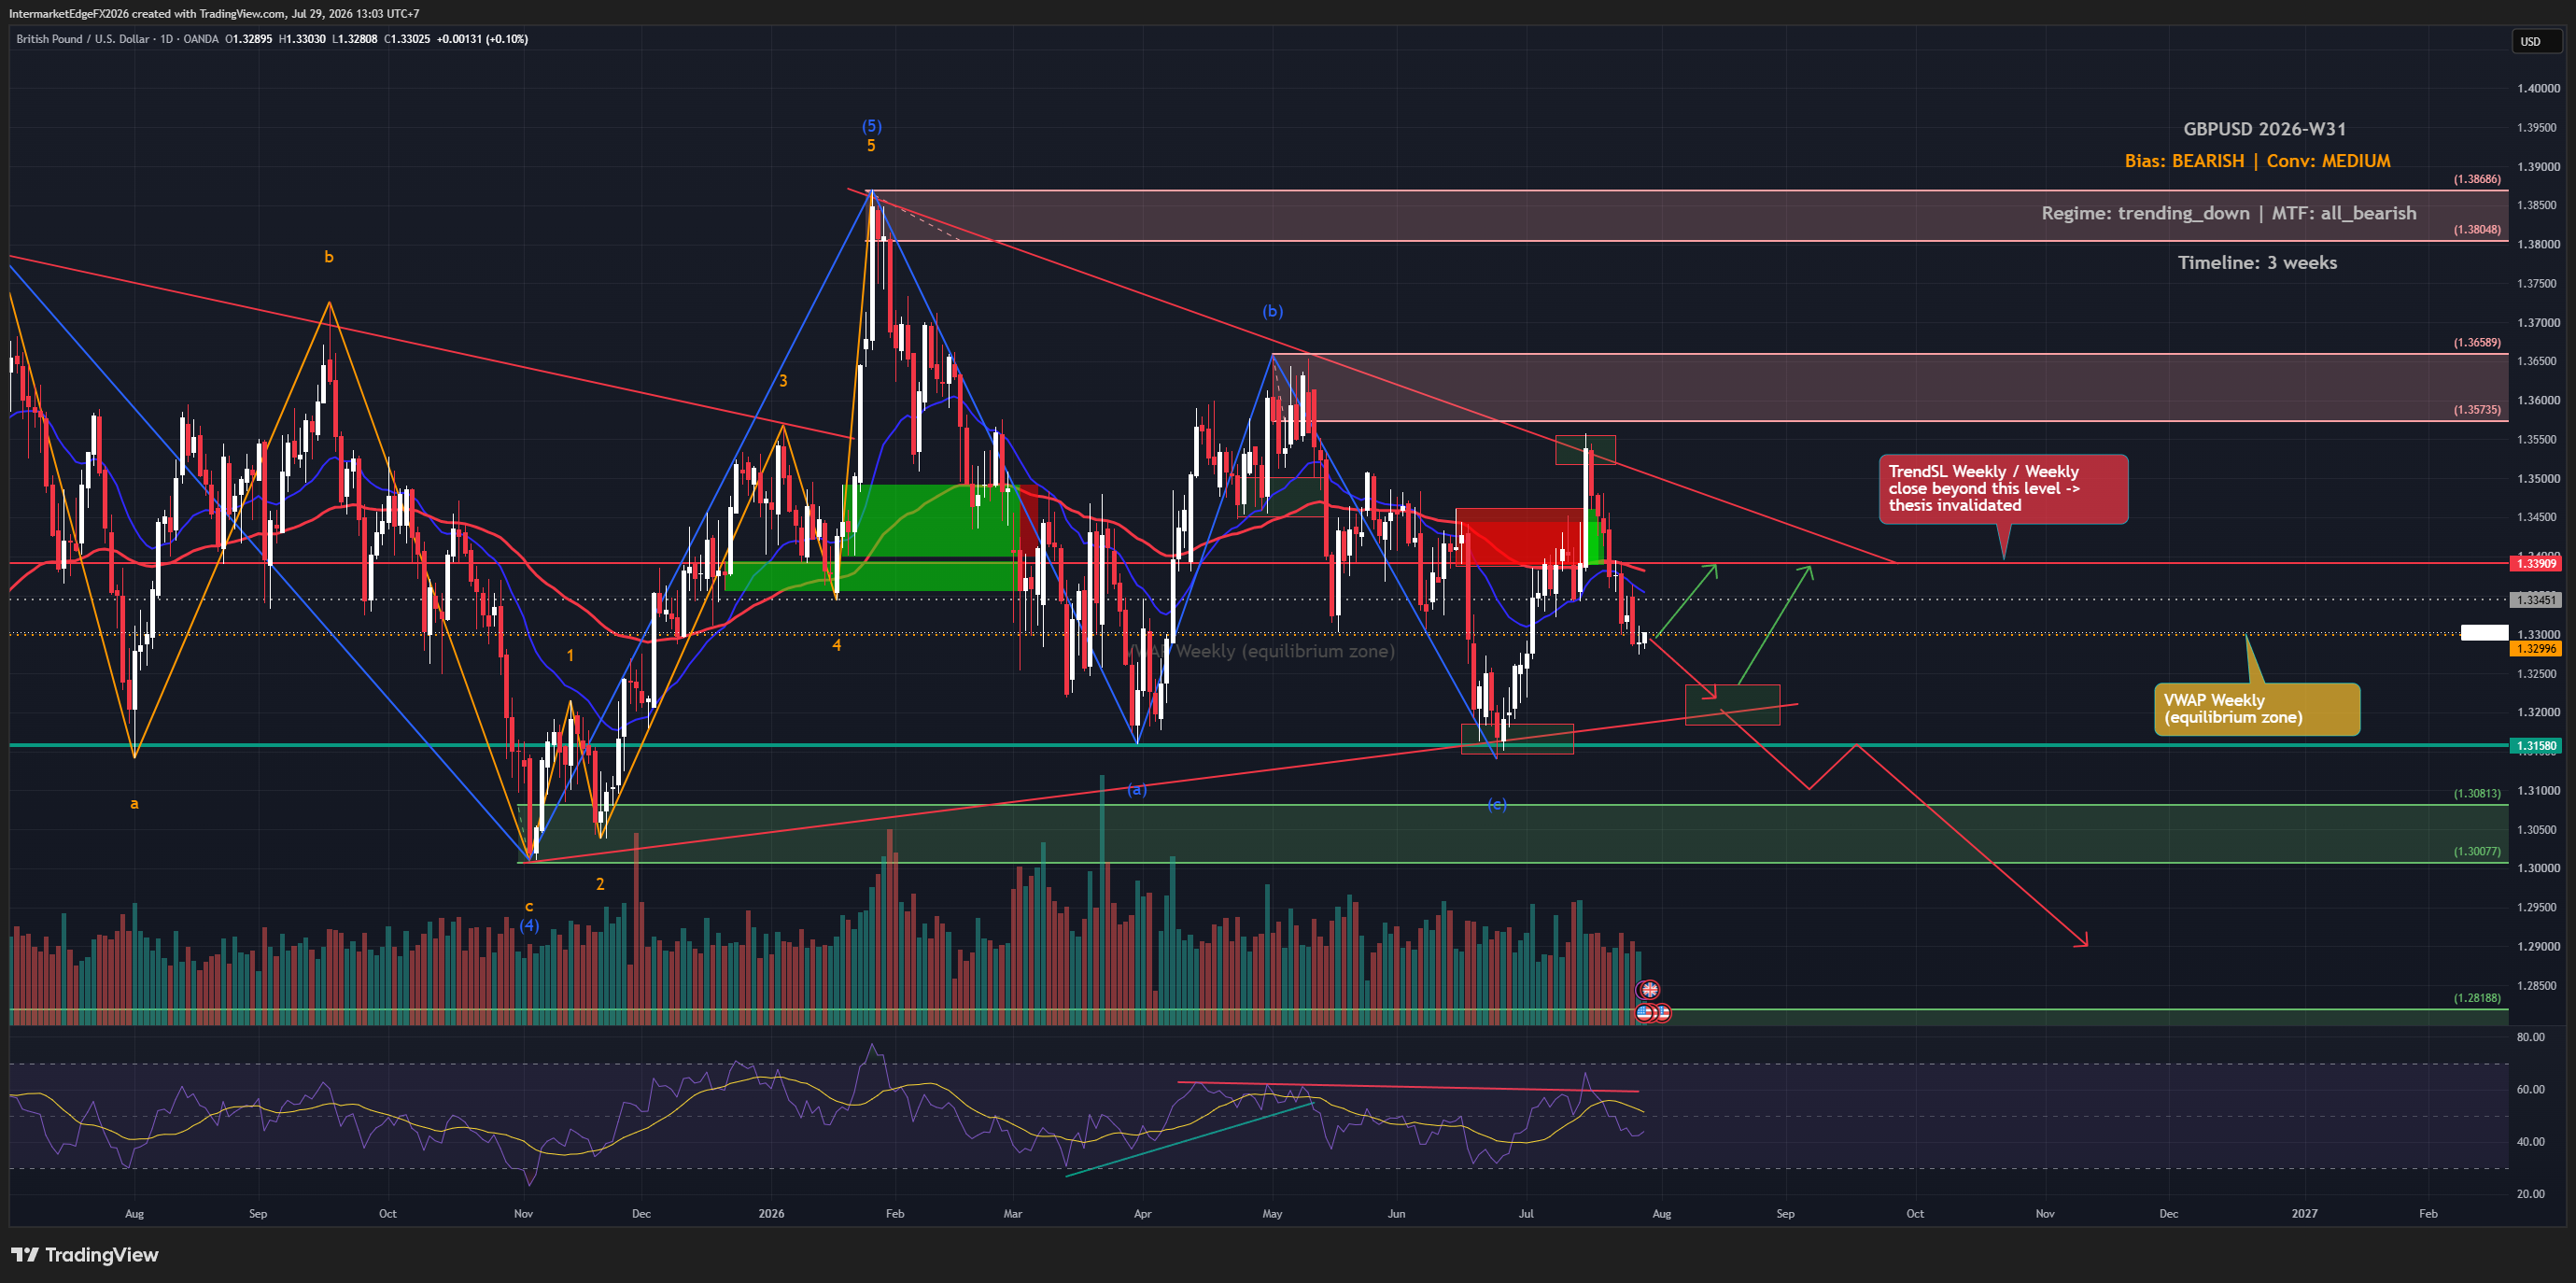
GBPUSD 1.3462 | 02 June 2026 Sterling has been trapped in the 1.3300–1.3500 range for two weeks, and the tension keeping it there is not resolving soon. Two forces are pulling in opposite directions and neither has won. The bull case runs through the dollar channel, not sterling itself. DXY is in a Medium Bear framework driven by the Iran deal decompression cascade — Brent has fallen $17.95 from its $111.27 peak on May 18. When the deal progresses, DXY falls and cable rises mechanically. The UK energy vulnerability factor amplifies this: as a net energy importer, every dollar of Brent decline below $90 benefits sterling disproportionately relative to other G10 pairs. The bear case is Bailey. The BoE Governor has spent the past week systematically removing rate hike premium from sterling. He stated that allowing inflation to exceed 2% is appropriate given weak growth, that the BoE is in no rush to raise rates while Iran remains uncertain, and that even a 60-day ceasefire would still create uncertainty. Markets were pricing 32bp of tightening in 2026; Bailey has been capping that at every opportunity. This morning's US ISM Manufacturing PMI at 54.0 — beating the 53.0 consensus — added a mild dollar bid that is currently capping GBPUSD near 1.3480. On the chart, the 1.3400–1.3450 green support has held on every test. Resistance at 1.3500–1.3550. Bear targets if support breaks: 1.3081, 1.3007, 1.2818. Key tell this week: EURGBP around ECB June 5. A break below 0.8600 is a leading indicator of cable strength. Conviction: Medium, Neutral-to-Mild Bear. Iran binary resolves the range.

Gold at the Decision Point — Iran Stalemate, Real Yield Inversion, and the $4,296 Support That Cannot Break

Gold at the Decision Point — Iran Stalemate, Real Yield Inversion, and the $4,296 Support That Cannot Break

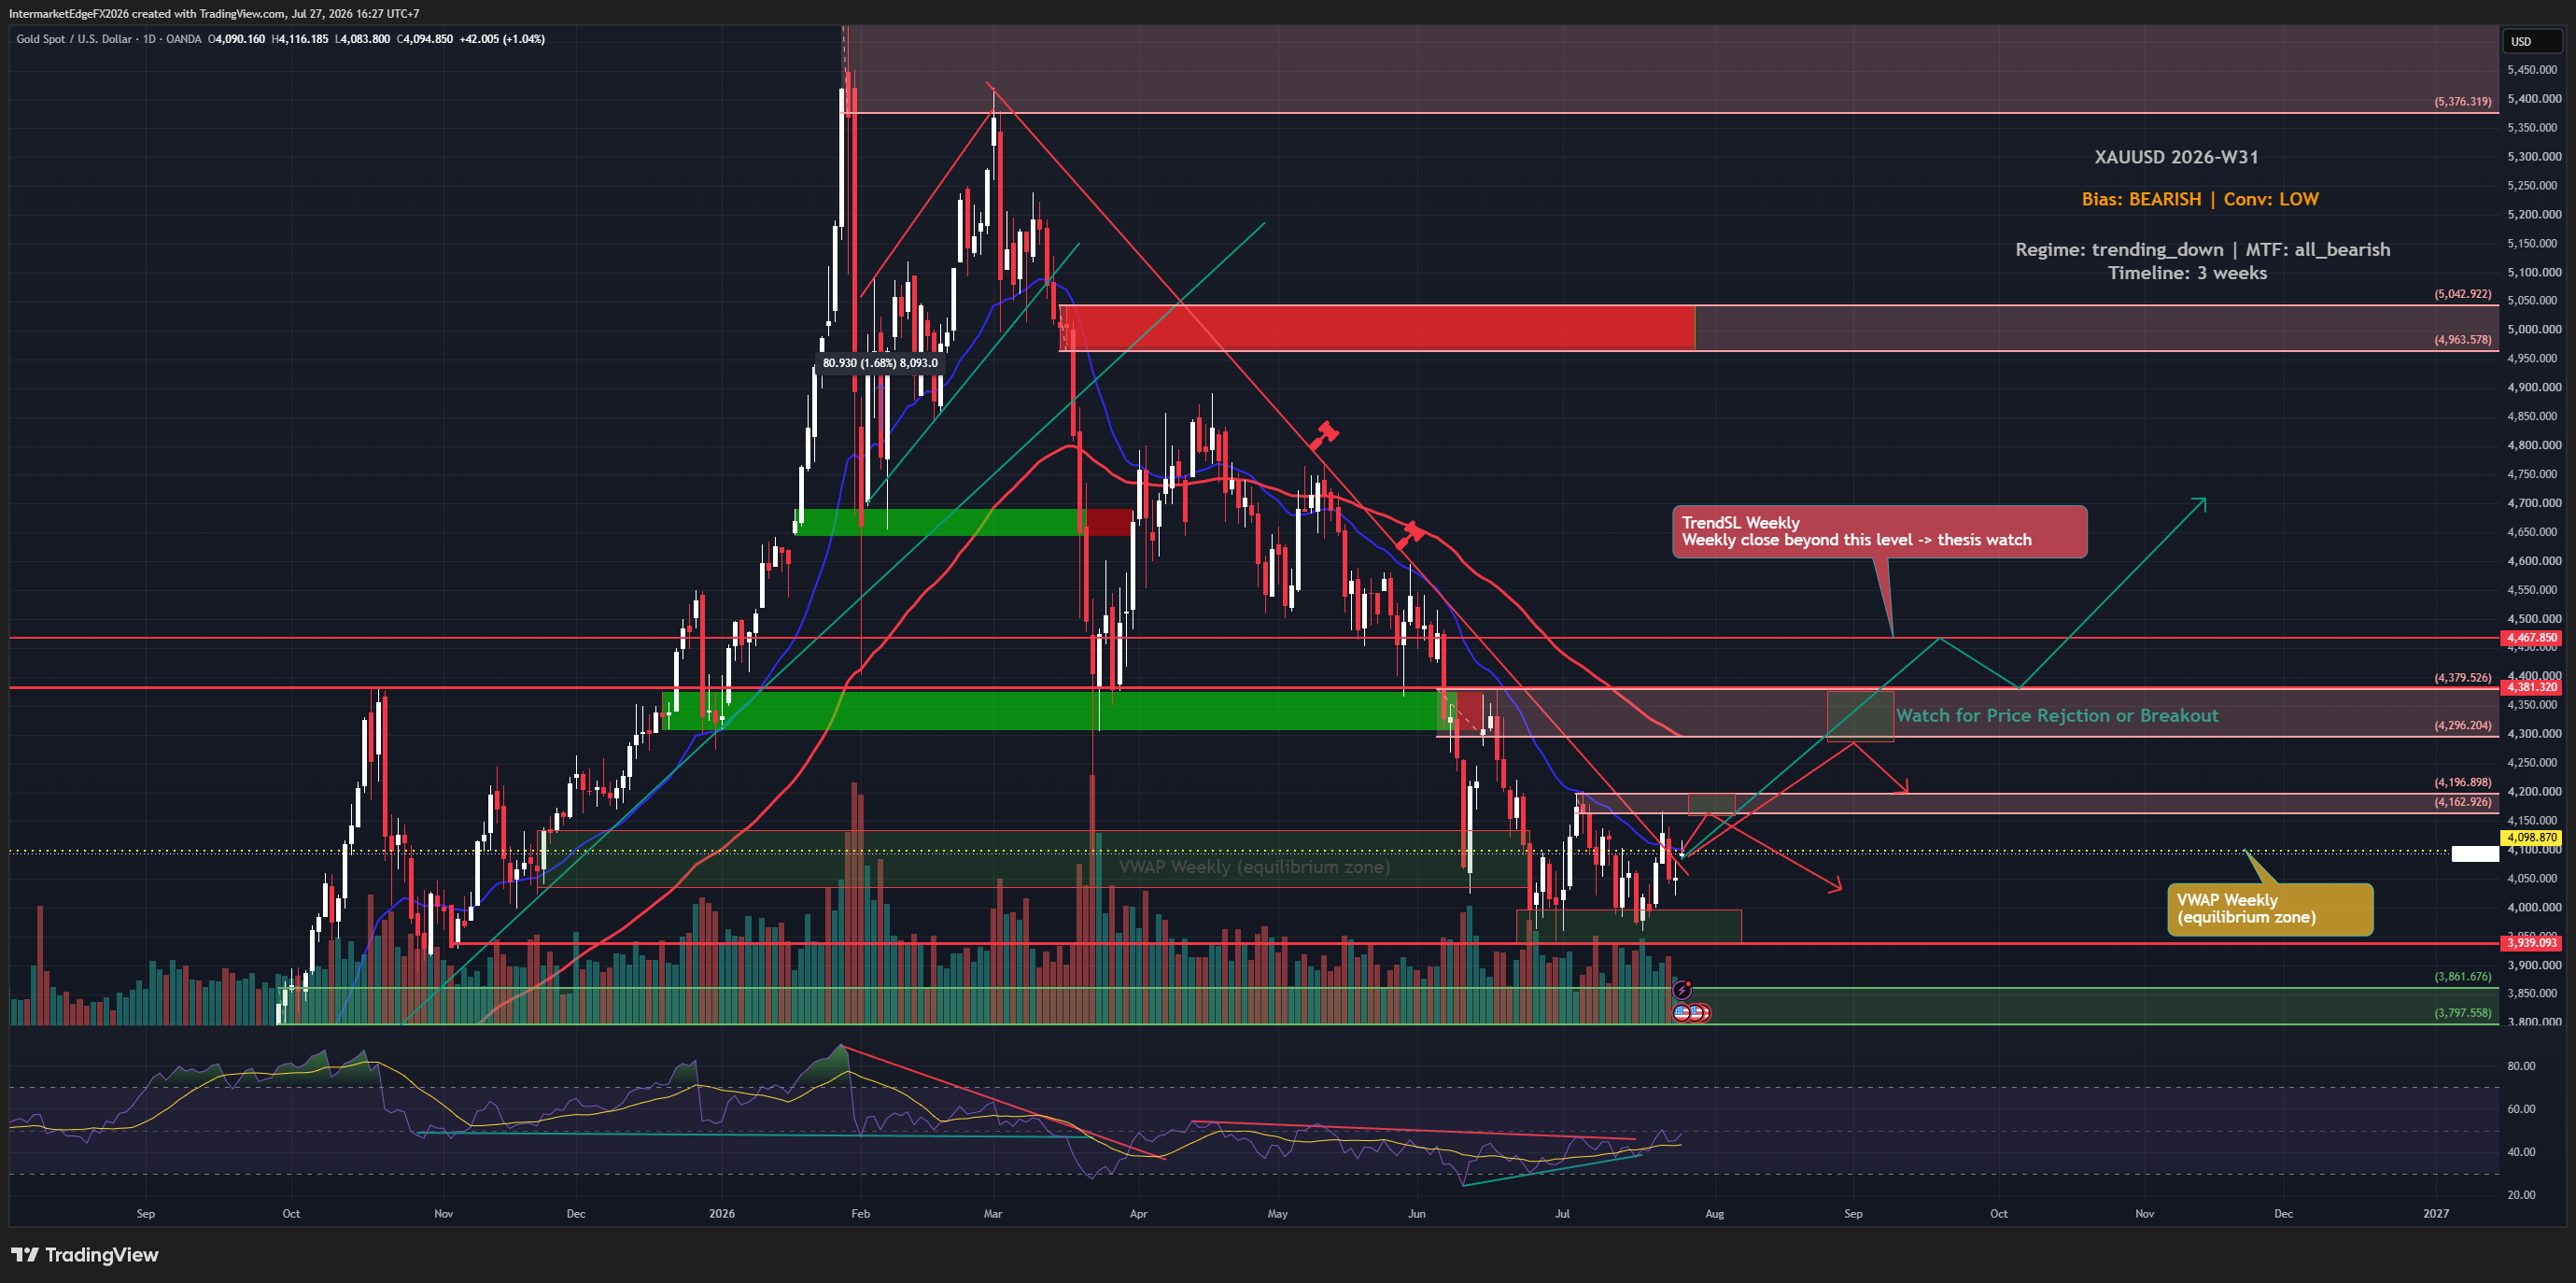
XAUUSD $4,534 | 02 June 2026 Gold is sitting directly on its most important support zone of the year — $4,296 to $4,381 — and the next $200 move in either direction will be decided by a single binary: whether Trump signs the Iran ceasefire deal or walks away. The macro case for gold recovery is structurally sound and does not require geopolitical optimism to hold. With April CPI confirmed at 3.8%, the corrected US real yield is 0.653% — not the 2.05% the stale data pipeline implies. Real yields below 1% historically support gold outperformance on a 3-6 month horizon. The oil decompression cascade has already delivered: Brent fell $17.95 from its $111.27 peak on May 18. Lower oil compresses inflation expectations, reduces Fed hike probability, and begins unwinding the real yield headwind that drove gold from $5,078 to $4,290. The critical regime nuance: in this cycle, an Iran deal is bullish gold — not bearish. Geopolitical de-escalation lowers oil, which lowers inflation, which lowers real yields. The classical safe-haven logic runs backward here. On the chart, RSI has not made a lower low despite price testing the support zone — a momentum divergence consistent with exhaustion of downside pressure. Invalidation is a daily close below $4,178. Bull confirmation sequence: $4,600 → $4,750 → $5,000 weekly close. Key catalysts this week: Iran headline (highest impact, unscheduled), EIA inventory Wednesday, ECB Thursday June 5. Conviction: Conditionally Bullish. The support must hold.

USDJPY: Yen Holds Steady Amid Fresh Verbal Warning - USDJPY Is Sitting at the Peak of a Completed Wave Structure

USDJPY: Yen Holds Steady Amid Fresh Verbal Warning - USDJPY Is Sitting at the Peak of a Completed Wave Structure

USDJPY 159.329 ngày 29/05/2026 đang ở đỉnh của một wave structure đã hoàn chỉnh, với ba lực bearish align đồng thời - và 160.00 là line phân định mọi thứ. Headline sáng nay: "Yen holds steady amid fresh verbal warning." BoJ đã escalate language - đây là bước đầu trong ladder: verbal warning, strong verbal warning, actual intervention. Với USDJPY ở 159.329 và approaching 160, thị trường đang ở giữa bước 1 và 2. Lịch sử BoJ confirm: họ đã intervene tại 160-162 trước đây. "Fresh verbal warning" hôm nay là signal họ sẽ làm lại. Brent drop thêm $3.18 chỉ trong một đêm, từ $94.87 xuống $91.69. Total drop từ đỉnh $111.27 ngày 18/05 là $19.58 trong 11 ngày. Iran deal decompression đang accelerate, không slow down. Điều này hit USDJPY qua double channel: Japan là net energy importer lớn nhất thế giới nên oil rẻ hơn là structural JPY bid, đồng thời oil drop compress US inflation expectations, giảm Fed hike odds, weaken USD. Cả hai vector cùng bearish USDJPY. Chart D1 confirm bằng Elliott Wave structure rõ ràng: completed 5-wave impulse từ đáy 130 lên đỉnh 161-163, ABC correction đang trong wave (c) với measured targets 152.612 (1.0 extension) và 147.782 (1.618 extension). PCE 3.8% hôm qua là short-term USD support nhưng không reverse structural bear thesis - nó chỉ confirm oil shock đang transmit vào inflation, và khi oil tiếp tục drop, PCE sẽ compress và Fed pivot path sẽ reopen. Conviction Medium-High Bear. Tell duy nhất: 160.00. Approach đó thì BoJ intervenes và wave (c) về 152.612 accelerates. Brent dưới $88 trong 24-48h là tell thứ hai.

USDCAD: Canadian Dollar Hits Six-Week Low as USMCA Headline Risk Grows - USDCAD at the Crossroads of Oil Decompression and Dollar Structural Bid

USDCAD: Canadian Dollar Hits Six-Week Low as USMCA Headline Risk Grows - USDCAD at the Crossroads of Oil Decompression and Dollar Structural Bid

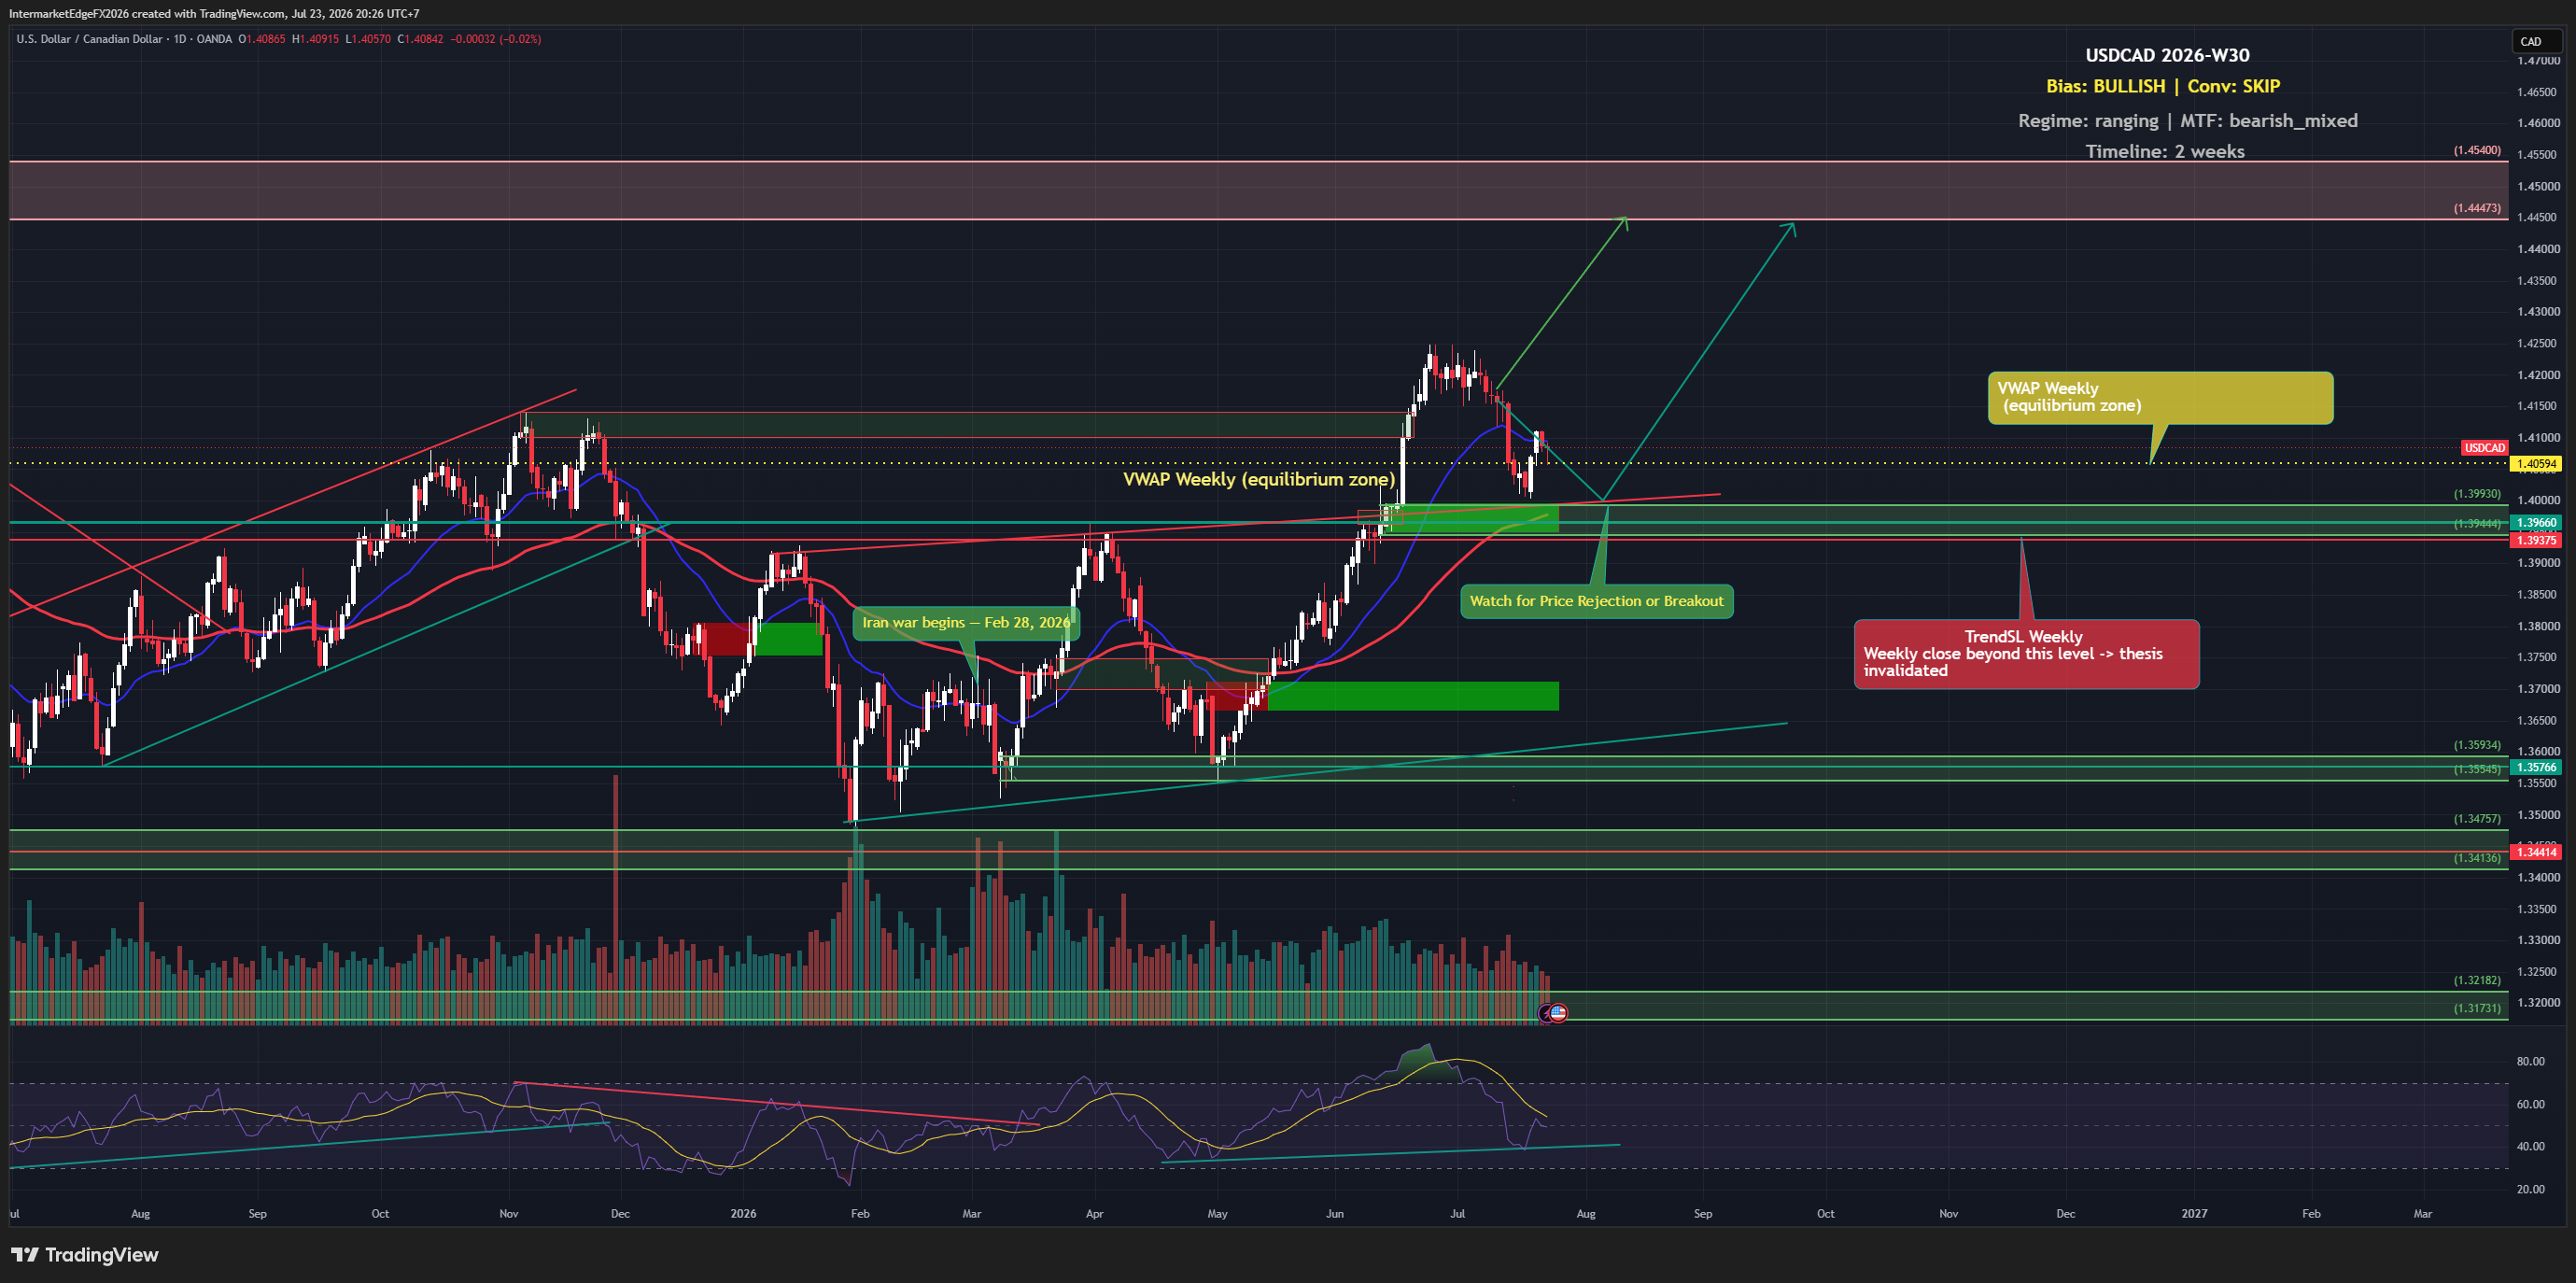
**The Canadian dollar just hit a six-week low. And the reason is not oil.** Everyone watching CAD is focused on the Iran deal decompression and WTI direction. They are missing the more important driver that appeared in today's headline: USMCA headline risk. USMCA is the backbone of Canada-US trade. Approximately 75% of Canadian exports go to the US market. Any renegotiation signal, tariff threat, or deterioration in USMCA terms is a structural CAD negative that operates entirely independently of oil price. CAD can weaken even when oil is rising. That is what is happening right now. The proof is in AUDCAD. AUD is a commodity currency similar to CAD but without USMCA exposure. AUDCAD is sitting at 0.9864, below 1.000. CAD is underperforming AUD. That is not a commodity story. That is a Canada-specific story. USDCAD is now navigating three independent forces simultaneously: USMCA risk - Canada-specific, unrelated to oil, unscheduled catalyst Iran deal oil decompression - WTI bear thesis toward $74-71, structurally bearish CAD Fed-BoC differential - if BoC cuts before Fed on Canada slowdown, rate divergence accelerates USDCAD higher DXY below 100 and the EIA crude draw of 7.9M bbl (from earlier today's analysis) are the counterforces keeping USDCAD flat rather than spiking. The chart shows two competing Elliott Wave counts converging at 1.3842. Both point toward the 1.4099-1.4139 resistance zone as the next major target if bullish drivers align. The wave (b) demand zone at 1.3540-1.3593 is the floor if USMCA reassurance materializes. Two tells to watch: AUDCAD continuing below 0.9864 toward 0.97 = USMCA risk is real, USDCAD rallies AUDCAD bouncing back above 1.00 = USMCA risk fading, USDCAD pulls back The most dangerous scenario: USMCA risk escalates at the same time the Iran deal is signed. Oil drops (bearish CAD) while trade risk increases (also bearish CAD). USDCAD would test 1.42+ with very little resistance. Conviction: Medium. Bias: Mildly bullish USDCA

InterMarketEdge

© 2026 InterMarketEdge. Financial intelligence for inter-market traders.